


转载自:http://blog.sina.com.cn/s/blog_687960370101clxp.html,稍作修改过
FusionCharts官方帮助文档http://docs.fusioncharts.com/charts/
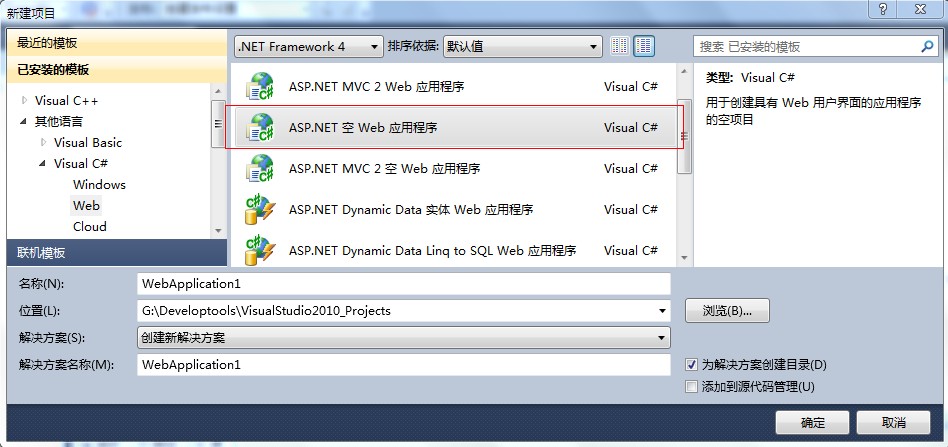
准备工作: (Visual Studio 2010中)
0.新建一个web程序如图:
<graph caption='Monthly Unit Sales' xAxisName='Month' yAxisName='Units' decimalPrecision='0' formatNumberScale='0'>
<set name='Jan' value='462' color='AFD8F8' />
<set name='Feb' value='857' color='F6BD0F' />
<set name='Mar' value='671' color='8BBA00' />
<set name='Apr' value='494' color='FF8E46' />
<set name='May' value='761' color='008E8E' />
<set name='Jun' value='960' color='D64646' />
<set name='Jul' value='629' color='8E468E' />
<set name='Aug' value='622' color='588526' />
<set name='Sep' value='376' color='B3AA00' />
<set name='Oct' value='494' color='008ED6' />
<set name='Nov' value='761' color='9D080D' />
<set name='Dec' value='960' color='A186BE' />
</graph><%@ Page Language="C#" AutoEventWireup="true" CodeBehind="WebForm1.aspx.cs" Inherits="WebApplication1.WebForm1" %>
<%@ Import Namespace="InfoSoftGlobal" %>
<HTML>
<HEAD>
<TITLE>
FusionCharts Free - Simple Column 3D Chart
</TITLE>
</HEAD>
<BODY>
<%
//Create the chart - Column 3D Chart with data from Data/Data.xml
Response.Write(FusionCharts.RenderChartHTML("../FusionCharts/FCF_Column3D.swf","Data/Data.xml", "", "myFirst", "600", "300", false));
%>
</BODY>
</HTML>
介绍RenderChartHtml()的参数:
chartSWF:放在FusionCharts文件中的swf文件;
strURL:存放在文件中的数据
strXML:在Chart中使用dataXML方法获取数据,如果strURL已经用了数据源,这样的话,此参数为空;
chartId:表格ID
chartWidth:表格宽度
chartHeight:表格高度
debugMode:调试模式,仅仅用在FusionCharts v3中
registerWithJS:使用javascript生成表格,仅仅用在FusionCharts v3中
transparent:在网页中使用稳定的背景,仅仅用在FusionCharts v3中
scaleMode:图表的缩放选项,有四种:"noscale", "exactfit", "noborder" and "showall",仅仅用在FusionCharts v3中
bgColor:图表的背景颜色,如果在数据XML文件夹中没有定义背景的颜色,那么这里的设置就将起作用,仅仅用在FusionCharts v3中
language:语言,仅仅用在FusionCharts v3中。
(2)和(1)类似
首先建立一个页面,添加一个asp控件:
<%@ Page Language="C#" %>

<%@ Import Namespace="InfoSoftGlobal" %>
<script runat="server">

    protected void Page_Load(object sender, EventArgs e)
    {
        //Create the chart - Column 3D Chart with data from Data/Data.xml
        FCLiteral.Text = FusionCharts.RenderChart("../FusionCharts/FCF_Column3D.swf", "Data/Data.xml", "", "myFirst", "600", "300", false, false);
    }
</script>
<html>
<head>
    <title>FusionCharts Free - Simple Column 3D Chart </title>
    <%
        //You need to include the following JS file, if you intend to embed the chart using JavaScript.
    %>
    <script language="Javascript" src="../FusionCharts/FusionCharts.js"></script>
</head>
<body>
    <asp:Literal ID="FCLiteral" runat="server"></asp:Literal>
</body>
</html>
(3)使用strXML数据源
首先建立一个页面,添加一个asp控件:
<%@ Page Language="C#" CodeBehind="BasicDataXML.aspx.cs" Inherits="BasicDataXML" %>
<HTML>
<HEAD>
<TITLE>
FusionCharts Free - Simple Column 3D Chart using dataXML method
</TITLE>
</HEAD>
<BODY>
<asp:Literal ID="FCLiteral" runat="server"></asp:Literal>
</BODY>
</HTML>
后台代码BasicDataXML.aspx.cs:
using System;
using System.Data;
using System.Configuration;
using System.Collections;
using System.Web;
using System.Web.Security;
using System.Web.UI;
using System.Web.UI.WebControls;
using System.Web.UI.WebControls.WebParts;
using System.Web.UI.HtmlControls;
using InfoSoftGlobal;

public partial class BasicDataXML : System.Web.UI.Page
{

    protected void Page_Load(object sender, EventArgs e)
    {
        // Generate chart in Literal Control
        FCLiteral.Text = CreateCharts();
    }


    public string CreateCharts()
    {

        //This page demonstrates the ease of generating charts using FusionCharts.
        //For this chart, we've used a string variable to contain our entire XML data.

        //Ideally, you would generate XML data documents at run-time, after interfacing with
        //forms or databases etc.Such examples are also present.
        //Here, we've kept this example very simple.

        //Create an XML data document in a string variable

        string strXML;
        strXML = "";
        strXML += "<graph caption='Monthly Unit Sales' xAxisName='Month' yAxisName='Units' decimalPrecision='0' formatNumberScale='0'>";
        strXML += "<set name='Jan' value='462' color='AFD8F8' />";
        strXML += "<set name='Feb' value='857' color='F6BD0F' />";
        strXML += "<set name='Mar' value='671' color='8BBA00' />";
        strXML += "<set name='Apr' value='494' color='FF8E46'/>";
        strXML += "<set name='May' value='761' color='008E8E'/>";
        strXML += "<set name='Jun' value='960' color='D64646'/>";
        strXML += "<set name='Jul' value='629' color='8E468E'/>";
        strXML += "<set name='Aug' value='622' color='588526'/>";
        strXML += "<set name='Sep' value='376' color='B3AA00'/>";
        strXML += "<set name='Oct' value='494' color='008ED6'/>";
        strXML += "<set name='Nov' value='761' color='9D080D'/>";
        strXML += "<set name='Dec' value='960' color='A186BE'/>";
        strXML += "</graph>";

        //Create the chart - Column 3D Chart with data from strXML variable using dataXML method
        return FusionCharts.RenderChartHTML("../FusionCharts/FCF_Column3D.swf", "", strXML, "myNext", "600", "300", false);
        //return FusionCharts.RenderChartHTML("../FusionCharts/FCF_Column3D.swf", "Data.xml", "", "myNext", "600", "300", false);
       // return FusionCharts.RenderChartHTML("../FusionCharts/FCF_Column3D.swf", "Data/Data.xml", "", "myNext", "600", "300", false);
    }
}
(4)JavaScript生成图表:
在有些浏览器中,显示表格的时候有阻止显示,你需要点击允许运行才可正常显示,用JS实现的话,就可以避免这个问题的出现。
<%@ Page Language="C#" %>

<%@ Import Namespace="InfoSoftGlobal" %>
<script runat="server">

    protected void Page_Load(object sender, EventArgs e)
    {
        //Create the chart - Column 3D Chart with data from Data/Data.xml
        FCLiteral.Text = FusionCharts.RenderChart("../FusionCharts/FCF_Column3D.swf", "Data/Data.xml", "", "myFirst", "600", "300", false, false);
    }
</script>
<html>
<head>
    <title>FusionCharts Free - Simple Column 3D Chart </title>
    <%
        //You need to include the following JS file, if you intend to embed the chart using JavaScript.
    %>
    <script language="Javascript" src="../FusionCharts/FusionCharts.js"></script>
</head>
<body>
    <asp:Literal ID="FCLiteral" runat="server"></asp:Literal>
</body>
</html>
RenderChart()中的参数和
//-------------------------------------------------------------
一个实现一幅图两个柱序列的例子:
WebForm3.aspx:
<%@ Page Language="C#" %>

<%@ Import Namespace="InfoSoftGlobal" %>
<script runat="server">

    protected void Page_Load(object sender, EventArgs e)
    {
        //Create the chart - Column 3D Chart with data from Data/Data.xml
        FCLiteral.Text = FusionCharts.RenderChart("../FusionCharts/FCF_MSColumn3D.swf", "Data/Data1.xml", "", "myFirst", "600", "300", false, false);
    }
</script>
<html>
<head>
    <title>FusionCharts Free - Simple Column 3D Chart </title>
    <%
        //You need to include the following JS file, if you intend to embed the chart using JavaScript.
    %>
    <script language="Javascript" src="../FusionCharts/FusionCharts.js"></script>
</head>
<body>
    <asp:Literal ID="FCLiteral" runat="server"></asp:Literal>
</body>
</html>
要显示的数据:Data1.xml
<graph palette='5' caption='Product Sales' xAxisName='Month' yAxisName='Sales' numberPrefix='$'  rotateValues='1' placeValuesInside='1' forceYAxisValueDecimals='1'  yAxisValueDecimals='2'>

  <categories>

    <category label='January' />

    <category label='February' />

    <category label='March' />

    <category label='April' />

    <category label='May' />

    <category label='June' />

  </categories>

  <dataset seriesname='Product A' color='FDC12E' showValues='1'>

    <set value='8343' />

    <set value='6983' />

    <set value='7658' />

    <set value='8345' />

    <set value='8195' />

    <set value='7684'/>

  </dataset>

  <dataset seriesname='Product B' color='56B9F9'  showValues='1'>

    <set value='2446' />

    <set value='3935' />

    <set value='3452'  />

    <set value='4424' />

    <set value='4925' />

    <set value='4328' />

  </dataset>

</graph>
项目下载地址 http://download.csdn.net/detail/mao906581468/5470793


 399
399


 被折叠的 条评论
为什么被折叠?
被折叠的 条评论
为什么被折叠?
 到【灌水乐园】发言


