


“
作者:小刚 一位苦于信息安全的萌新小白帽, 记得 本实验仅用于信息防御教学,切勿用于它用途
”
本实验仅用于信息防御教学,切勿用于它用途
”
 学习用python实现对excel的操作,并按照姓名成绩制作一个
柱状图
(需要一丢丢的基础)
学习用python实现对excel的操作,并按照姓名成绩制作一个
柱状图
(需要一丢丢的基础)
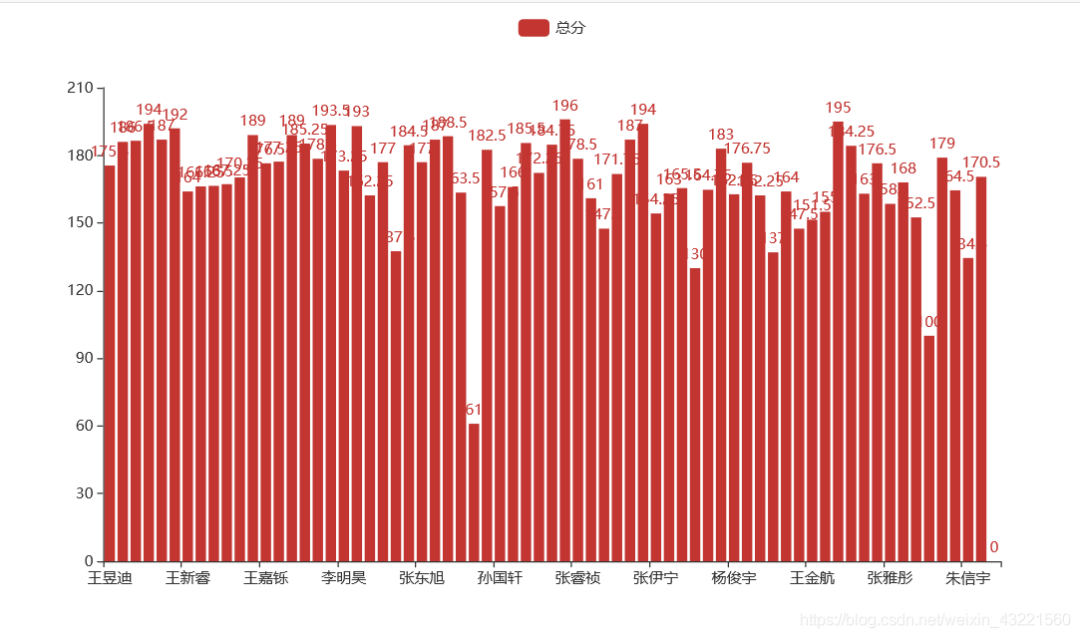
效果图
案例表格是某学校的 成绩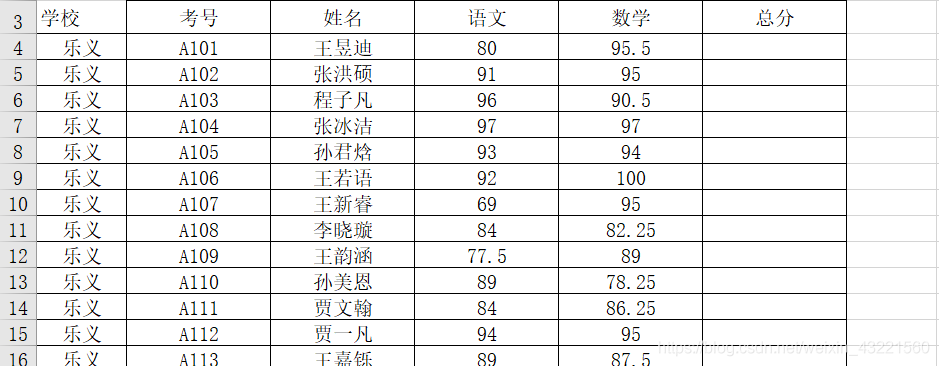 算出成绩总和,提取姓名,成绩。
柱状图效果展示
实现代码
自行安装py库pycharts和xlrdfrom pyecharts.charts import Bar #柱状图import xlrd #xlrd是对excel读取(read) xlwt是写入(write)data = xlrd.open_workbook('123.xls') #打开本地excel表格#print(data) #显示文件的内存地址table = data.sheets()[0] #拿出表格的第一个sheetprint(table.nrows) #显示多少行print(table.ncols) #显示多少列#print(table.row_values(0)) #打印第几行内容#print(table.col_values(0)) #打印第几列内容names = [] #画图用的x轴,坐标是姓名sources = [] #画图用的y轴,坐标成绩#循环输出每行内容for i in range(3,table.nrows): a = table.row_values(i) #把第几行拿出来作为一个列表 a[5] = table.row_values(i)[3]+table.row_values(i)[4] #求成绩总和 print(a) name = a[2] #姓名提取加入name列表 names.append(name) source = a[5] #总成绩提取加入sale列表 sources.append(source) # print(names)# print(sales)bar = Bar() #创建一个柱状图对象bar.add_xaxis(names) #设置x轴bar.add_yaxis('成绩总分',sources) #设置y轴和图标名bar.render('666.html') #输出html文件来显示柱状图备注xlrd是支持 老版本 的excel( 2003 及以后的)xls,xlsx格式
openpyxl支持 excel2007 版本以后的,xlsx格式
在很多银行公司还在使用excel2003的可以使用xlrd库。


 6031
6031


 被折叠的 条评论
为什么被折叠?
被折叠的 条评论
为什么被折叠?
 到【灌水乐园】发言


