


目录
前言
之前写pandas和matplotlib的时候说到了想要出一期Pyechart系列数据可视化的文章。比起matplotlib,pyeacharts的图表要丰富而且好看,这取决于它是基于百度团队使用Javascript开发的商业级数据图表。而且pyechart文档全,便于开发和阅读文档,熟练掌握后是一种非常好用的数据可视化的工具之一。当然相比pandas的plot代码会繁琐一些,其中一些操作类方法也是比较复杂的,需要对其有个大概的掌握才能作出满意的图表。
在我之前的文章中也有好几次使用到了pyechart方法,但是我觉得既然是完成一些数据可视化的操作应该就要快速可呈现,作为数据处理能够得到解析出想要的数据就足够了,如果有个业务小组完全可以将这一部分交给前端去渲染就好了,主要还是快速出图表给我们自己看,用于调整代码而已。那么废话不多说了开始吧!
上篇文章写树形图的文章缺少几个属性参数的说明以及衍生图形并没有代码展示出来,这篇文章将会补上。
Tree衍生图
1.Tree参数
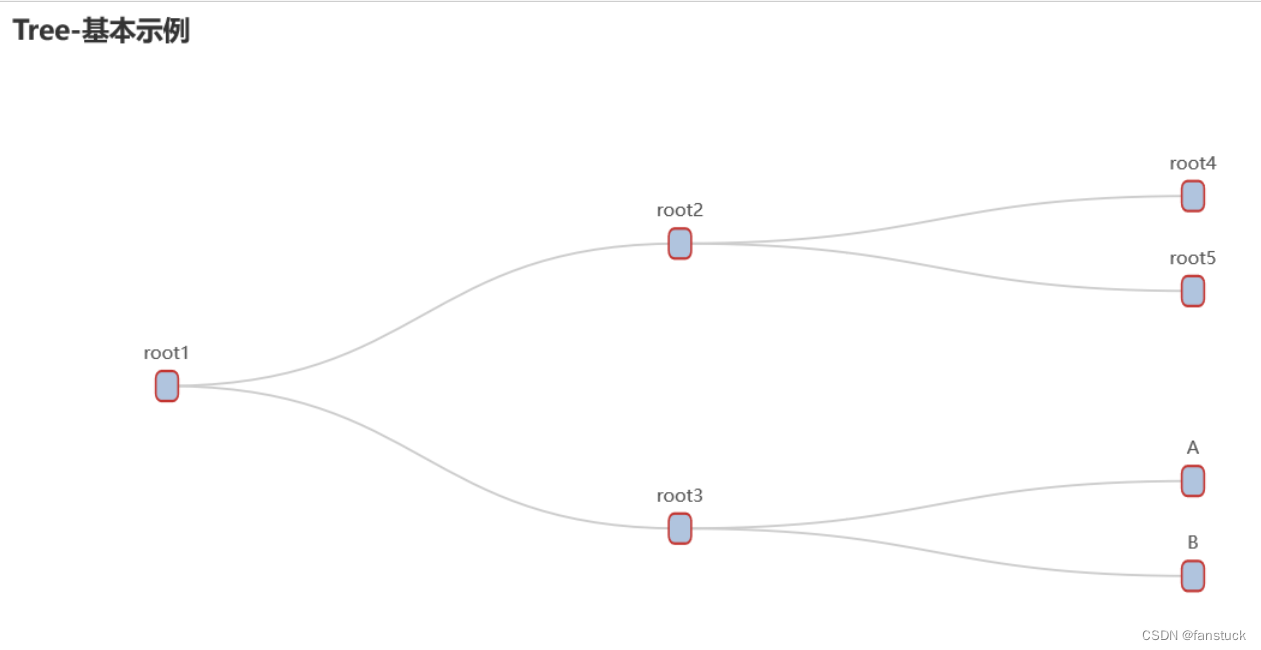
设置树状图形状为向上延伸:
date=[{'children': [{'children': [{'children': [{'name': 'C'}, {'name': 'D'}], 'name': 'root4'}, {'children': [{'name': 'E'}, {'name': 'F'}, {'name': 'G'}], 'name': 'root5'}], 'name': 'root2'}, {'children': [{'name': 'A'}, {'name': 'B'}], 'name': 'root3'}], 'name': 'root1'}, {'children': [{'children': [{'name': 'C'}, {'name': 'D'}], 'name': 'root4'}, {'children': [{'name': 'E'}, {'name': 'F'}, {'name': 'G'}], 'name': 'root5'}], 'name': 'root2'}, {'children': [{'name': 'A'}, {'name': 'B'}], 'name': 'root3'}, {'children': [{'name': 'C'}, {'name': 'D'}], 'name': 'root4'}, {'children': [{'name': 'E'}, {'name': 'F'}, {'name': 'G'}], 'name': 'root5'}]

c = (
    Tree()
    .add("", date,orient="BT")
    .set_global_opts(title_opts=opts.TitleOpts(title="Tree-基本示例"))
    .render_notebook()
)
c 
1.系列数据项
data: Sequence[Union[opts.TreeItem, dict]],2.布局
树图的布局,有‘正交’和‘径向’两种。这里的正交布局,就是我们通常所说的'水平'和'垂直'方向,对应的参数取值为 'orthogonal' 。而 径向布局 是指以根节点为圆心,每一层节点为环, 一层层向外发散绘制而成的布局,对应的参数取值为 'radial'。
c = (
    Tree()
    .add("",
         date,
         orient="BT",
         layout="radial"
        )
    .set_global_opts(title_opts=opts.TitleOpts(title="Tree-基本示例"))
    .render_notebook()
) 
3.图形
标记的图形。ECharts 提供的标记类型包括 'emptyCircle', 'circle', 'rect', 'roundRect',
1.rect会变为正方形
c = (
    Tree()
    .add("",
         date,
         orient="BT",
         layout="radial",
         symbol="rect"
        )
    .set_global_opts(title_opts=opts.TitleOpts(title="Tree-基本示例"))
    .render_notebook()
) 
2.circle会实心

3.roundRect实心

4.标记大小
标记的大小,可以设置成诸如 10 这样单一的数字,也可以用数组分开表示宽和高,例如 [20, 10] 表示标记宽为 20,高为 10。
c = (
    Tree()
    .add("",
         date,
         orient="BT",
         layout="radial",
         symbol="roundRect",
         symbol_size ='15'
        )
    .set_global_opts(title_opts=opts.TitleOpts(title="Tree-基本示例"))
    .render_notebook()
)
可以设定为矩阵[15,20]:

5.方向
树图中 正交布局 的方向,也就是说只有在 layout = 'orthogonal' 的时候,该配置项才生效。对应有 水平 方向的 从左到右,从右到左;以及垂直方向的从上到下,从下到上。取值分别为 'LR' , 'RL', 'TB', 'BT'。注意,之前的配置项值 'horizontal',等同于 'LR', 'vertical' 等同于 'TB'。
c = (
    Tree()
    .add("",
         date,
         orient="LR",
         layout="orthogonal",
         symbol="roundRect",
         symbol_size =[15,20],

        )
    .set_global_opts(title_opts=opts.TitleOpts(title="Tree-基本示例"))
    .render_notebook()
) 
"RL"

"TB"

6.tree组件离容器
这里有:
pos_top:tree组件离容器上侧的距离。
top 的值可以是像 20 这样的具体像素值,可以是像 '20%' 这样相对于容器高宽的百分比,也可以是 'top', 'middle', 'bottom'。如果 top 的值为'top', 'middle', 'bottom',组件会根据相应的位置自动对齐。
c = (
    Tree()
    .add("",
         date,
         orient="TB",
         layout="orthogonal",
         symbol="roundRect",
         symbol_size =[15,20],
         pos_top=20
        )
    .set_global_opts(title_opts=opts.TitleOpts(title="Tree-基本示例"))
    .render_notebook()
)
还有pos_left,pos_bottom,pos_right。
7.折叠节点间隔
通过设定collapse_interval来决定多少节点。
8.边的形状
分别有曲线和折线两种,对应的取值是 curve 和 polyline.注意:该配置项只在 正交布局 下有效,在经向布局下的开发环境中会报错。
c = (
    Tree()
    .add("",
         date,
         orient="TB",
         layout="orthogonal",
         symbol="roundRect",
         symbol_size =[15,20],
         collapse_interval=10,
         edge_shape="polyline"
        )
    .set_global_opts(title_opts=opts.TitleOpts(title="Tree-基本示例"))
    .render_notebook()
) 
还有一些其他的参数并不是很重要调整,需要操作的可以去看:pyecharts - A Python Echarts Plotting Library built with love.
点关注,防走丢,如有纰漏之处,请留言指教,非常感谢
以上就是本期全部内容。我是fanstuck ,有问题大家随时留言讨论 ,我们下期见


 1080
1080


 被折叠的 条评论
为什么被折叠?
被折叠的 条评论
为什么被折叠?
 到【灌水乐园】发言


