


mathematica 问题询问
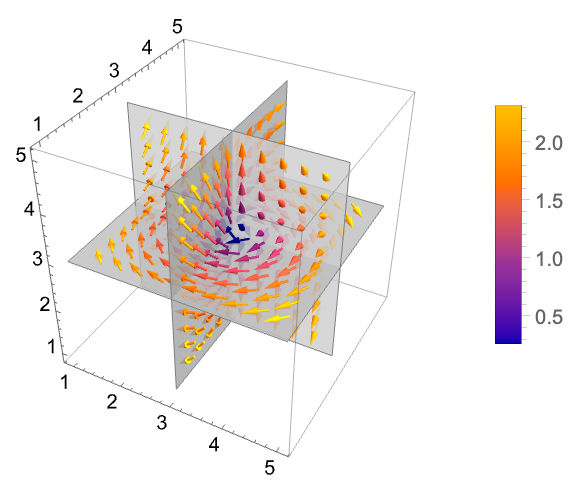
以下是绘图代码, 我想绘制z 这样的3D 矢量图并且颜色映射为向量与 x 轴的夹角https://reference.wolfram.com/language/ref/Files/ListSliceVectorPlot3D.zh/O_37.png
但是为什么我的代码颜色映射不了,显示的是一个纯色的图,并且更改与箭头有关的参数无效。求助各位大神。🙏🙏🙏
data = Import["/Users/xmh/Desktop/reslocalu", "Table"];
filteredData = Select[data, 0 < #[[3]] < 7 &];
positions = filteredData[[All, 1 ;; 3]]; (*x,y,z 坐标*)
lengths = filteredData[[All, 4 ;; 6]]; (*矢量分量*)
xRange =
Range[Min[positions[[All, 1]]], Max[positions[[All, 1]]], 1];
yRange =
Range[Min[positions[[All, 2]]], Max[positions[[All, 2]]], 1];
zRange = Range[Min[positions[[All, 3]]], Max[positions[[All, 3]]], 1];
gridData =
ConstantArray[{0, 0, 0}, {Length[xRange], Length[yRange],
Length[zRange]}];
Do[Module[{xIndex, yIndex, zIndex},
xIndex = Position[xRange, positions[[i, 1]]][[1, 1]];
yIndex = Position[yRange, positions[[i, 2]]][[1, 1]];
zIndex = Position[zRange, positions[[i, 3]]][[1, 1]];
gridData[[xIndex, yIndex, zIndex]] = lengths[[i]];], {i, 1,
Length[positions]}];
angles = ArcCos[Normalize /@ lengths[[All, 1 ;; 3]]][[All, 1]];
anglesNormalized = Rescale[angles, {Min[angles], Max[angles]}, {0, 1}];
colorizedVectors =
MapThread[{#1, ColorData["Rainbow"][#2]} &, {lengths,
anglesNormalized}];
gridData =
ConstantArray[{0, 0, 0}, {Length[xRange], Length[yRange],
Length[zRange]}];
Do[Module[{xIndex, yIndex, zIndex},
xIndex = Position[xRange, positions[[i, 1]]][[1, 1]];
yIndex = Position[yRange, positions[[i, 2]]][[1, 1]];
zIndex = Position[zRange, positions[[i, 3]]][[1, 1]];
gridData[[xIndex, yIndex, zIndex]] =
colorizedVectors[[i, 1]];], {i, 1, Length[positions]}];
VectorMarkers -> {"Arrow", 13},
VectorScaling -> Automatic,
VectorColorFunction ->
Function[{x, y, z, vx, vy, vz},
Module[{angle = ArcCos[Normalize[{vx, vy, vz}][[1]]]},
ColorData["Rainbow"][Rescale[angle, {0, Pi}]]]], PlotRange -> All,
PlotLegends -> Automatic]


 1296
1296

 被折叠的 条评论
为什么被折叠?
被折叠的 条评论
为什么被折叠?
 到【灌水乐园】发言


