


实现思路:先用蛛网图,然后填充渲染出基础雷达,再进行数据渲染,并重写蛛网图的连线方法,移除非数据交点,添加数据标签
1. 导入依赖
1.5.0版本以上应该都可以直接复制运行,如版本不同可能部分方法不可用,可按思路修改为对应版本类似方法
    <dependency>
      <groupId>org.jfree</groupId>
      <artifactId>jfreechart</artifactId>
      <version>1.5.3</version>
    </dependency>
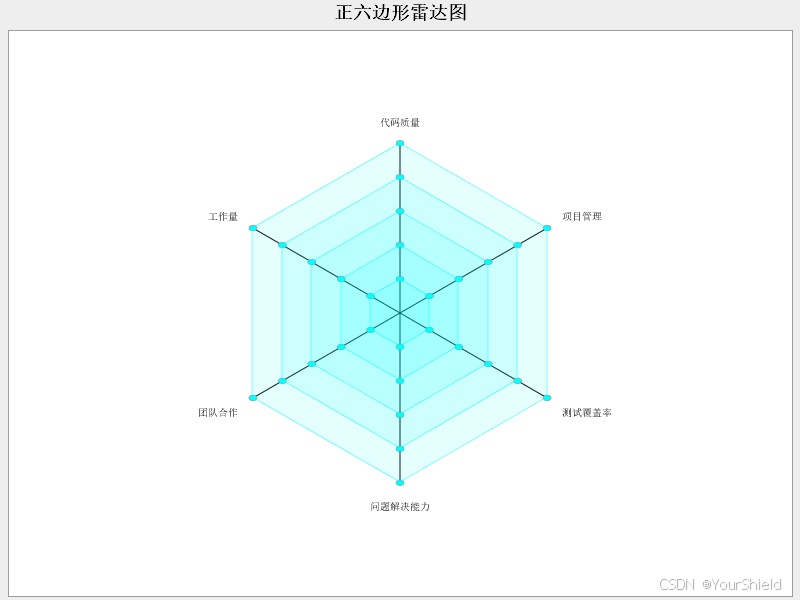
2. 渲染基础雷达图
import java.awt.Color;
import java.io.File;
import java.io.IOException;
import javax.swing.JFrame;
import org.jfree.chart.ChartUtils;
import org.jfree.chart.JFreeChart;
import org.jfree.chart.plot.SpiderWebPlot;
import org.jfree.data.category.DefaultCategoryDataset;

public class RadarChartExample extends JFrame {

  //最大值,也是轴的最大长度
  private static final double maxValue = 5;
  //几等份
  private static final int division = 5;

  public static void main(String[] args) throws IOException {
    //指标项
    String[] columns = {"代码质量", "项目管理", "测试覆盖率", "问题解决能力", "团队合作", "工作量"};
    //数据的值
    Integer[] values = {3, 4, 2, 5, 4, 3};
    SpiderWebPlot plot = createRadarPlot(columns);
    // 创建图表
    JFreeChart radarChart = new JFreeChart("正六边形雷达图", JFreeChart.DEFAULT_TITLE_FONT, plot, false);
    // 将图表嵌入到 Swing 面板中
    ChartUtils.saveChartAsJPEG(new File("雷达图.jpeg"), radarChart, 800, 600);
  }

  private static SpiderWebPlot createRadarPlot(String[] columns) {
    // 创建数据集
    DefaultCategoryDataset dataset = createDataset(columns);
    // 创建蛛网图
    SpiderWebPlot plot = new SpiderWebPlot(dataset);
    //设置最大值为5
    plot.setMaxValue(maxValue);
    //开始角度
    plot.setStartAngle(90);
    //设置中心间距
    plot.setInteriorGap(0.4);
    //设置雷达图的颜色
    for (int i = 0; i < division; i++) {
      plot.setSeriesPaint(i, Color.cyan);
    }
    return plot;
  }

  /**
   * 创建数据集
   *
   * @param level   数据集的层级,决定了系列的数量
   * @param columns 数据集的列标签数组
   * @return 返回创建的DefaultCategoryDataset类型的数据集
   * @throws IllegalArgumentException 如果列标签数组为null或空,抛出此异常
   */
  private static DefaultCategoryDataset createDataset(String[] columns) {
    // 参数校验
    if (columns == null || columns.length == 0) {
      throw new IllegalArgumentException("Columns array cannot be null or empty.");
    }
    DefaultCategoryDataset dataset = new DefaultCategoryDataset();
    //每等份的值
    double divisionValue = maxValue / division;
    // 循环添加数据,形成最基本的雷达图
    for (int columnIndex = 0; columnIndex < columns.length; columnIndex++) {
      for (int seriesIndex = 1; seriesIndex <= maxValue; seriesIndex++) {
        // 添加数据
        dataset.addValue(divisionValue * seriesIndex, "Series " + seriesIndex,
            columns[columnIndex]);
      }
    }
    return dataset;
  }
}
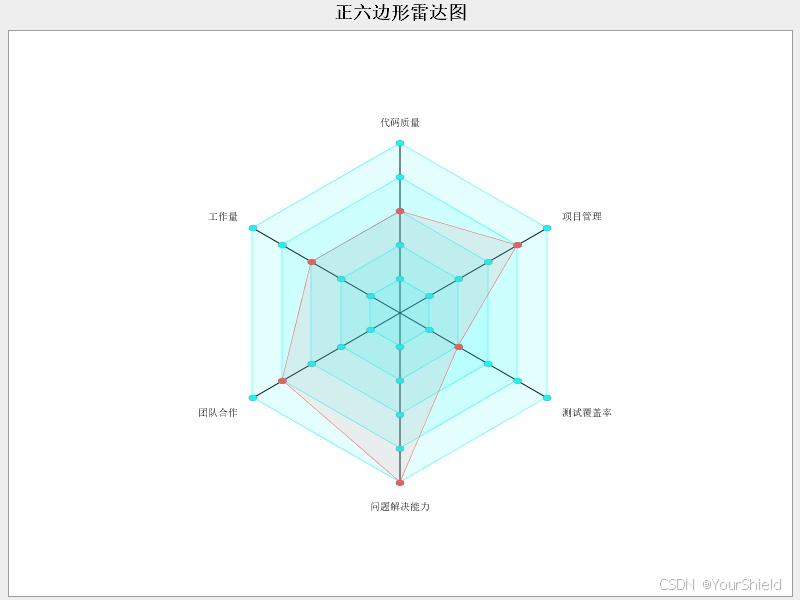
3.渲染数据
package com.xp.excel;

import java.awt.Color;
import java.io.File;
import java.io.IOException;
import javax.swing.JFrame;
import org.jfree.chart.ChartUtils;
import org.jfree.chart.JFreeChart;
import org.jfree.chart.plot.SpiderWebPlot;
import org.jfree.data.category.DefaultCategoryDataset;

public class RadarChartExample extends JFrame {

  //最大值,也是轴的最大长度
  private static final double MAX_VALUE = 5;
  //几等份
  private static final int DIVISION = 5;

  private static final String DATA_ROW_KEY = "DATA_ROW_KEY";

  public static void main(String[] args) throws IOException {
    //指标项
    String[] columns = {"代码质量", "项目管理", "测试覆盖率", "问题解决能力", "团队合作", "工作量"};
    //数据的值
    Integer[] values = {3, 4, 2, 5, 4, 3};
    SpiderWebPlot plot = createRadarPlot(columns);
    plot.setDataset(renderData(plot, values, columns));
    // 创建图表
    JFreeChart radarChart = new JFreeChart("正六边形雷达图", JFreeChart.DEFAULT_TITLE_FONT, plot, false);
    // 将图表嵌入到 Swing 面板中
    ChartUtils.saveChartAsJPEG(new File("雷达图.jpeg"), radarChart, 800, 600);
  }

  private static DefaultCategoryDataset renderData(SpiderWebPlot plot, Integer[] values,
      String[] columns) {
    DefaultCategoryDataset dataset = (DefaultCategoryDataset) plot.getDataset();
    for (int i = 0; i < columns.length; i++) {
      dataset.addValue(values[i], DATA_ROW_KEY, columns[i]);
    }
    return dataset;
  }

  private static SpiderWebPlot createRadarPlot(String[] columns) {
    // 创建数据集
    DefaultCategoryDataset dataset = createDataset(columns);
    // 创建蛛网图
    SpiderWebPlot plot = new SpiderWebPlot(dataset);
    //设置最大值为5
    plot.setMaxValue(MAX_VALUE);
    //开始角度
    plot.setStartAngle(90);
    //设置中心间距
    plot.setInteriorGap(0.4);
    //设置雷达图的颜色
    for (int i = 0; i < DIVISION; i++) {
      plot.setSeriesPaint(i, Color.cyan);
    }
    return plot;
  }

  /**
   * 创建数据集
   *
   * @param level   数据集的层级,决定了系列的数量
   * @param columns 数据集的列标签数组
   * @return 返回创建的DefaultCategoryDataset类型的数据集
   * @throws IllegalArgumentException 如果列标签数组为null或空,抛出此异常
   */
  private static DefaultCategoryDataset createDataset(String[] columns) {
    // 参数校验
    if (columns == null || columns.length == 0) {
      throw new IllegalArgumentException("Columns array cannot be null or empty.");
    }
    DefaultCategoryDataset dataset = new DefaultCategoryDataset();
    //每等份的值
    double divisionValue = MAX_VALUE / DIVISION;
    // 循环添加数据,形成最基本的雷达图
    for (int columnIndex = 0; columnIndex < columns.length; columnIndex++) {
      for (int seriesIndex = 1; seriesIndex <= MAX_VALUE; seriesIndex++) {
        // 添加数据
        dataset.addValue(divisionValue * seriesIndex, "Series " + seriesIndex,
            columns[columnIndex]);
      }
    }
    return dataset;
  }
}
4.渲染效果调整
- 轴线样式、粗细调整
- 删除除数据与轴线交点的其他交点
- 添加对应数据的数据标签
package com.xp.excel;

import java.awt.AlphaComposite;
import java.awt.Graphics2D;
import java.awt.Paint;
import java.awt.Polygon;
import java.awt.Rectangle;
import java.awt.Shape;
import java.awt.Stroke;
import java.awt.geom.Ellipse2D;
import java.awt.geom.Point2D;
import java.awt.geom.Rectangle2D;
import org.apache.commons.lang3.StringUtils;
import org.jfree.chart.entity.CategoryItemEntity;
import org.jfree.chart.entity.EntityCollection;
import org.jfree.chart.plot.PlotRenderingInfo;
import org.jfree.chart.plot.SpiderWebPlot;
import org.jfree.chart.util.TableOrder;
import org.jfree.data.category.CategoryDataset;

/**
 * @author:pan
 * @date:2024/9/25
 */
public class MySpiderWebPlot extends SpiderWebPlot {

  private String dataRowKey;

  public MySpiderWebPlot(CategoryDataset dataset, String dataRowKey) {
    super(dataset);
    this.dataRowKey = dataRowKey;
  }

  @Override
  protected void drawRadarPoly(Graphics2D g2, Rectangle2D plotArea, Point2D centre,
      PlotRenderingInfo info, int series, int catCount, double headH, double headW) {
    Polygon polygon = new Polygon();
    EntityCollection entities = null;
    if (info != null) {
      entities = info.getOwner().getEntityCollection();
    }
    // plot the data...
    for (int cat = 0; cat < catCount; cat++) {
      Number dataValue = getPlotValue(series, cat);
      if (dataValue != null) {
        double value = dataValue.doubleValue();
        if (value >= 0) { // draw the polygon series...

          // Finds our starting angle from the centre for this axis

          double angle = getStartAngle()
              + (getDirection().getFactor() * cat * 360 / catCount);

          // The following angle calc will ensure there isn't a top
          // vertical axis - this may be useful if you don't want any
          // given criteria to 'appear' move important than the
          // others..
          //  + (getDirection().getFactor()
          //        * (cat + 0.5) * 360 / catCount);

          // find the point at the appropriate distance end point
          // along the axis/angle identified above and add it to the
          // polygon

          Point2D point = getWebPoint(plotArea, angle, value / super.getMaxValue());
          polygon.addPoint((int) point.getX(), (int) point.getY());

          // put an elipse at the point being plotted..
          //如果不是数据交点,不画椭圆交点
          if (StringUtils.equals(dataRowKey, super.getDataset().getRowKey(series).toString())) {
            drawLevelLabel(g2, point, value, centre);
            drawHead(g2, series, headH, headW, point);
          }

          if (entities != null) {
            int row, col;
            if (super.getDataExtractOrder() == TableOrder.BY_ROW) {
              row = series;
              col = cat;
            } else {
              row = cat;
              col = series;
            }
            String tip = null;
            if (super.getToolTipGenerator() != null) {
              tip = super.getToolTipGenerator().generateToolTip(
                  super.getDataset(), row, col);
            }

            String url = null;
            if (super.getURLGenerator() != null) {
              url = super.getURLGenerator().generateURL(super.getDataset(),
                  row, col);
            }

            Shape area = new Rectangle(
                (int) (point.getX() - headW),
                (int) (point.getY() - headH),
                (int) (headW * 2), (int) (headH * 2));
            CategoryItemEntity entity = new CategoryItemEntity(
                area, tip, url, super.getDataset(),
                super.getDataset().getRowKey(row),
                super.getDataset().getColumnKey(col));
            entities.add(entity);
          }

        }
      }
    }
    Paint paint = getSeriesPaint(series);
    g2.setPaint(paint);
    g2.setStroke(getSeriesOutlineStroke(series));
    g2.draw(polygon);
    if (super.isWebFilled()) {
      g2.setComposite(AlphaComposite.getInstance(AlphaComposite.SRC_OVER,
          0.1f));
      g2.fill(polygon);
      g2.setComposite(AlphaComposite.getInstance(AlphaComposite.SRC_OVER,
          getForegroundAlpha()));
    }

  }

  /**
   * 绘制等级标签的方法
   *
   * 此方法负责在图形中绘制数据点的等级标签,标签的位置基于数据点的坐标和一个中心点的相对位置来确定,
   * 以避免标签叠加
   *
   * @param g2 执行绘制操作的Graphics2D对象
   * @param point 数据点的坐标
   * @param value 数据点的值,用于确定等级
   * @param centre 中心点的坐标,用于计算标签的偏移量
   */
  private void drawLevelLabel(Graphics2D g2, Point2D point, double value,
      Point2D centre) {
    // 根据数据点的值获取对应的等级名称
    String levelLabel = Level.getLevelName((int) value);
    // 根据数据点与中心点的相对位置,计算X轴和Y轴的偏移量,以避免标签重叠
    float xOffset = (float) (point.getX() <= centre.getX() ? point.getX() - 10 : point.getX() + 10);
    float yOffset = (float) (point.getY() <= centre.getY() ? point.getY() - 10 : point.getY() + 10);
    // 绘制等级标签,使用计算出的偏移量确定标签的位置
    g2.drawString(levelLabel, xOffset, yOffset);
  }

  /**
   * 绘制数据点的交点
   *
   * @param g2 绘图对象,用于执行绘图操作
   * @param series 数据序列标识,用于确定颜色和样式
   * @param headH 头部高度
   * @param headW 头部宽度
   * @param point 数据点的位置
   */
  private void drawHead(Graphics2D g2, int series, double headH, double headW, Point2D point) {
    // 获取数据序列的填充颜色
    Paint paint = getSeriesPaint(series);
    // 获取数据序列的轮廓颜色
    Paint outlinePaint = getSeriesOutlinePaint(series);
    // 获取数据序列的轮廓线条样式
    Stroke outlineStroke = getSeriesOutlineStroke(series);
    // 创建头部椭圆形状
    Ellipse2D head = new Ellipse2D.Double(point.getX()
        - headW / 2, point.getY() - headH / 2, headW,
        headH);
    // 设置绘图对象的填充颜色
    g2.setPaint(paint);
    // 绘制头部椭圆形状的填充部分
    g2.fill(head);
    // 设置绘图对象的线条样式
    g2.setStroke(outlineStroke);
    // 设置绘图对象的轮廓颜色
    g2.setPaint(outlinePaint);
    // 绘制头部椭圆形状的轮廓部分
    g2.draw(head);
  }
}
public enum Level {
  A(5),
  B(4),
  C(3),
  D(2),
  E(1),
  F(0);

  private final int value;

  Level(int value) {
    this.value = value;
  }

  public int getValue() {
    return value;
  }

  public static String getLevelName(int value) {
    for (Level level : Level.values()) {
      if (level.getValue() == value) {
        return level.name();
      }
    }
    return Level.F.name();
  }
}
import java.awt.AlphaComposite;
import java.awt.Graphics2D;
import java.awt.Paint;
import java.awt.Polygon;
import java.awt.Rectangle;
import java.awt.Shape;
import java.awt.Stroke;
import java.awt.geom.Ellipse2D;
import java.awt.geom.Point2D;
import java.awt.geom.Rectangle2D;
import org.apache.commons.lang3.StringUtils;
import org.jfree.chart.entity.CategoryItemEntity;
import org.jfree.chart.entity.EntityCollection;
import org.jfree.chart.plot.PlotRenderingInfo;
import org.jfree.chart.plot.SpiderWebPlot;
import org.jfree.chart.util.TableOrder;
import org.jfree.data.category.CategoryDataset;

/**
 * @author:pan
 * @date:2024/9/25
 * 重写绘制图线方法,移除非数据交点绘制,添加数据标签
 */
public class MySpiderWebPlot extends SpiderWebPlot {

  private String dataRowKey;

  public MySpiderWebPlot(CategoryDataset dataset, String dataRowKey) {
    super(dataset);
    this.dataRowKey = dataRowKey;
  }

  @Override
  protected void drawRadarPoly(Graphics2D g2, Rectangle2D plotArea, Point2D centre,
      PlotRenderingInfo info, int series, int catCount, double headH, double headW) {
    Polygon polygon = new Polygon();
    EntityCollection entities = null;
    if (info != null) {
      entities = info.getOwner().getEntityCollection();
    }
    // plot the data...
    for (int cat = 0; cat < catCount; cat++) {
      Number dataValue = getPlotValue(series, cat);
      if (dataValue != null) {
        double value = dataValue.doubleValue();
        if (value >= 0) { // draw the polygon series...

          // Finds our starting angle from the centre for this axis

          double angle = getStartAngle()
              + (getDirection().getFactor() * cat * 360 / catCount);

          // The following angle calc will ensure there isn't a top
          // vertical axis - this may be useful if you don't want any
          // given criteria to 'appear' move important than the
          // others..
          //  + (getDirection().getFactor()
          //        * (cat + 0.5) * 360 / catCount);

          // find the point at the appropriate distance end point
          // along the axis/angle identified above and add it to the
          // polygon

          Point2D point = getWebPoint(plotArea, angle, value / super.getMaxValue());
          polygon.addPoint((int) point.getX(), (int) point.getY());

          // put an elipse at the point being plotted..
          //如果不是数据交点,不画椭圆交点
          if (StringUtils.equals(dataRowKey, super.getDataset().getRowKey(series).toString())) {
            drawLevelLabel(g2, point, value, centre);
            drawHead(g2, series, headH, headW, point);
          }

          if (entities != null) {
            int row, col;
            if (super.getDataExtractOrder() == TableOrder.BY_ROW) {
              row = series;
              col = cat;
            } else {
              row = cat;
              col = series;
            }
            String tip = null;
            if (super.getToolTipGenerator() != null) {
              tip = super.getToolTipGenerator().generateToolTip(
                  super.getDataset(), row, col);
            }

            String url = null;
            if (super.getURLGenerator() != null) {
              url = super.getURLGenerator().generateURL(super.getDataset(),
                  row, col);
            }

            Shape area = new Rectangle(
                (int) (point.getX() - headW),
                (int) (point.getY() - headH),
                (int) (headW * 2), (int) (headH * 2));
            CategoryItemEntity entity = new CategoryItemEntity(
                area, tip, url, super.getDataset(),
                super.getDataset().getRowKey(row),
                super.getDataset().getColumnKey(col));
            entities.add(entity);
          }

        }
      }
    }
    Paint paint = getSeriesPaint(series);
    g2.setPaint(paint);
    g2.setStroke(getSeriesOutlineStroke(series));
    g2.draw(polygon);
    if (super.isWebFilled()) {
      g2.setComposite(AlphaComposite.getInstance(AlphaComposite.SRC_OVER,
          0.1f));
      g2.fill(polygon);
      g2.setComposite(AlphaComposite.getInstance(AlphaComposite.SRC_OVER,
          getForegroundAlpha()));
    }

  }

  /**
   * 绘制等级标签的方法
   *
   * 此方法负责在图形中绘制数据点的等级标签,标签的位置基于数据点的坐标和一个中心点的相对位置来确定,
   * 以避免标签叠加
   *
   * @param g2 执行绘制操作的Graphics2D对象
   * @param point 数据点的坐标
   * @param value 数据点的值,用于确定等级
   * @param centre 中心点的坐标,用于计算标签的偏移量
   */
  private void drawLevelLabel(Graphics2D g2, Point2D point, double value,
      Point2D centre) {
    // 根据数据点的值获取对应的等级名称
    String levelLabel = Level.getLevelName((int) value);
    // 根据数据点与中心点的相对位置,计算X轴和Y轴的偏移量,以避免标签重叠
    float xOffset = (float) (point.getX() <= centre.getX() ? point.getX() - 10 : point.getX() + 10);
    float yOffset = (float) (point.getY() <= centre.getY() ? point.getY() - 10 : point.getY() + 10);
    // 绘制等级标签,使用计算出的偏移量确定标签的位置
    g2.drawString(levelLabel, xOffset, yOffset);
  }

  /**
   * 绘制数据点的交点
   *
   * @param g2 绘图对象,用于执行绘图操作
   * @param series 数据序列标识,用于确定颜色和样式
   * @param headH 头部高度
   * @param headW 头部宽度
   * @param point 数据点的位置
   */
  private void drawHead(Graphics2D g2, int series, double headH, double headW, Point2D point) {
    // 获取数据序列的填充颜色
    Paint paint = getSeriesPaint(series);
    // 获取数据序列的轮廓颜色
    Paint outlinePaint = getSeriesOutlinePaint(series);
    // 获取数据序列的轮廓线条样式
    Stroke outlineStroke = getSeriesOutlineStroke(series);
    // 创建头部椭圆形状
    Ellipse2D head = new Ellipse2D.Double(point.getX()
        - headW / 2, point.getY() - headH / 2, headW,
        headH);
    // 设置绘图对象的填充颜色
    g2.setPaint(paint);
    // 绘制头部椭圆形状的填充部分
    g2.fill(head);
    // 设置绘图对象的线条样式
    g2.setStroke(outlineStroke);
    // 设置绘图对象的轮廓颜色
    g2.setPaint(outlinePaint);
    // 绘制头部椭圆形状的轮廓部分
    g2.draw(head);
  }
}
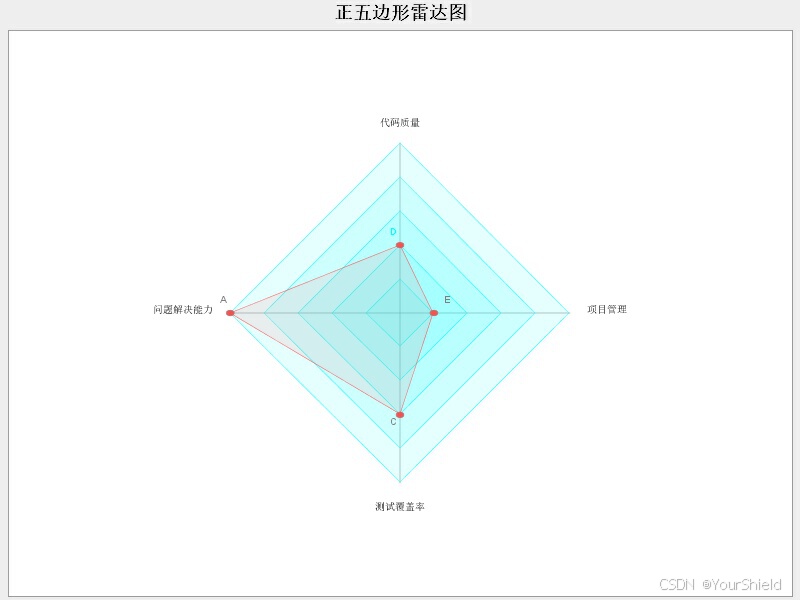
5. 正五边形雷达图示例
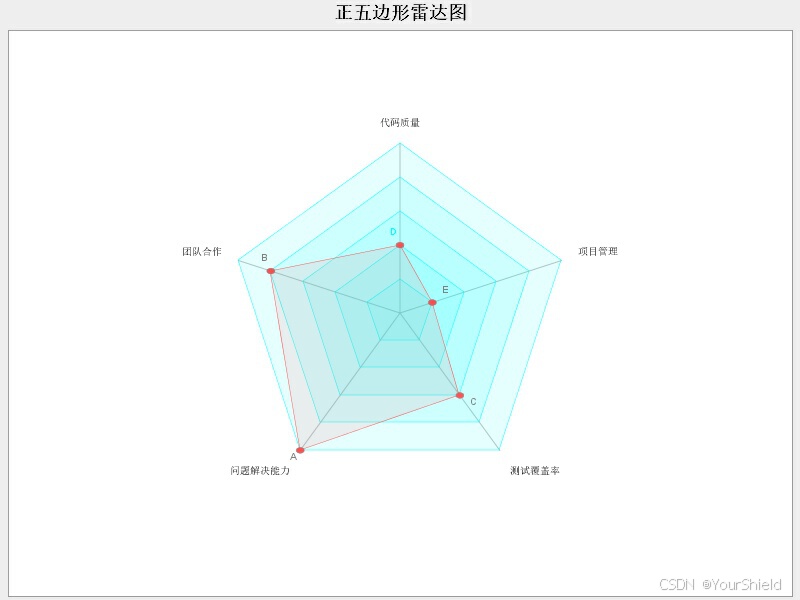
public static void main(String[] args) throws IOException {
    //指标项
    String[] columns = {"代码质量", "项目管理", "测试覆盖率", "问题解决能力", "团队合作"};
    //数据的值
    Integer[] values = {2, 1, 3, 5, 4};
    SpiderWebPlot plot = createRadarPlot(columns);
    plot.setDataset(renderData(plot, values, columns));
    // 创建图表
    JFreeChart radarChart = new JFreeChart("正五边形雷达图", JFreeChart.DEFAULT_TITLE_FONT, plot, false);
    // 将图表嵌入到 Swing 面板中
    ChartUtils.saveChartAsJPEG(new File("雷达图.jpeg"), radarChart, 800, 600);
  }
6. 正四边形示例
public static void main(String[] args) throws IOException {
    //指标项
    String[] columns = {"代码质量", "项目管理", "测试覆盖率", "问题解决能力"};
    //数据的值
    Integer[] values = {2, 1, 3, 5};
    SpiderWebPlot plot = createRadarPlot(columns);
    plot.setDataset(renderData(plot, values, columns));
    // 创建图表
    JFreeChart radarChart = new JFreeChart("正五边形雷达图", JFreeChart.DEFAULT_TITLE_FONT, plot, false);
    // 将图表嵌入到 Swing 面板中
    ChartUtils.saveChartAsJPEG(new File("雷达图.jpeg"), radarChart, 800, 600);
  }
技术有限,部分注释由AI生成,如有误请见谅


 836
836

 被折叠的 条评论
为什么被折叠?
被折叠的 条评论
为什么被折叠?
 到【灌水乐园】发言


