


文章目录
filebeat
一、filebeat
轻量级日志收集组件,基本不消耗内存
主要工作:在每一台机器内收集日志,将日志同步到 > redis > logstash > Elasticsearch
所以每台机器都要装filebeat,选择对应所需组件进入下载,这里选择filebeat > [选择版本下载](https://www.elastic.co/downloads/past-releases#filebeat)

1.下载安装
[root@elk01 ~]# wget https://artifacts.elastic.co/downloads/beats/filebeat/filebeat-7.12.1-x86_64.rpm
[root@elk01 ~]# yum localinstall -y filebeat-7.12.1-x86_64.rpm
2.修改配置模式
1)备份配置文件
[root@elk01 ~]# rpm -qc  filebeat | grep filebeat.yml
/etc/filebeat/filebeat.yml

# 查看除注释外的内容
[root@elk01 filebeat]# egrep -v '#' /etc/filebeat/filebeat.yml | egrep '[^\ ]'
filebeat.inputs:
- type: log
  enabled: false
  paths:
    - /var/log/*.log
- type: filestream
  enabled: false
  paths:
    - /var/log/*.log
filebeat.config.modules:
  path: ${path.config}/modules.d/*.yml
  reload.enabled: false
setup.template.settings:
  index.number_of_shards: 1
setup.kibana:
output.elasticsearch:
  hosts: ["localhost:9200"]
processors:
  - add_host_metadata:
      when.not.contains.tags: forwarded
  - add_cloud_metadata: ~
  - add_docker_metadata: ~
  - add_kubernetes_metadata: ~

 # 备份后再编辑
 [root@elk01 filebeat]# cp /etc/filebeat/filebeat.yml /etc/filebeat/filebeat.yml.bak
2)收集文件日志,输出到文件中
- 不同输入类型格式参考:
https://www.elastic.co/guide/en/beats/filebeat/7.12/configuration-filebeat-options.htmlhttps://www.elastic.co/guide/en/beats/filebeat/current/configuring-output.html- file格式:
- output.file: # filebeat输出
path: “/tmp/filebeat”
filename: filebeat.log
[root@elk01 ~]# vim /etc/filebeat/filebeat.yml <<EOF
filebeat.inputs:   # filebeat输入
- type: log		   # 可随便定义
  paths:
    - /var/log/messages
    - /var/log/*.log
filebeat.config.modules:
  path: ${path.config}/modules.d/*.yml
  reload.enabled: false
setup.template.settings:
  index.number_of_shards: 1
setup.kibana:
output.file:		# filebeat输出
  path: "/tmp/filebeat"
  filename: filebeat.log
processors:
  - add_host_metadata:
      when.not.contains.tags: forwarded
  - add_cloud_metadata: ~
  - add_docker_metadata: ~
  - add_kubernetes_metadata: ~
[root@elk01 filebeat]# /usr/bin/filebeat -c /etc/filebeat/filebeat.yml
重启filebeat
[root@elk01 filebeat]# systemctl restart filebeat.service
[root@elk01 ~]# tailf /tmp/filebeat/filebeat.log
5,\"5\":0.03,\"norm\":{\"1\":0.01,\"15\":0.025,\"5\":0.015}}}}}}","input":{"type":"log"},"ecs":01","type":"filebeat","version":"7.12.1"}}
	···
可以使用json.cn查看log文件:
json官网

3)收集日志输出到redis
- https://www.elastic.co/guide/en/beats/filebeat/current/redis-output.html
- redis格式:
- output.redis:
hosts: [“localhost”]
password: “my_password”
key: “filebeat”
db: 0
timeout: 5
1> 配置
[root@elk01 ~]# vim /etc/filebeat/filebeat.yml
filebeat.inputs:
- type: log
  paths:
    - /var/log/messages
    - /var/log/*.log
filebeat.config.modules:
  path: ${path.config}/modules.d/*.yml
  reload.enabled: false
setup.template.settings:
  index.number_of_shards: 1
setup.kibana:
output.redis:
  hosts: ["192.168.15.13"]
  password: ""	# 对端redis的密码,若没有则为空
  key: "filebeat"
  db: 0		# 第0个数据库,redis默认有16个数据库
  timeout: 5
processors:
  - add_host_metadata:
      when.not.contains.tags: forwarded
  - add_cloud_metadata: ~
  - add_docker_metadata: ~
  - add_kubernetes_metadata: ~

# 添加此段,注意修改
output.redis:
  hosts: ["localhost"]
  password: "my_password"
  key: "filebeat"
  db: 0
  timeout: 5
2> 重启
[root@elk01 filebeat]# systemctl restart filebeat.service
3> 对端查看
# 安装redis,并修改bind监听地址为0.0.0.0
# 启动redis
# 进入查看
[root@elk01 ~]# redis-cli
127.0.0.1:6379> KEYS *   #通过filebeat自定义的key
1) "filebeat"
127.0.0.1:6379> lrange filebeat 0 -1
415) "{\"@timestamp\":\"2021-05-12T09:05:08.661Z\",\"@metadata\":{\\\"1\\\":0.03,\\\"15\\\":0.025,\\\"5\\\":0.025}}}}}}\"}"
	···
4>使用logstash读取redis输出到elasticsearch中
redis 参考文档
https://www.elastic.co/guide/en/logstash/current/plugins-inputs-redis.html

使用logstash读取redis输出到elasticsearch中
# 配置文件放在哪无所谓,运行时指定好路径即可~
[root@elk01 ~]# vim /etc/logstash/conf.d/redis-system.conf
input {
  redis {
    data_type => 'list'
    host => "192.168.15.13"
    key => "filebeat"
    port => 6379
  }
}

output {
    elasticsearch {
    hosts => ["172.16.1.12:9200"]
    index => "filebeat-systemlog-%{+YYYY.MM.dd}"
  }
}

# 运行logstash
[root@elk01 ~]# /usr/share/logstash/bin/logstash -f /etc/logstash/conf.d/redis-system.conf
Using bundled JDK: /usr/share/logstash/jdk
OpenJDK 64-Bit Server VM warning: Option UseConcMarkSweepGC was deprecated in version 9.0 and will likely be removed in a future release.
5> 查看elasticsearch索引以及kibana


3. 通过 nginx 代理 kibana 并 实现登录认证:
- 使用Nginx反向代理,配置域名访问kibana
 wget http://nginx.org/download/nginx-1.16.1.tar.gz
 tar xf nginx-1.16.1.tar.gz
 groupadd www -g 666
 useradd www -u 666 -g 666 -s /sbin/nologin -M
 cd nginx-1.16.1
 ./configure --prefix=/usr/local/nginx-1.16.1 --user=www --group=www --without-http_gzip_module
 make && make install
 ln -s /usr/local/nginx-1.16.1 /usr/local/nginx
 vim /etc/profile.d/nginx.sh
export PATH=$PATH:/usr/local/nginx/sbin
 source /etc/profile

system管理nginx
[root@web03 ~]# vim /etc/systemd/system/nginx.service
[Unit]
Description=nginx - high performance web server
After=network.target remote-fs.target nss-lookup.target
[Service]
Type=forking
ExecStart=/usr/local/nginx/sbin/nginx -c /usr/local/nginx/conf/nginx.conf
ExecReload=/usr/local/nginx/sbin/nginx -s reload
ExecStop=/usr/local/nginx/sbin/nginx -s stop
[Install]
WantedBy=multi-user.target

systemctl start nginx
4.配置kibana域名访问
配置kibana域名访问
 mkdir /usr/local/nginx/conf/conf.d/
[root@elk01 conf]# vim /usr/local/nginx/conf/nginx.conf
#添加一行
include /usr/local/nginx/conf/conf.d/*.conf;

[root@elk01 conf]# vim /usr/local/nginx/conf/conf.d/kibana.conf
upstream kibana_server {
server 127.0.0.1:5601 weight=1 max_fails=3 fail_timeout=60;
}

server {
    listen 80;
    server_name www.kibana.com;
    location / {
        proxy_pass http://kibana_server;
        proxy_http_version 1.1;
        proxy_set_header Upgrade $http_upgrade;
        proxy_set_header Connection 'upgrade';
        proxy_set_header Host $host;
        proxy_cache_bypass $http_upgrade;
     }
}

[root@elk01 conf]# chown www.www /usr/local/nginx/ -R
[root@elk01 conf]# systemctl restart nginx
# 启动Nginx
[root@elk01 ~]# systemctl start --now nginx

# 配置hosts解析
192.168.15.12 linux.kibana.com

# 访问测试
192.168.15.12:80
linux.kibana.com
5.实现登录认证:
yum install httpd-tools –y

[root@elk01 conf]# yum install httpd-tools –y
[root@elk01 conf]# htpasswd -bc
/usr/local/nginx/conf/htpasswd.users kibana kibana

[root@elk01 conf]# cat /usr/local/nginx/conf/htpasswd.users
zhangjie:$apr1$x7K2F2rr$xq8tIKg3JcOUyOzSVuBpz1

修改kibana配置文件===不允许外网访问
[root@elk01 ~]# grep -E '^[^#]' /etc/kibana/kibana.yml
server.port: 5601
server.host: "172.16.1.12"
elasticsearch.hosts: ["http://172.16.1.40:9200"]

编写nginx配置文件
[root@elk01 conf]# vim /usr/local/nginx/conf/conf.d/kibana5612.conf
upstream kibana_server {
server 172.16.1.12:5601 weight=1 max_fails=3 fail_timeout=60;
}
server {
    listen 80;
    server_name www.kibana5612.com;
    auth_basic "Restricted Access";
    auth_basic_user_file /usr/local/nginx/conf/htpasswd.users;
    location / {
        proxy_pass http://kibana_server;
        proxy_http_version 1.1;
        proxy_set_header Upgrade $http_upgrade;
        proxy_set_header Connection 'upgrade';
        proxy_set_header Host $host;
        proxy_cache_bypass $http_upgrade;
  }
}
[root@elk01 conf]# chown www.www /usr/local/nginx/ -R
[root@elk01 conf]# systemctl reload nginx
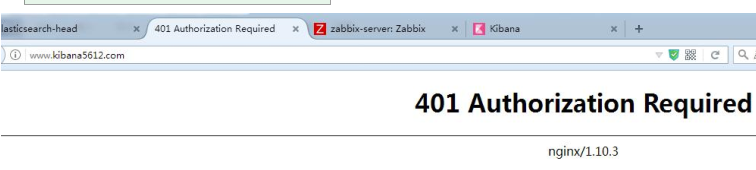
6.验证登录:

如果不输入 密码 无法登录:
除非点击取消之后提示需要认证
二、ELK架构
# 安装filebeat
[root@elk01 ~]# wget https://artifacts.elastic.co/downloads/beats/filebeat/filebeat-7.12.1-x86_64.rpm
[root@elk01 ~]# yum install filebeat-7.12.1-x86_64.rpm
[root@elk01 ~]# vim /etc/filebeat/filebeat.yml
filebeat.inputs:
- type: log
  paths:
    - /var/log/messages
    - /var/log/*.log
output.redis:
  hosts: ["192.168.15.13"]
  password: ""
  key: "filebeat"
  db: 0
  timeout: 5
[root@elk01 ~]# systemctl start filebeat

# 安装redis
[root@elk01 ~]# yum install redis -y
[root@elk01 ~]# systemctl start redis

# 安装logstash
[root@elk01 ~]# wget https://artifacts.elastic.co/downloads/logstash/logstash-7.12.1-x86_64.rpm
[root@elk01 ~]# yum install logstash-7.12.1-x86_64.rpm -y
[root@elk01 ~]# cat redis-system.conf
input {
  redis {

	data_type => 'list'
	host => "192.168.15.13"
	key => "filebeat"
	port => 6379
  }
}

output {

	elasticsearch {

		hosts => ["192.168.13.12:9200"]
		index => "filebeat-systemlog-%{+YYYY.MM.dd}"

	}

}
[root@elk01 ~]# /usr/share/logstash/bin/logstash -f redis-system.conf

# elasticsearch
[root@elk01 ~]# grep -E '^[^#]' /etc/elasticsearch/elasticsearch.yml
cluster.name: chenyang-by-es
node.name: chenyang-node-01
path.data: /var/lib/elasticsearch
path.logs: /var/log/elasticsearch
bootstrap.memory_lock: true
network.host: 0.0.0.0
http.port: 9200
http.cors.enabled: true
http.cors.allow-origin: "*"
cluster.initial_master_nodes: node-01
discovery.zen.minimum_master_nodes: 2
discovery.zen.ping.unicast.hosts: ["172.16.1.12","172.16.1.40"]


# 安装kibana
[root@elk01 ~]# grep -E '^[^#]' /etc/kibana/kibana.yml
server.port: 5601
server.host: "172.16.1.40"
elasticsearch.hosts: ["http://172.16.1.40:9200"]

# 优化
[root@elk01 ~]# yum install nginx -y
[root@elk01 ~]# vim /etc/nginx/conf.d/kibana.conf
server {
	listen 80;
	server_name kibana.default.cluster.local.com;

	auth_basic "User Authentication";
    auth_basic_user_file /etc/nginx/auth;

	location / {
		proxy_pass http://192.168.13.12:5601;
	}

}

不允许IP访问
server {
	listen 80 default_server;
	server_name localhost;
	return 500;
}
三、监控ELK
本次使用普罗米修斯监控ELK
1、安装普罗米修斯
# 部署普罗米修斯
[root@elk01 /opt]# wget https://github.com/prometheus/prometheus/releases/download/v2.26.0/prometheus-2.26.0.linux-amd64.tar.gz
[root@elk01 /opt]# tar -xf prometheus-2.26.0.linux-amd64.tar.gz -C /usr/local/
[root@elk01 /opt]# vim /usr/local/prometheus/prometheus.yml
  - job_name: "ELK"
    static_configs:
      - targets: ["192.168.15.71:9114"]

# 部署elasticsearch export
[root@elk01 /opt]# docker run --rm -p 9114:9114 -e "--es.uri=http://172.16.1.12:9200/" justwatch/elasticsearch_exporter:1.1.0

[root@elk01 /opt]# wget https://dl.grafana.com/oss/release/grafana-7.5.6-1.x86_64.rpm
[root@elk01 /opt]# yum install grafana-7.5.6-1.x86_64.rpm
[root@elk01 /opt]# systemctl start grafana-server.service


 680
680


 被折叠的 条评论
为什么被折叠?
被折叠的 条评论
为什么被折叠?
 到【灌水乐园】发言


