


Background
File Access and Process Monitoring - How to find locked files and the processes locking them
There are multiple ways to go about finding out the exact process locking a file and preventing QlikView/QlikSense from carrying out a specific operation. This article covers 3 options available to the standard Windows Server Operating System , also can try 1st and 3rd in family/professional windows system.
有多种方法可以找到锁定文件的确切过程,并阻止QlikView/QlikSense执行特定的操作。
本文涵盖了标准Windows服务器操作系统的3个选项,也可以在家庭/专业窗口系统中尝试1和3。
Common causes for locks are:
- A QVB (Reload Engine) that did not terminate correctly
- Qlik Sense Engine service holding file in error
- The QVS.exe (QlikView Server Service) holding the file in error
- AntiVirus Software during the scanning process
- Backup Software locking the file during the backup process
- Scheduled maintenance tools (Windows or Third Party)
- Disk bad sector
产生锁的常见原因有:
- 未正确终止的QVB(重新加载引擎)
- Qlik Sense引擎服务保存文件但发送错误
- QVS.exe(QlikView服务器服务)保存出错
- 扫描过程中的防毒软件
- 备份软件:在备份过程中锁定该文件
- 定期维护工具(窗口或第三方)
- 磁盘分区损坏(坏区)
Resolution
1st option: Process Monitor
1. Download Windows Process Monitor and unzip it to your server (Desktop is fine, the location doesn't matter). You can find the download link here: Process Monitor - Sysinternals | Microsoft Learn
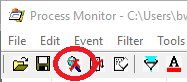
2. Click the magnifying glass icon ("Capture") to stop monitoring temporarily. It should change to a magnifying glass with a red X over it when process monitoring has stopped.
3. Navigate to File > Backing Files...
4. Select the "Use file named:" radio button, and enter in a path where you wish to save the .pml file (an example may be C:\YourCaseNumber\procmon.PML), and press OK.

5. Click the Filter icon ("Filter") to show the Process Monitor Filter dialogue.
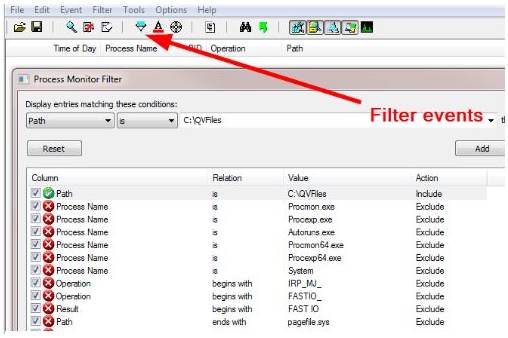
6. Create a filter to include a file at a specific path. In the drop-down, select "Path", then "Is" in the next drop-down, enter in the file path you wish to monitor (for example, maybe a locked file at \\SomeSharedDrive\QlikviewRootFolder\CalData.pgo) , and finally select "Include" in the last drop-down.
7. Click "Add". A new item should appear at the top of the list of filters, and it should be enabled.
8. Click "OK" to close the Process Monitor Filter dialogue.
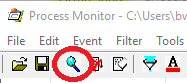
9. Click the magnifying glass icon again to begin capture (there should be NO red X). You should see lots of different events being logged.
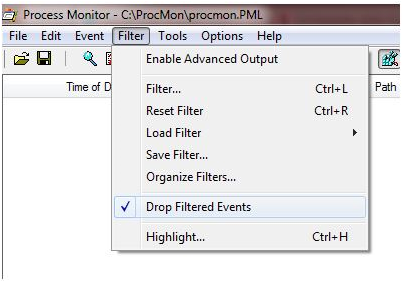
10. Once you are sure that the filter is correct and capturing what requested, drop filtered events to avoidgenerating huge files (Filter --> Drop Filtered Events)
11. Replicate the issue described in the case.
If the issue cannot be replicated on demand, and Procmon needs to run until issue occurs, "Backing files" and "History Depth" may need to be configured to store the capture in multiple files with limited size.
File > Backing files
Options > History Depth
12. Once you have replicated the problem while capturing, then you can click the magnifying glass icon again to stop capturing. (there should be a red X on the icon once capturing is disabled)
Note: Do not close Procmon as means to stop the capture as this may inadvertently remove the .pml files.

13. Copy the .PML file(s) to a different location so that they are not overwritten or removed by Procmon by accident.
Note:
1. When using "Backing File" feature, if Procmon is closed as means to stop it, and then reopened, the files are cleared. You may or may not be prompted with a message indicating that the current .pml file will be overwritten, and it looks like it depends on whether procmon is currently using the very first .pml file generated, or has already created other .pml files. If it has already roled to the next <name>-X.pml files it will remove those files right away with no warning.
2. If Procmon is kept opened after stopping the capture, two files should remain available for copying from the location specified under "Backing Files".
3. If Procmon is stopped and then started, the last active file (of the two) will be used to store (append) new data.
14. Open the .PML file that was created and verify that Qlik events were actually logged in there (close Process Monitor, and then double-click on the .PML file; click "Cancel" if the filter dialogue appears again).
15. If all looks good in the prior step, then you can view the PML file or send it to Support if requested. If not, try capturing again.
Note: Make sure that Process Monitor is closed when you are finished collecting the data; it DOES use more memory, and this could impact the server if left running overnight by accident (THOUGH, if you cannot reproduce the issue on-demand then make sure you can set aside time and resources on the server to run Process Monitor until it captures the issue--but please let us know if you are doing this and will need more time to collect the information we're asking for).
2nd option: Share and Storage Management
Note: This has to be executed on the host of the file share.
- Pre-installed on Windows 2008 R2
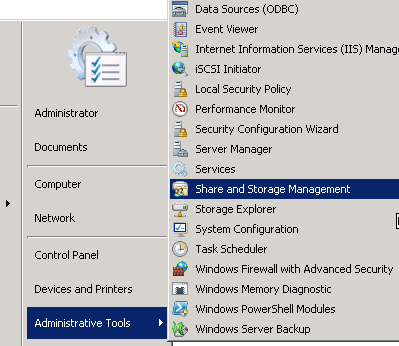
- Open through START - Administrative Tools - Share and Storage Management
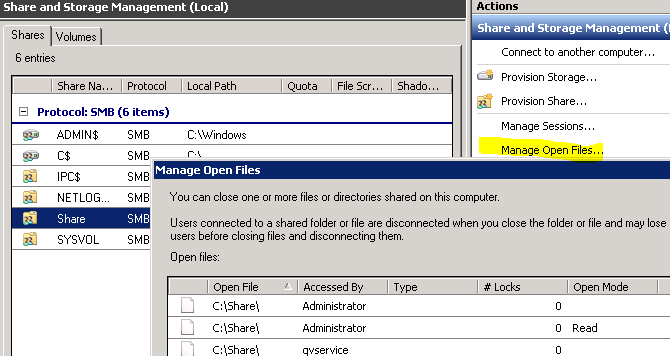
- Select the Share holding the .QVWs or .QVDs affected by a lock
- Begin monitoring by opening the "Manage Open Files.." menu on the right:
3rd option: Windows File Auditing written to Windows Event log
Note: This can be resource-intensive!
First, the "Audit object access" needs to be enabled from the security policy.
- Go to Run > secpol.msc
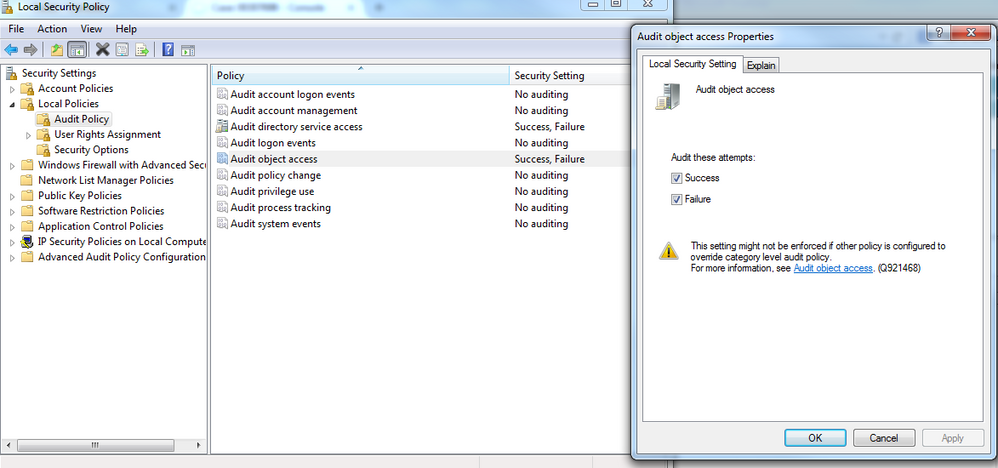
- Security settings > Local Policies > Audit Policy > Audit object access
- Edit the "Audit object access" to audit either "Success", "Failure" or both.
- Hit OK
This setting can be pushed from a Domain Controller too, through editing the Group Policy on the Domain Controller:
- Start > Administrative Tools > Group Policy Management
- Within Group Policy Management > Forest: [forestname] > Domains > [domainname] > Group Policy Objects > Right-click and edit the GPO (by default "Default Domain Policy")
- Within the Group Policy Management Editor > Computer Configuration > Policies > Windows Settings > Security Settings > Local Policies > Audit Policy > Audit object access.
Then we can target the specific files/folders:
- No installation required
- Locate the file or folder you want to audit in Windows Explorer.
- Right-click the file or folder and then click Properties.
- Click the Security tab.
- Click Advanced.
- Click the Auditing tab.
- If you are using Windows Server 2008, click Edit.
- Click Add.
- Enter the name of a user or group you want to audit for the selected file or folder, and click Check
- Names to validate your entry. For example, enter Everyone.
- Click OK.
- Select Success and Failure next to Full control to audit everything for the selected file or folder.
Option 4 :Process Explorer
有没有想过哪个程序打开了特定的文件或目录? 你现在可以搞清楚了。进程资源管理器可显示有关打开或加载了哪些句柄和 DLL 进程的信息。
进程资源管理器界面由两个子窗口组成。 顶部窗口始终显示当前活动进程的列表,包括其所属帐户的名称,而底部窗口中显示的信息取决于进程资源管理器所处的模式:如果它处于句柄模式,你将看到顶部窗口中选择的进程已打开的句柄;如果进程资源管理器处于 DLL 模式,则会看到进程已加载的 DLL 和内存映射文件。 进程资源管理器还具有强大的搜索功能,可快速显示哪些进程打开了特定的句柄或加载了 DLL。
进程资源管理器的独特功能可用于跟踪 DLL 版本问题或句柄泄漏,并提供 Windows 和应用程序工作方式的见解。
Note: This is only meant to get more information out of Processes, it does not log file locks
- Download required: Sysinternals
- Extract and execute procexp.exe
- Explore running processes in detail...


 被折叠的 条评论
为什么被折叠?
被折叠的 条评论
为什么被折叠?
 到【灌水乐园】发言


