


文档:
官网Demo

使用
1、下载源码,将ec-canvas文件夹拷贝到小程序目录,第三方代码,我都放在libs文件夹
https://github.com/ecomfe/echarts-for-weixin
libs/
	ec-canvas
2、引入组件 page.json
{
  "usingComponents": {
    "ec-canvas": "../../libs/ec-canvas/ec-canvas"
  }
}
3、使用组件 page.wxml
<view class="container">
  <ec-canvas id="mychart-dom-map-china" canvas-id="mychart-map-china" ec="{{ ec }}"></ec-canvas>
</view>
不要忘记设置样式 page.wxss
.container {
  width: 100%;
  height: 800rpx;
}

ec-canvas {
  width: 100%;
  height: 100%;
}
4、逻辑代码 page.js
推荐使用延迟加载图表的方式,这样可以动态传参,和事件传递
参见项目pages/lazyLoad代码示例
// pages/map-demo/map-demo.js
import * as echarts from '../../libs/ec-canvas/echarts';
import geoJson from '../../libs/ec-canvas/map-data-china.js';

// 设置数据,可以增加更多的数据参数
function setOption(chart) {
  const option = {
    series: [
      {
        type: 'map',
        mapType: 'china',

        label: {
          normal: {
            show: true,
          },
          emphasis: {
            textStyle: {
              color: '#fff',
            },
          },
        },

        itemStyle: {
          normal: {
            borderColor: '#389BB7',
            areaColor: '#fff',
          },
          emphasis: {
            areaColor: '#389BB7',
            borderWidth: 0,
          },
        },
        animation: false,

        data: [
          { name: '郑州市', value: 100 },
          { name: '洛阳市', value: 10 },
          { name: '开封市', value: 20 },
          { name: '信阳市', value: 30 },
          { name: '驻马店市', value: 40 },
          { name: '南阳市', value: 41 },
          { name: '周口市', value: 15 },
          { name: '许昌市', value: 25 },
          { name: '平顶山市', value: 35 },
          { name: '新乡市', value: 35 },
          { name: '漯河市', value: 35 },
          { name: '商丘市', value: 35 },
          { name: '三门峡市', value: 35 },
          { name: '济源市', value: 35 },
          { name: '焦作市', value: 35 },
          { name: '安阳市', value: 35 },
          { name: '鹤壁市', value: 35 },
          { name: '濮阳市', value: 35 },
          { name: '开封市', value: 45 },
        ],
      },
    ],
  };

  chart.setOption(option);
}

Page({
  /**
   * 页面的初始数据
   */
  data: {
    ec: {
      // 将 lazyLoad 设为 true 后,需要手动初始化图表
      lazyLoad: true,
    },
  },

  /**
   * 生命周期函数--监听页面初次渲染完成
   */
  onReady: function () {
    // 获取组件
    this.ecComponent = this.selectComponent('#mychart-dom-map-china');
    this.initChart();
  },

  // 初始化图表
  initChart() {
    this.ecComponent.init((canvas, width, height, dpr) => {
      // 获取组件的 canvas、width、height 后的回调函数
      // 在这里初始化图表
      const chart = echarts.init(canvas, null, {
        width: width,
        height: height,
        devicePixelRatio: dpr, // new
      });

      // 注册中国地图数据包
      echarts.registerMap('china', geoJson);

      // 设置数据
      setOption(chart);

      // 将图表实例绑定到 this 上,可以在其他成员函数(如 dispose)中访问
      this.chart = chart;

      // 绑定点击事件
      let that = this;
      chart.on('click', function (params) {
        that.handleChartClick(params);
      });

      // 注意这里一定要返回 chart 实例,否则会影响事件处理等
      return chart;
    });
  },

  // 销毁图表
  disposeChart() {
    if (this.chart) {
      this.chart.dispose();
    }
  },

  handleChartClick(params) {
    // 可以通过参数去数据列表中获取完整数据 params.dataIndex
    console.log(params);
  },
});
关于地图数据 map-data-china.js 和pc所使用的china.js稍有不同,根据示例代码,我改造了一份数据
wget https://raw.githubusercontent.com/mouday/echarts-map/master/echarts-for-weixin/js/wx-china.js

# 镜像
wget https://cdn.jsdelivr.net/gh/mouday/echarts-map/master/echarts-for-weixin/js/wx-china.js
更多数据可参看
echarts:从github及其镜像下载china.js和china.json
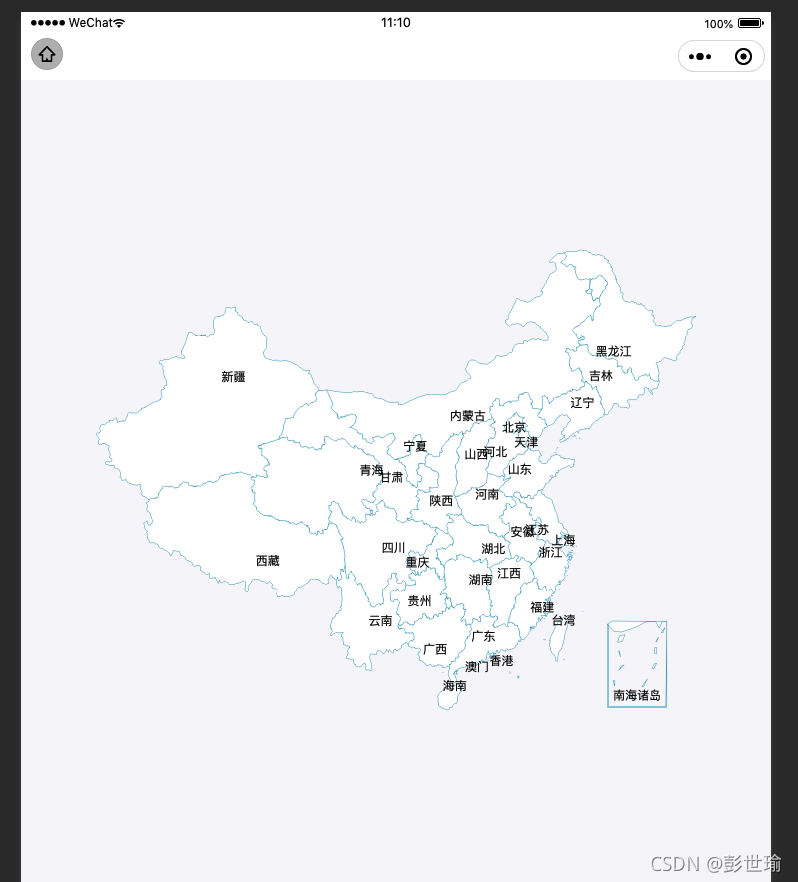
实现效果
问题
1、重新渲染echarts组件
可以使用 wx:if ,移除元素后再显示,即可执行组件完整生命周期
参考


 被折叠的 条评论
为什么被折叠?
被折叠的 条评论
为什么被折叠?
 到【灌水乐园】发言


