


1 创建一个表
\begin{table}[H]
\centering\begin{tabular}{lcccccccc}%字体居中c,靠左l,靠右r
\hline
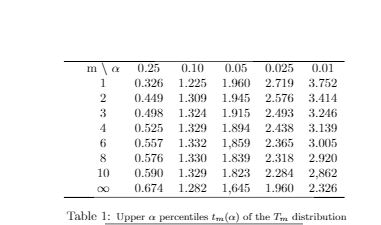
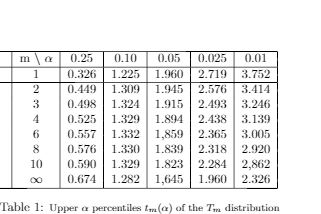
&m $\setminus$ $\alpha$ &0.25 &0.10 &0.05 &0.025 &0.01\\
&1 &0.326 &1.225 &1.960 &2.719 &3.752 \\
&2 &0.449 &1.309 &1.945 &2.576 &3.414 \\
&3 &0.498 &1.324 &1.915 &2.493 &3.246 \\
&4 &0.525 &1.329 &1.894 &2.438 &3.139\\
&6 &0.557 &1.332 &1,859 &2.365 &3.005\\
&8 &0.576 &1.330 &1.839 &2.318 &2.920 \\
&10 &0.590 &1.329 &1.823 &2.284 &2,862 \\
&$\infty$ &0.674 &1.282 &1,645 &1.960 &2.326 \\
\hline
\end{tabular}
\caption{\footnotesize{Upper $\alpha$ percentiles $t_m(\alpha)$ of the $T_m$ distribution}}
\label{tab:tab1}
\end{table}
2.如果想要添加竖线那么需要修改\begin{tabular}{l|c|c|c|c|c|c|c|c|}


 7741
7741

 被折叠的 条评论
为什么被折叠?
被折叠的 条评论
为什么被折叠?
 到【灌水乐园】发言


