


clear
clc
close all
fs=200; %采样频率
N = 200;
t=0:1/fs:(N-1)/fs;
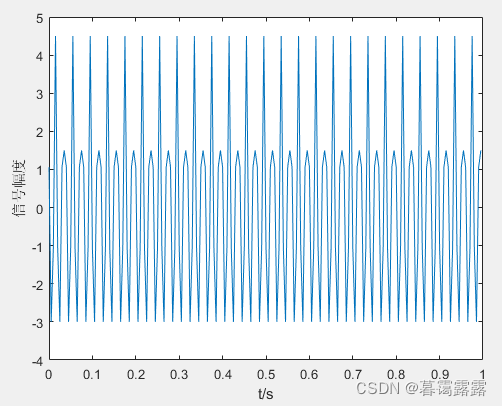
y= 3*cos(2*pi*50*t+pi/2)+1.5*cos(2*pi*75*t-pi/4);
figure;plot(t,y);xlabel('t/s');ylabel('信号幅度')
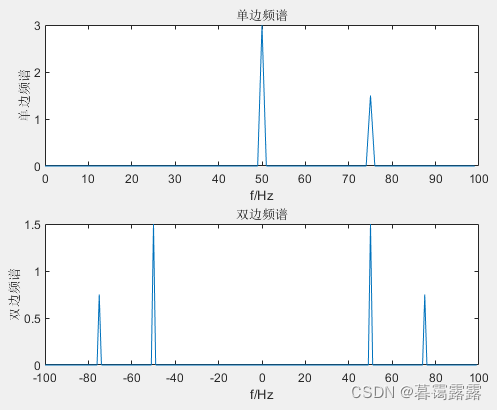
%% fft单边谱
df=fs/N; %分辨率
f=(0:N-1)*df; %其中每点的频率
Y=fft(y)/N*2; %真实的幅值
figure(2)
subplot(211)
plot(f(1:N/2),abs(Y(1:N/2)));xlabel('f/Hz');ylabel('单边频谱')
title('单边频谱')
%% fft双边谱
Y=fftshift(fft(y))/N;
f = f-fs/2;
subplot(212)
plot(f,abs(Y));xlabel('f/Hz');ylabel('双边频谱')
title('双边频谱')
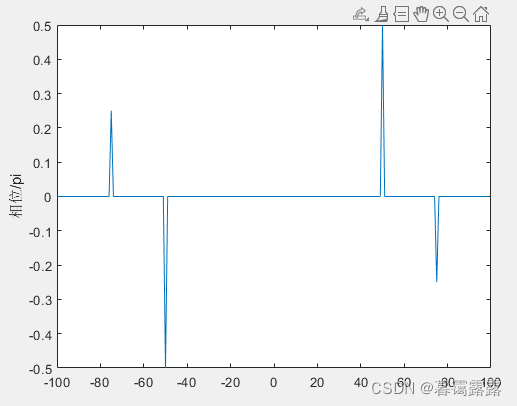
%% 计算信号相位
tol = 1e-6;
Y(abs(Y) < tol) = 0;
theta = angle(Y)/pi;
figure;
plot(f,theta)
ylabel('相位/pi')仿真结果:


 2442
2442

 被折叠的 条评论
为什么被折叠?
被折叠的 条评论
为什么被折叠?
 到【灌水乐园】发言


