


剧情提要:
[机器小伟]在[工程师阿伟]的陪同下继续炼化着筑基丹,
这次要炼化的目标是[整理与复习--统计与概率]。

本节到此结束,欲知后事如何,请看下回分解。
[机器小伟]在[工程师阿伟]的陪同下继续炼化着筑基丹,
这次要炼化的目标是[整理与复习--统计与概率]。
正剧开始:
星历2016年02月23日 15:38:31, 银河系厄尔斯星球中华帝国江南行省。
[工程师阿伟]正在和[机器小伟]一起复习[整理与复习--统计与概率]。
<span style="font-size:18px;">function myDraw() {
var config = new PlotConfiguration();
config.init();
config.setPreference();
config.setSector(1,1,1,1);
//config.axis2D(0, 0, 180);
var stat = new Statistic();
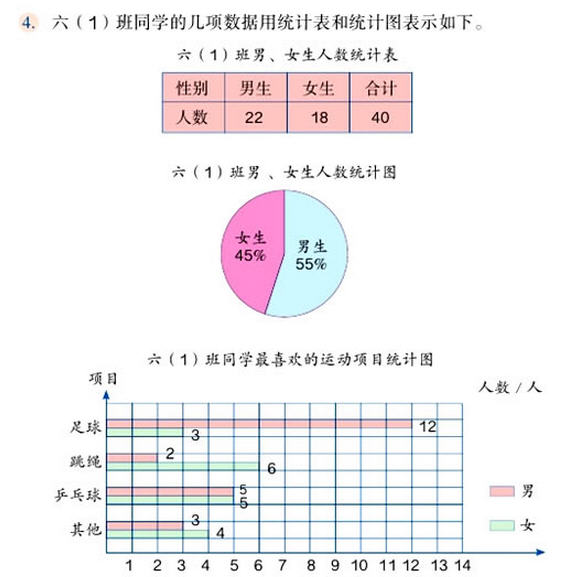
var data = [22,18];
var text = ['男生', '女生'];
stat.pieChart(data, text);
}</span>
<span style="font-size:18px;">function myDraw() {
var config = new PlotConfiguration();
config.init();
config.setPreference();
//config.setSector(1,1,1,1);
//config.axis2D(0, 0, 180);
var stat = new Statistic();
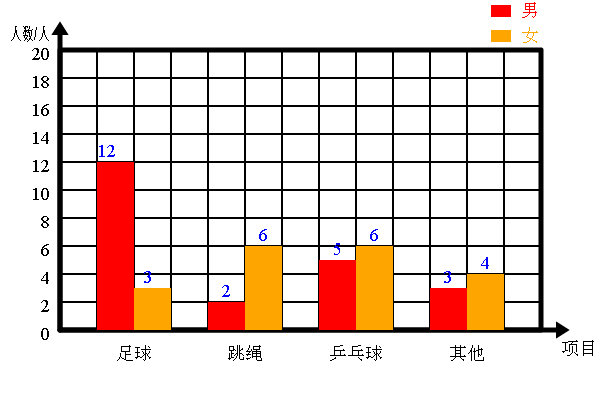
var data = [[12,3],[2,6],[5,6],[3,4]];
var text = ['足球', '跳绳', '乒乓球', '其他'];
stat.init(data, '项目', '人数/人', 2);
stat.multiHistogram(text, ['男', '女'], 0, 0);
}</span>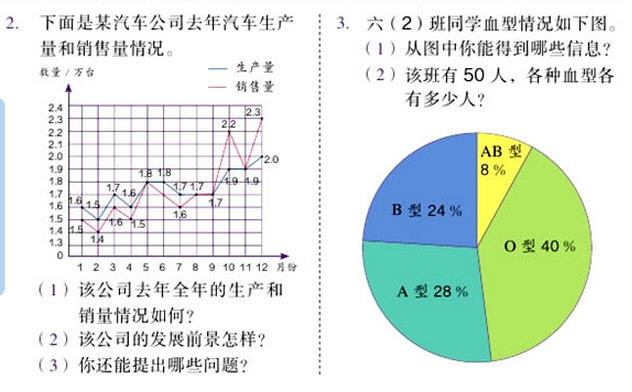
<span style="font-size:18px;">function myDraw() {
var config = new PlotConfiguration();
config.init();
config.setPreference();
//config.setSector(1,1,1,1);
//config.axis2D(0, 0, 180);
var stat = new Statistic();
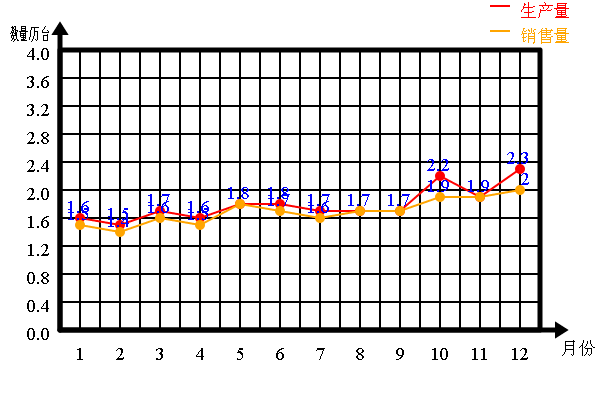
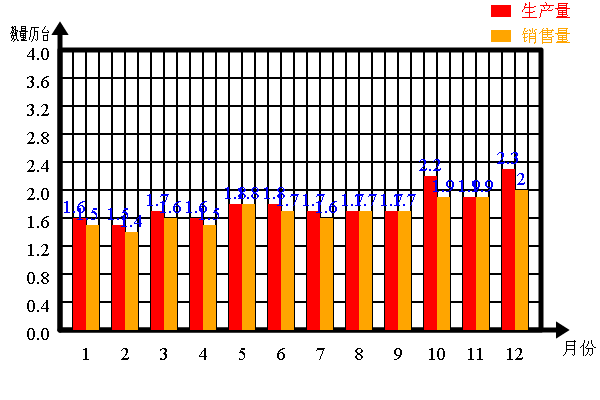
var data = [[1.6,1.5],[1.5,1.4],[1.7,1.6],[1.6,1.5],
[1.8,1.8],[1.8,1.7],[1.7,1.6],[1.7,1.7],
[1.7,1.7],[2.2,1.9],[1.9,1.9],[2.3,2.0]];
var text = ['1', '2', '3', '4', '5','6', '7','8','9','10','11','12'];
stat.init(data, '月份', '数量/万台', 2);
stat.multiLineGraph(text, ['生产量', '销售量'], 0, 0);
}</span>
<span style="font-size:18px;">function myDraw() {
var config = new PlotConfiguration();
config.init();
config.setPreference();
config.setSector(1,1,1,1);
//config.axis2D(0, 0, 180);
var stat = new Statistic();
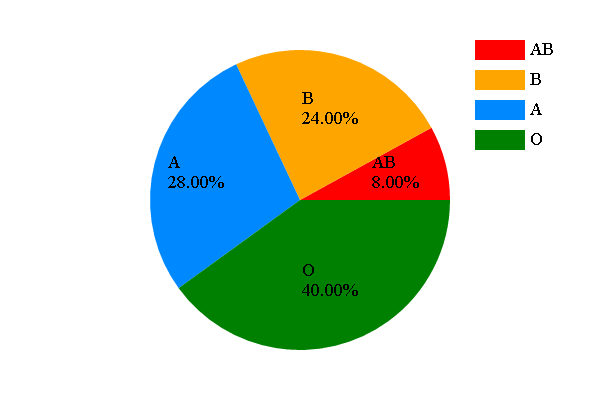
var data = [8,24,28,40];
var text = ['AB', 'B', 'A', 'O'];
stat.pieChart(data, text);
}</span>

<span style="font-size:18px;">function myDraw() {
var config = new PlotConfiguration();
config.init();
config.setPreference();
//config.setSector(1,1,1,1);
//config.axis2D(0, 0, 180);
var stat = new Statistic();
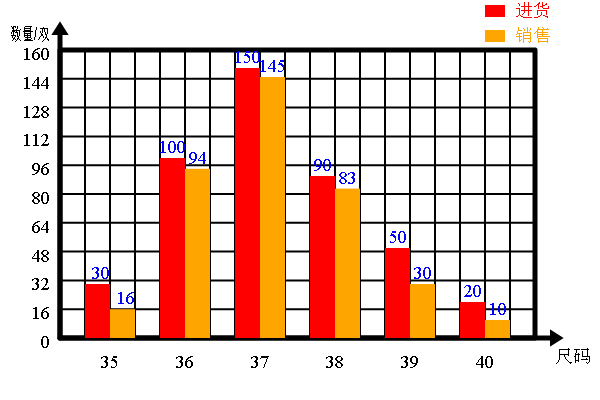
var data = [[30,16],[100,94],[150,145],[90,83],[50,30],[20,10]];
var text = ['35', '36', '37', '38', '39','40'];
stat.init(data, '尺码', '数量/双', 2);
stat.multiHistogram(text, ['进货', '销售'], 0, 0);
}
</span>
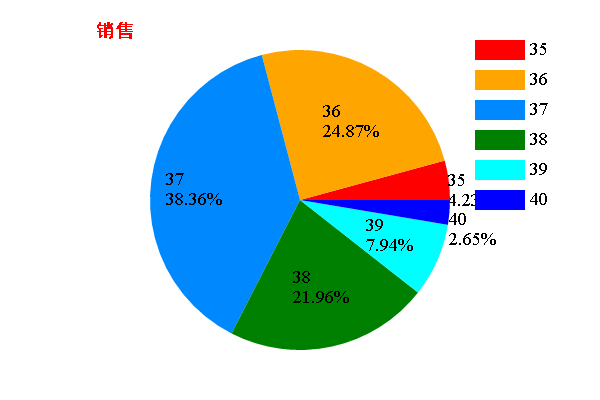
<span style="font-size:18px;">function myDraw() {
var config = new PlotConfiguration();
config.init();
config.setPreference();
config.setSector(1,1,1,1);
//config.axis2D(0, 0, 180);
var stat = new Statistic();
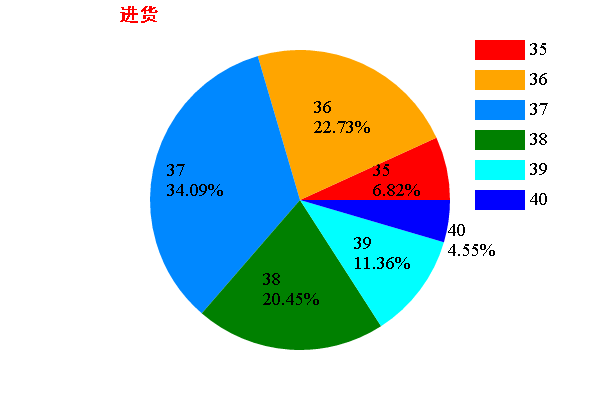
var data = [[30,16],[100,94],[150,145],[90,83],[50,30],[20,10]];
var text = ['35', '36', '37', '38', '39','40'];
//stat.init(data, '尺码', '数量/双', 2);
//stat.multiHistogram(text, ['进货', '销售'], 0, 0);
var data2 = [];
for (var i = 0; i < data.length; i++) {
data2.push(data[i][0]);
}
stat.pieChart(data2, text);
}</span>
<span style="font-size:18px;">function myDraw() {
var config = new PlotConfiguration();
config.init();
config.setPreference();
//config.setSector(1,1,1,1);
//config.axis2D(0, 0, 180);
var stat = new Statistic();
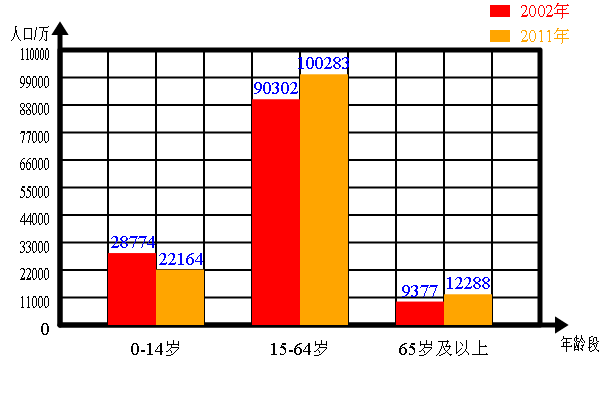
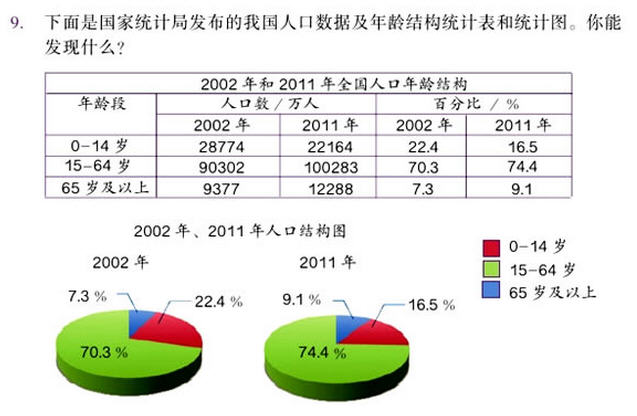
var data = [[28774,22164],[90302,100283],[9377,12288]];
var text = ['0-14岁', '15-64岁', '65岁及以上'];
stat.init(data, '年龄段', '人口/万', 2);
stat.multiHistogram(text, ['2002年', '2011年'], 0, 0);
}</span>
/**
* @usage   统计类
* @author  mw
* @date    2016年01月05日  星期二  10:14:34
* @param
* @return
*
*/
function Statistic() {
	this.statisticalSample = new Array();
	this.sampleSize = 0;
	this.multi = 1;
	this.xLabel = '';
	this.yLabel = '';

	//初始化
	this.init = function(array, textX, textY, multi) {
		//multi为复式统计中每个数据的项数
		this.statisticalSample = array;
		this.sampleSize = this.statisticalSample.length;
		this.multi = multi ? Math.round(multi) : 1;
		this.xLabel = textX;
		this.yLabel = textY;
	}

	this.axis2D = function(x, y, rx, ry, textX, textY) {
		//原点是(x, y), rx, ry分别是x轴的长度,y轴的长度
		//textX, textY分别为x轴和y轴的标注
		plot.save();

		plot.setFillStyle('black')
			.setStrokeStyle('black');

		plot.beginPath()
			.moveTo(x,y)
			.lineTo(x+rx,y)
			.closePath()
			.stroke();

		plot.beginPath()
			.moveTo(x,y-ry)
			.lineTo(x,y)
			.closePath()
			.stroke();


		var r0 = 10;

		//x轴箭头
		plot.beginPath()
			.moveTo(x+rx- r0*Math.cos(Math.PI/3), y-r0*Math.sin(Math.PI/3))
			.lineTo(x+rx+r0*Math.sin(Math.PI/3), y)
			.lineTo(x+rx -r0*Math.cos(Math.PI/3), y+r0*Math.sin(Math.PI/3))
			.closePath()
			.fill()

		plot.setTextAlign('left')
			.fillText(textX, x+rx, y+25, 40);
		plot.setTextAlign('right')
			.fillText(textY, x-10, y-ry+10, 40);

		//y轴箭头
		plot.beginPath()
			.moveTo(x+ r0*Math.sin(Math.PI/3), y-ry+r0*Math.cos(Math.PI/3))
			.lineTo(x, y-ry-r0*Math.sin(Math.PI/3))
			.lineTo(x-r0*Math.sin(Math.PI/3), y-ry+r0*Math.cos(Math.PI/3))
			.closePath()
			.fill()

		plot.restore();
	}

	//最大值
	this.max = function() {
		var max = Number.NEGATIVE_INFINITY;
		if (this.multi == 1) {
			for (var i = 0; i < this.sampleSize; i++) {

				if (max < this.statisticalSample[i]) {
					max = this.statisticalSample[i];
				}
			}
		}
		else {
			for (var i = 0; i < this.sampleSize; i++) {
				for (var j = 0; j < this.multi; j++) {

					if (max < this.statisticalSample[i][j]) {
						max = this.statisticalSample[i][j];
					}
				}
			}

		}
		return max;
	}

	//最小值
	this.min = function() {
		var min = Number.POSITIVE_INFINITY;
		if (this.multi == 1) {
			for (var i = 0; i < this.sampleSize; i++) {

				if (min > this.statisticalSample[i]) {
					min = this.statisticalSample[i];
				}
			}
		}
		else {
			for (var i = 0; i < this.sampleSize; i++) {
				for (var j = 0; j < this.multi; j++) {

					if (min > this.statisticalSample[i][j]) {
						min = this.statisticalSample[i][j];
					}
				}
			}
		}
		return min;
	}

	//总计
	this.total = function() {
		if (this.multi == 1) {
			var value  = 0;
			for (var i = 0; i < this.sampleSize; i++) {
				value += this.statisticalSample[i];
			}
			return value;
		}
		else {
			var value = [];
			var tmp = 0;
			for (var j = 0; j < this.multi; j++) {
				tmp = 0;
				for (var i = 0; i < this.sampleSize; i++) {
					tmp += this.statisticalSample[i][j];
				}
				value.push(tmp);

			}
			return value;

		}
	}


	//平均数
	this.mean = function() {

		var value = this.total();
		if (this.sampleSize != 0) {
			for (var i = 0; i < value.length; i++) {
				value[i] /= this.sampleSize;
			}
		}

		return value;
	}


	//样本数量
	this.size = function() {
		return this.sampleSize;
	}

	//直方图
	this.histogram = function(lableArray, xOffset, yOffset) {
		lableArray = lableArray ? lableArray : [];
		var lables = lableArray.length;
		xOffset = xOffset ? xOffset : 0;
		yOffset = yOffset ? yOffset : 0;

		var colorArray = ['red', 'orange', '#0088FF', 'green', 'cyan', 'blue', '#FF00FF',
			'#888888', 'black'];
		var colors = colorArray.length;

		var height = 380, width = 580;

		plot.save()
			.translate(xOffset+60, yOffset+50);

		plot.setLineWidth(2)
			.setTextAlign('right');

		var max = Math.ceil(this.max());
		var min = Math.floor(this.min());

		var mod = 1;
		while (max > mod * 10) {
			mod *= 10;
		}

		if (mod > 10)
			mod /= 10;
		//最大值的末位为0的近似数,比如最大值25,最合适的近似数为30
		var adjmax = Math.ceil(max/mod)*mod;
		if (adjmax == max) {
			adjmax+=mod;
		}

		adjmax /= mod;

		var size = this.size();
		var perH = Math.round((height-100) / adjmax);
		var perW = Math.round((width-100) / (size*2+1));

		//宽和高度边界
		var wBound = (2*size+1)*perW, hBound = adjmax*perH;
		plot.setLineWidth(5)
			.strokeRect(0, 0, wBound, hBound);

		this.axis2D(0, hBound, wBound+20, hBound+20, this.xLabel, this.yLabel);

		plot.setLineWidth(2);
		var count = 0;
		for (var i = hBound; i >-1; i -= hBound / 10) {
			plot.fillText((adjmax*mod/10*count).toFixed(0), -10, i+10, 30);
			count++;

			if (i > 0) {
				plot.beginPath()
					.moveTo(0, i)
					.lineTo(wBound, i)
					.closePath()
					.stroke();
			}
		}

		for (var i = 0; i < 2*size+1; i++) {
			plot.beginPath()
				.moveTo(i*perW, 0)
				.lineTo(i*perW, hBound)
				.closePath()
				.stroke();
		}


		var xpos, xpos2;

		for (var i = 0; i < size; i++) {
			xpos = perW*(1+2*i);
			xpos2 = xpos + 0.5*perW;
			plot.setFillStyle(colorArray[i%colors]);
			plot.fillRect(perW*(1+2*i), hBound, perW, -this.statisticalSample[i]/mod*perH);

			plot.setTextAlign('center');
			if (i < lables) {
				plot.fillText(lableArray[i], xpos2,
					hBound+30, 100);

			}
			//plot.fillText(this.statisticalSample[i].toFixed(0), xpos2, hBound+40, 100);
		}


		plot.restore();

	}

	//垂直方向直方图
	this.verticalhistogram = function(lableArray, xOffset, yOffset) {
		lableArray = lableArray ? lableArray : [];
		var lables = lableArray.length;
		xOffset = xOffset ? xOffset : 0;
		yOffset = yOffset ? yOffset : 0;

		var colorArray = ['red', 'orange', '#0088FF', 'green', 'cyan', 'blue', '#FF00FF',
			'#888888', 'black'];
		var colors = colorArray.length;

		var height = 380, width = 580;

		plot.save()
			.translate(xOffset+60, yOffset+50);

		var max = Math.ceil(this.max());
		var min = Math.floor(this.min());

		var mod = 1;
		while (max > mod * 10) {
			mod *= 10;
		}


		//最大值的末位为0的近似数,比如最大值25,最合适的近似数为30
		if (mod > 10)
			mod /= 10;
		var adjmax = Math.ceil(max/mod)*mod;
		if (adjmax == max) {
			adjmax+=mod;
		}

		adjmax /= mod;


		var size = this.size();
		var perH = Math.round((height-100) / (size*2+1));
		var perW = Math.round((width-100) / adjmax);

		//宽和高度边界
		var hBound = (2*size+1)*perH, wBound = adjmax*perW;
		plot.setLineWidth(5)
			.strokeRect(0, 0, wBound, hBound);

		this.axis2D(0, hBound, wBound+20, hBound+20, this.xLabel, this.yLabel);

		plot.setLineWidth(2)
			.setTextAlign('center');
		var count = 0;
		for (var i = 0; i < wBound+1; i += wBound / 10) {
			plot.fillText((adjmax*mod/10*count).toFixed(0), i, hBound+25, 30);
			count++;

			if (i > 0) {
				plot.beginPath()
					.moveTo(i, 0)
					.lineTo(i, hBound)
					.closePath()
					.stroke();
			}
		}

		for (var i = 0; i < 2*size+1; i++) {
			plot.beginPath()
				.moveTo(0, i*perH)
				.lineTo(wBound, i*perH)
				.closePath()
				.stroke();
		}


		var ypos, ypos2;

		for (var i = 0; i < size; i++) {
			ypos = perH*(1+2*i);
			ypos2 = ypos + 0.5*perH+5;
			plot.setFillStyle(colorArray[i%colors]);
			plot.fillRect(0, ypos, this.statisticalSample[i]/mod*perW, perH);

			plot.setTextAlign('right');
			if (i < lables) {
				plot.fillText(lableArray[i], -10, ypos2, 100);

			}

		}


		plot.restore();

	}

	//复式直方图
	this.multiHistogram = function(lableArray, lableArray2, xOffset, yOffset) {
		//lableArray是统计数据中横轴的描述
		//lableArray2是所统计的项目的描述
		lableArray = lableArray ? lableArray : [];
		var lables = lableArray.length;
		xOffset = xOffset ? xOffset : 0;
		yOffset = yOffset ? yOffset : 0;

		var colorArray = ['red', 'orange', '#0088FF', 'green', 'cyan', 'blue', '#FF00FF',
			'#888888', 'black'];
		var colors = colorArray.length;

		var height = 380, width = 580;

		plot.save()
			.translate(xOffset+60, yOffset+50);

		plot.setLineWidth(2)
			.setTextAlign('right');

		var max = Math.ceil(this.max());
		var min = Math.floor(this.min());

		var mod = 1;
		while (max > mod * 10) {
			mod *= 10;
		}

		if (mod > 10)
			mod /= 10;
		//最大值的末位为0的近似数,比如最大值25,最合适的近似数为30
		var adjmax = Math.ceil(max/mod)*mod;
		if (adjmax == max) {
			adjmax+=mod;
		}

		adjmax /= mod;

		var size = this.size();
		var perH = Math.round((height-100) / adjmax);
		var part = size*(this.multi+1)+1;
		var perW = Math.round((width-100) / part);

		//宽和高度边界
		var wBound = part*perW, hBound = adjmax*perH;
		plot.setLineWidth(5)
			.strokeRect(0, 0, wBound, hBound);

		this.axis2D(0, hBound, wBound+20, hBound+20, this.xLabel, this.yLabel);

		plot.setLineWidth(2);
		var count = 0;
		var s = '';

		for (var i = hBound; i >-1; i -= hBound / 10) {
			if (max < 100) {
				s = (adjmax*mod/10*count).toFixed(1);
			}
			else {
				s = (adjmax*mod/10*count).toFixed(0);
			}
			plot.fillText(s, -10, i+10, 30);
			count++;

			if (i > 0) {
				plot.beginPath()
					.moveTo(0, i)
					.lineTo(wBound, i)
					.closePath()
					.stroke();
			}
		}

		for (var i = 0; i < part; i++) {
			plot.beginPath()
				.moveTo(i*perW, 0)
				.lineTo(i*perW, hBound)
				.closePath()
				.stroke();
		}


		var xpos, xpos2;
		var h;

		for (var i = 0; i < size; i++) {
			for (var j = 0; j < this.multi; j++) {
				xpos = perW*((this.multi+1)*i+j+1);

				plot.setFillStyle(colorArray[j%colors]);
				h = -this.statisticalSample[i][j]/mod*perH;
				plot.fillRect(xpos, hBound, perW, h);

				plot.setFillStyle('blue');
				if (i > 0) {
					xpos += 0.5*perW
				}
				else {
					xpos += perW;
				}
				plot.fillText(this.statisticalSample[i][j].toString(), xpos, h+hBound-5, 100);

			}

			xpos2 = perW*((this.multi+1)*i+1) + 0.5*this.multi*perW;
			plot.setFillStyle('black');
			plot.setTextAlign('center');
			if (i < lables) {
				plot.fillText(lableArray[i], xpos2,
					hBound+30, 100);

			}
			//plot.fillText(this.statisticalSample[i].toFixed(0), xpos2, hBound+40, 100);
		}

		plot.setTextAlign('left');
		for (var j = 0; j < this.multi; j++) {
			plot.setFillStyle(colorArray[j%colors]);
			plot.fillRect(wBound - 50, -20-25*(this.multi-j-1), 20, 12);
			plot.fillText(lableArray2[j], wBound-20, -20-25*(this.multi-j-1)+12, 50);


		}

		plot.restore();

	}

	//复式折线统计图
	this.multiLineGraph = function(lableArray, lableArray2, xOffset, yOffset) {
		//lableArray是统计数据中横轴的描述
		//lableArray2是所统计的项目的描述
		lableArray = lableArray ? lableArray : [];
		var lables = lableArray.length;
		xOffset = xOffset ? xOffset : 0;
		yOffset = yOffset ? yOffset : 0;

		var colorArray = ['red', 'orange', '#0088FF', 'green', 'cyan', 'blue', '#FF00FF',
			'#888888', 'black'];
		var colors = colorArray.length;

		var height = 380, width = 580;

		plot.save()
			.translate(xOffset+60, yOffset+50);

		plot.setLineWidth(2)
			.setTextAlign('right');

		var max = Math.ceil(this.max());
		var min = Math.floor(this.min());

		var mod = 1;

		while (max > mod * 10) {
			mod *= 10;
		}

		if (mod > 10)
			mod /= 10;

		//最大值的末位为0的近似数,比如最大值25,最合适的近似数为30
		var adjmax = Math.ceil(max/mod)*mod;
		if (adjmax == max) {
			adjmax+=mod;
		}

		adjmax /= mod;

		var size = this.size();
		var perH = Math.round((height-100) / adjmax);
		var part = 2 * size;
		var perW = Math.round((width-100) / part);

		//宽和高度边界
		var wBound = part*perW, hBound = adjmax*perH;
		plot.setLineWidth(5)
			.strokeRect(0, 0, wBound, hBound);

		this.axis2D(0, hBound, wBound+20, hBound+20, this.xLabel, this.yLabel);

		plot.setLineWidth(2);
		var count = 0;

		//图表方格
		for (var i = hBound; i >-1; i -= hBound / 10) {
			plot.fillText((adjmax*mod/10*count).toFixed(0), -10, i+10, 30);
			count++;

			if (i > 0) {
				plot.beginPath()
					.moveTo(0, i)
					.lineTo(wBound, i)
					.closePath()
					.stroke();
			}
		}

		for (var i = 0; i < part; i++) {
			plot.beginPath()
				.moveTo(i*perW, 0)
				.lineTo(i*perW, hBound)
				.closePath()
				.stroke();
		}


		var xpos, xpos2, ypos;

		//折线和图例
		for (var j = 0; j < this.multi; j++) {

			plot.setStrokeStyle(colorArray[j%colors]);

			for (var i = 0; i < size; i++) {

				xpos = perW*(2 * i+1);
				ypos = hBound-this.statisticalSample[i][j]/mod*perH;


				//plot.fillRect(xpos, hBound, perW, -this.statisticalSample[i][j]/mod*perH);
				//

					if (i==0) {
						plot.beginPath()
							.moveTo(xpos, ypos);
					}
					else if (i < size-1) {
						plot.lineTo(xpos, ypos);
					}
					else {
						plot.lineTo(xpos, ypos)
							.moveTo(xpos, ypos)
							.closePath()
							.stroke();
					}


			}


			//plot.fillText(this.statisticalSample[i].toFixed(0), xpos2, hBound+40, 100);
		}

		//数据点
		for (var j = 0; j < this.multi; j++) {
			for (var i = 0; i < size; i++) {
				plot.setFillStyle(colorArray[j%colors]);
				xpos = perW*(2 * i+1);
				ypos = hBound-this.statisticalSample[i][j]/mod*perH;
				shape.fillCircle(xpos, ypos, 5);

				plot.setFillStyle('blue');
				plot.fillText(this.statisticalSample[i][j].toString(), xpos+0.55*perW, ypos-5, 100);
			}
		}

		//x轴标签
		for (var i = 0; i < size; i++) {
			xpos2 = perW*(2 * i+1);
			plot.setFillStyle('black');
			plot.setTextAlign('center');
			if (i < lables) {
				plot.fillText(lableArray[i], xpos2,
					hBound+30, 100);

			}
		}

		plot.setTextAlign('left');
		for (var j = 0; j < this.multi; j++) {
			plot.setFillStyle(colorArray[j%colors]);
			plot.fillRect(wBound - 50, -20-25*(this.multi-j-1), 20, 2);
			plot.fillText(lableArray2[j], wBound-20, -20-25*(this.multi-j-1)+12, 50);


		}

		plot.restore();

	}

	/**
	* @usage   扇形统计图
	* @author  mw
	* @date    2016年02月19日  星期五  12:33:05
	* @param
	* @return
	*
	*/
	//扇形统计图 Pie chart
	this.pieChart = function(d, t) {
		var colorArray = ['red', 'orange', '#0088FF', 'green', 'cyan', 'blue', '#FF00FF',
			'#888888', 'black'];
		var colors = colorArray.length;

		var data = new Array();
		data = d;
		var text = new Array();
		text = t;

		var itemCount = data.length;

		var total = 0;

		for (var i = 0; i < itemCount; i++) {
			total += data[i];
		}

		var percentArray = [];

		for (var i = 0; i < itemCount; i++) {
			percentArray.push(data[i]/total);
		}

		//document.write(percentArray);

		var r = 150;

		var sAngle = 0, eAngle = 0;
		var textX, textY;
		//在饼图右侧绘制图例
		var sampX = 200, sampY = -150;

		for (var i = 0; i < itemCount; i++) {
			if (i == 0) {
				sAngle = 0;
				eAngle = 0;

			}

			eAngle -= Math.PI*2*percentArray[i];
			plot.setFillStyle(colorArray[i%colors]);

			shape.fillRect(sampX, sampY, 50, 20);


			plot.beginPath()
				.moveTo(0, 0)
				.arc(0, 0, r, sAngle, eAngle, 1)
				.closePath()
				.fill();

			if (percentArray[i] > 0.05) {
				textX = 0.7*r*Math.cos((sAngle+eAngle)/2);
				textY = 0.6*r*Math.sin((sAngle+eAngle)/2)+5;
			}
			else {
				textX = 1.2*r*Math.cos((sAngle+eAngle)/2);
				textY = 1.2*r*Math.sin((sAngle+eAngle)/2)+20;
			}


			plot.setFillStyle('black')
				.fillText(text[i], textX-30, textY-10, 100)
				.fillText((percentArray[i]*100).toFixed(2)+'%', textX-30, textY+10, 100);

			plot.fillText(text[i], sampX+30, sampY+5, 100);

			sampY += 30;

			sAngle -= Math.PI*2*percentArray[i];

			//document.write(sAngle, '-->', eAngle, '-->');
		}

	}

}
本节到此结束,欲知后事如何,请看下回分解。


 880
880

 被折叠的 条评论
为什么被折叠?
被折叠的 条评论
为什么被折叠?
 到【灌水乐园】发言


