


剧情提要:
[机器小伟]在[工程师阿伟]的陪同下进入了结丹初期的修炼,
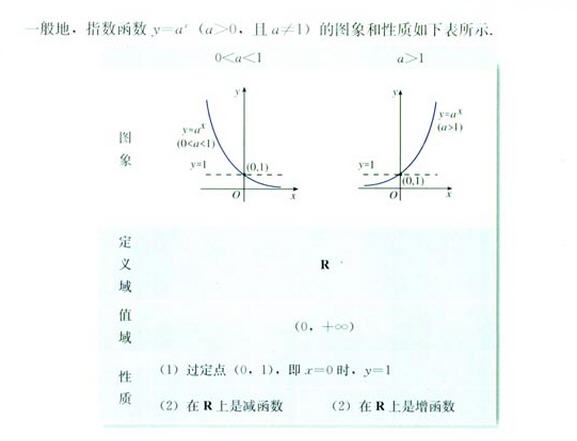
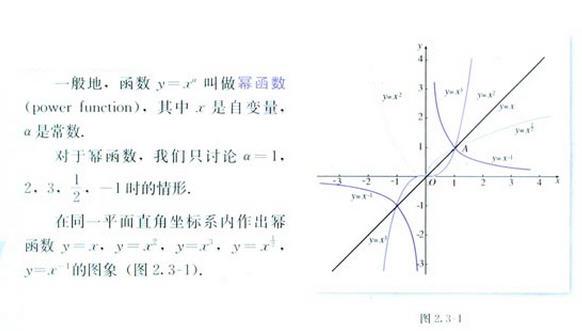
这次要修炼的目标是[基本初等函数(1)]。

[机器小伟]在[工程师阿伟]的陪同下进入了结丹初期的修炼,
这次要修炼的目标是[基本初等函数(1)]。
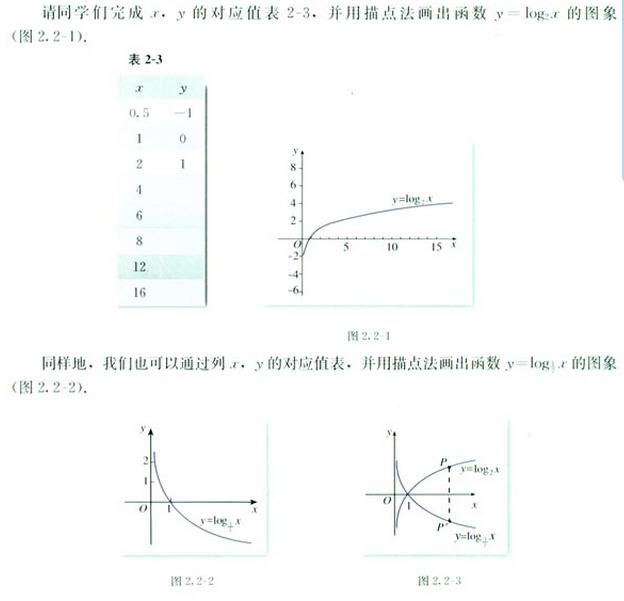
正剧开始:
星历2016年04月09日 08:40:48, 银河系厄尔斯星球中华帝国江南行省。
[工程师阿伟]正在和[机器小伟]一起研究[基本初等函数(1)]。


<span style="font-size:18px;"> if (1) {
var r = 20;
config.setSector(1,1,1,1);
config.graphPaper2D(0, 0, r);
config.axis2D(0, 0,180, 1);
//坐标轴设定
var scaleX = 2*r, scaleY = 2*r;
var spaceX = 2, spaceY = 2;
var xS = -10, xE = 10;
var yS = -10, yE = 10;
config.axisSpacing(xS, xE, spaceX, scaleX, 'X');
config.axisSpacing(yS, yE, spaceY, scaleY, 'Y');
var transform = new Transform();
//存放函数图像上的点
var a = [], b = [], c = [], d = [];
//需要显示的函数说明
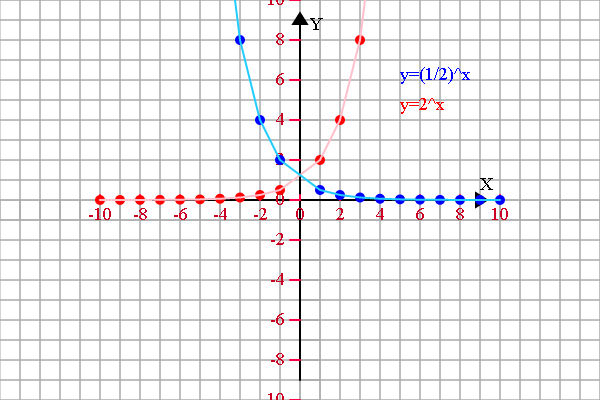
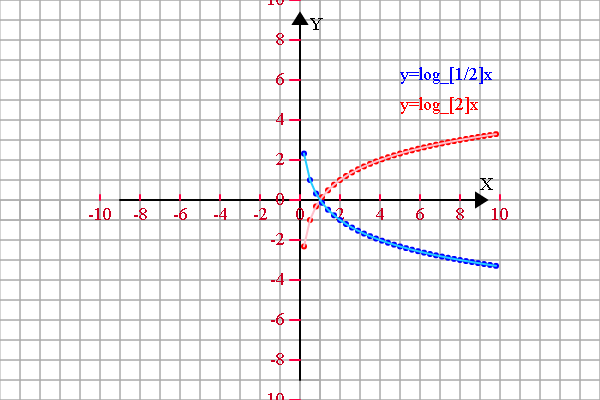
var f1 = 'y=2^x', f2 = 'y=(1/2)^x', f3 = 'y=(1/3)^x', f4 = 'y=3^x';
//函数描点
for (var x = xS; x <= xE; x+=1) {
if (x != 0) {
a.push([x, Math.pow(2, x)]);
b.push([x, Math.pow(1/2, x)]);
c.push([x, Math.pow(1/3, x)]);
d.push([x, Math.pow(3, x)]);
}
}
//存放临时数组
var tmp = [];
//显示变换
if (a.length > 0) {
a = transform.scale(transform.translate(a, 0, 0), scaleX/spaceX, scaleY/spaceY);
//函数1
tmp = [].concat(a);
shape.pointDraw(tmp, 'red');
tmp = [].concat(a);
shape.multiLineDraw(tmp, 'pink');
plot.setFillStyle('red');
plot.fillText(f1, 100, -90, 200);
}
if (b.length > 0) {
b = transform.scale(transform.translate(b, 0, 0), scaleX/spaceX, scaleY/spaceY);
//函数2
tmp = [].concat(b);
shape.pointDraw(tmp, 'blue');
tmp = [].concat(b);
shape.multiLineDraw(tmp, '#22CCFF');
plot.setFillStyle('blue');
plot.fillText(f2, 100, -120, 200);
}
if (c.length > 0) {
c = transform.scale(transform.translate(c, 0, 0), scaleX/spaceX, scaleY/spaceY);
tmp = [].concat(c);
shape.pointDraw(tmp, 'green');
tmp = [].concat(c);
shape.multiLineDraw(tmp, '#CCFF22');
plot.setFillStyle('green');
plot.fillText(f3, 100, -150, 200);
}
if (d.length > 0) {
d = transform.scale(transform.translate(d, 0, 0), scaleX/spaceX, scaleY/spaceY);
tmp = [].concat(d);
shape.pointDraw(tmp, 'orange');
tmp = [].concat(d);
shape.multiLineDraw(tmp, '#CC8800');
plot.setFillStyle('orange');
plot.fillText(f4, 100, -180, 200);
}
} </span>
<span style="font-size:18px;"> if (1) {
var r = 20;
config.setSector(1,1,1,1);
config.graphPaper2D(0, 0, r);
config.axis2D(0, 0,180, 1);
//坐标轴设定
var scaleX = 2*r, scaleY = 2*r;
var spaceX = 2, spaceY = 2;
var xS = -10, xE = 10;
var yS = -10, yE = 10;
config.axisSpacing(xS, xE, spaceX, scaleX, 'X');
config.axisSpacing(yS, yE, spaceY, scaleY, 'Y');
var transform = new Transform();
//存放函数图像上的点
var a = [], b = [], c = [], d = [], e = [];
//需要显示的函数说明
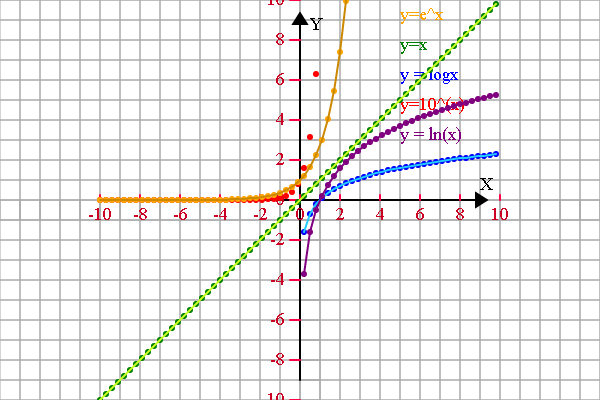
var f1 = 'y=10^(x)', f2 = 'y = logx', f3 = 'y=x', f4 = 'y=e^x',
f5 = 'y = ln(x)';
//函数描点
for (var x = xS; x <= xE; x+=0.3) {
if (x != 0) {
a.push([x, Math.pow(10, x)]);
b.push([x, Math.log(x)]);
c.push([x, x]);
d.push([x, Math.pow(Math.E, x)]);
e.push([x, Math.log(x)/Math.LOG10E]);
}
}
//document.write(a+'<br/>');
//存放临时数组
var tmp = [];
//显示变换
if (a.length > 0) {
a = transform.scale(transform.translate(a, 0, 0), scaleX/spaceX, scaleY/spaceY);
//函数1
tmp = [].concat(a);
shape.pointDraw(tmp, 'red');
tmp = [].concat(a);
shape.multiLineDraw(tmp, 'pink');
plot.setFillStyle('red');
plot.fillText(f1, 100, -90, 200);
}
if (b.length > 0) {
b = transform.scale(transform.translate(b, 0, 0), scaleX/spaceX, scaleY/spaceY);
//函数2
tmp = [].concat(b);
shape.pointDraw(tmp, 'blue');
tmp = [].concat(b);
shape.multiLineDraw(tmp, '#22CCFF');
plot.setFillStyle('blue');
plot.fillText(f2, 100, -120, 200);
}
if (c.length > 0) {
c = transform.scale(transform.translate(c, 0, 0), scaleX/spaceX, scaleY/spaceY);
tmp = [].concat(c);
shape.pointDraw(tmp, 'green');
tmp = [].concat(c);
shape.multiLineDraw(tmp, '#CCFF22');
plot.setFillStyle('green');
plot.fillText(f3, 100, -150, 200);
}
if (d.length > 0) {
d = transform.scale(transform.translate(d, 0, 0), scaleX/spaceX, scaleY/spaceY);
tmp = [].concat(d);
shape.pointDraw(tmp, 'orange');
tmp = [].concat(d);
shape.multiLineDraw(tmp, '#CC8800');
plot.setFillStyle('orange');
plot.fillText(f4, 100, -180, 200);
}
if (e.length > 0) {
e = transform.scale(transform.translate(e, 0, 0), scaleX/spaceX, scaleY/spaceY);
tmp = [].concat(e);
shape.pointDraw(tmp, 'purple');
tmp = [].concat(e);
shape.multiLineDraw(tmp, 'purple');
plot.setFillStyle('purple');
plot.fillText(f5, 100, -60, 200);
}
} </span>
<span style="font-size:18px;"> if (1) {
var r = 20;
config.setSector(1,1,1,1);
config.graphPaper2D(0, 0, r);
config.axis2D(0, 0,180, 1);
//坐标轴设定
var scaleX = 2*r, scaleY = 2*r;
var spaceX = 2, spaceY = 2;
var xS = -10, xE = 10;
var yS = -10, yE = 10;
config.axisSpacing(xS, xE, spaceX, scaleX, 'X');
config.axisSpacing(yS, yE, spaceY, scaleY, 'Y');
var transform = new Transform();
//存放函数图像上的点
var a = [], b = [], c = [], d = [], e = [];
//需要显示的函数说明
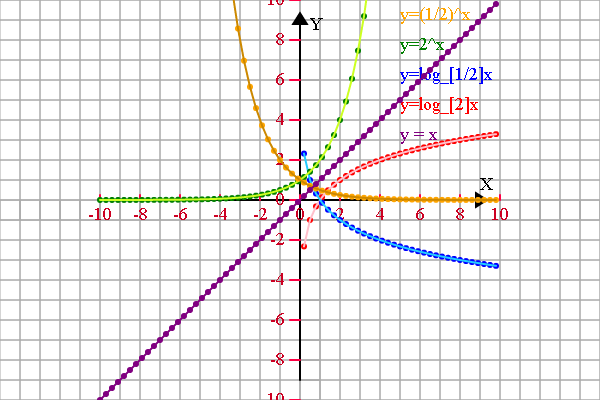
var f1 = 'y=log_[2]x', f2 = 'y=log_[1/2]x', f3 = 'y=2^x', f4 = 'y=(1/2)^x',
f5 = 'y = x';
//函数描点
for (var x = xS; x <= xE; x+=0.3) {
if (x != 0) {
a.push([x, Math.log(x)/Math.log(2)]);
b.push([x, Math.log(x)/Math.log(1/2)]);
c.push([x, Math.pow(2, x)]);
d.push([x, Math.pow(1/2, x)]);
e.push([x, x]);
}
}
//存放临时数组
var tmp = [];
//显示变换
if (a.length > 0) {
a = transform.scale(transform.translate(a, 0, 0), scaleX/spaceX, scaleY/spaceY);
//函数1
tmp = [].concat(a);
shape.pointDraw(tmp, 'red');
tmp = [].concat(a);
shape.multiLineDraw(tmp, 'pink');
plot.setFillStyle('red');
plot.fillText(f1, 100, -90, 200);
}
if (b.length > 0) {
b = transform.scale(transform.translate(b, 0, 0), scaleX/spaceX, scaleY/spaceY);
//函数2
tmp = [].concat(b);
shape.pointDraw(tmp, 'blue');
tmp = [].concat(b);
shape.multiLineDraw(tmp, '#22CCFF');
plot.setFillStyle('blue');
plot.fillText(f2, 100, -120, 200);
}
if (c.length > 0) {
c = transform.scale(transform.translate(c, 0, 0), scaleX/spaceX, scaleY/spaceY);
tmp = [].concat(c);
shape.pointDraw(tmp, 'green');
tmp = [].concat(c);
shape.multiLineDraw(tmp, '#CCFF22');
plot.setFillStyle('green');
plot.fillText(f3, 100, -150, 200);
}
if (d.length > 0) {
d = transform.scale(transform.translate(d, 0, 0), scaleX/spaceX, scaleY/spaceY);
tmp = [].concat(d);
shape.pointDraw(tmp, 'orange');
tmp = [].concat(d);
shape.multiLineDraw(tmp, '#CC8800');
plot.setFillStyle('orange');
plot.fillText(f4, 100, -180, 200);
}
if (e.length > 0) {
e = transform.scale(transform.translate(e, 0, 0), scaleX/spaceX, scaleY/spaceY);
tmp = [].concat(e);
shape.pointDraw(tmp, 'purple');
tmp = [].concat(e);
shape.multiLineDraw(tmp, 'purple');
plot.setFillStyle('purple');
plot.fillText(f5, 100, -60, 200);
}
}
</span>
本节到此结束,欲知后事如何,请看下回分解。


 871
871

 被折叠的 条评论
为什么被折叠?
被折叠的 条评论
为什么被折叠?
 到【灌水乐园】发言


