


作者:罗小波,《千金良方——MySQL性能优化金字塔法则》作者之一。
熟悉MySQL体系结构,擅长数据库的整体调优,喜好专研开源技术,并热衷于开源技术的推广,在线上线下做过多次公开的数据库专题分享,发表过近100篇数据库相关的研究文章。
P.S,如果想要购买作者签名版纸书,可以在本公众号后台发消息给我。
在2018年,我们发布了一篇名为"构建狂拽炫酷屌的MySQL监控平台"的文章,后续一些朋友来询问如何配置监控、如果配置多实例(这两项本文不做赘述,详见文末的索引信息),也有一些朋友照着文档操作报错前来求助的(当时大概一下,是因为新版本稍微有些变化导致的),现在,我们针对当前最新的版本重新梳理了安装与配置步骤分享给大家。
在开始之前,我们先做一个简短的说明,本监控平台所用到的主要软件模块及其对应的版本如下:
软件模块:
* Prometheus及其对应的exporter:用于数据采集和存取
* grafana:用于数据展示的可视化面板
早期文章中的软件版本:
* Prometheus:prometheus-2.1.0
* mysqld_exporter:mysqld_exporter-0.10.0
* node_exporter:node_exporter-0.15.2
* grafana:grafana-4.6.3
* grafana-dashboard:grafana-dashboards-1.6.1
本期文章中的软件版本:
* Prometheus:prometheus-2.17.1
* mysqld_exporter:mysqld_exporter-0.12.1
* node_exporter:node_exporter-1.0.0-rc.0
* grafana:grafana-6.7.2
* grafana-dashboard:grafana-dashboards-2.4.0
* alertmanager:alertmanager-0.20.0
特别说明:本文仅从运维实操的角度对如何玩耍Prometheus + grafana进行阐述,并不涉及到详细深入的原理和架构解读,如有需求请移驾如下链接:
* Prometheus:https://prometheus.io/docs/
* grafana:https://grafana.com/docs/grafana/latest/
下面,我就开始我的表演了,首先列出本次操作演示的服务器环境信息
prometheus+grafana server端(主机名:Slave3):192.168.2.181
MySQL 和主机监控客户端:
* 主库(主机名:Master):192.168.2.135
* 从库1(主机名:Slave1):192.168.2.108
* 从库2(主机名:Slave2):192.168.2.156
1、概述
1.1. 什么是Prometheus?
Prometheus是一个开源的系统监控和报警工具包,最初是在SoundCloud开发的。自2012年项目启动以来,已经有许多公司和组织采用了Prometheus,该项目拥有一个非常活跃的开发人员和用户社区。它现在是一个独立的开源项目,且独立于任何公司进行维护。为了强调这一点,并阐明该项目的治理结构,Prometheus在2016年加入了云原生计算基金会(Cloud Native Computing Foundation,简称CNCF),成为继Kubernetes之后的第二个托管项目。
Prometheus的主要特点如下:
多维数据模型,其中包含通过度量名称和"键-值"对标识的时间序列数据
支持PromQL,PromQL是一种灵活的查询语言
不依赖分布式存储,单个服务器节点可以自治
时间序列数据通过HTTP上的 pull 模型进行收集
通过中间网关支持推送时间序列数据
支持通过服务发现或静态配置来发现目标
支持多种绘图模式和多种仪表盘
组件组成
Prometheus生态系统由多个组件组成,其中许多组件是可选的:
主要的Prometheus Server,它用于抓取和存储时间序列数据
用于检测应用程序代码的客户端库
支持短暂工作的推送网关(pushgateway)
各种服务监控的专用exporter。官方认可的有:blackbox_exporter,consul_exporter,graphite_exporter,haproxy_exporter,memcached_exporter,mysqld_exporter,node_exporter,statsd_exporter,社区支持更多的exporter,详情可参考链接:https://prometheus.io/docs/instrumenting/exporters/
负责处理警报的alertmanager
各种支持工具
大多数Prometheus 组件都是用Go语言编写的,因此易于构建和部署为静态二进制文件
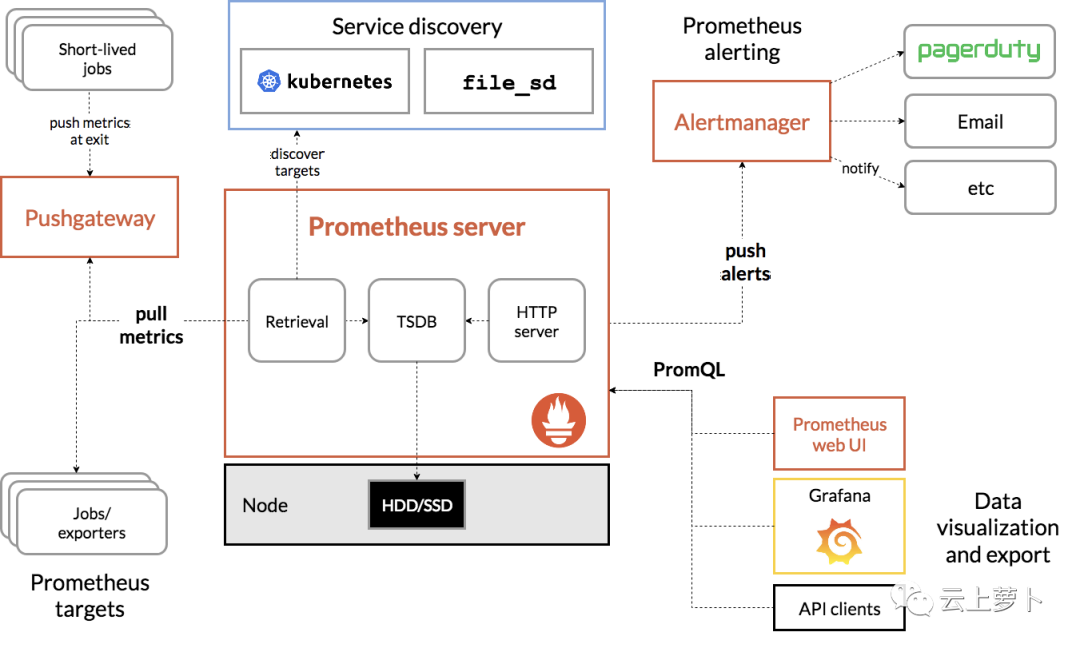
Prometheus体系结构如下图(图片来源:https://prometheus.io/docs/introduction/overview/),该图展示了Prometheus的架构和它的生态系统的一些组件组成
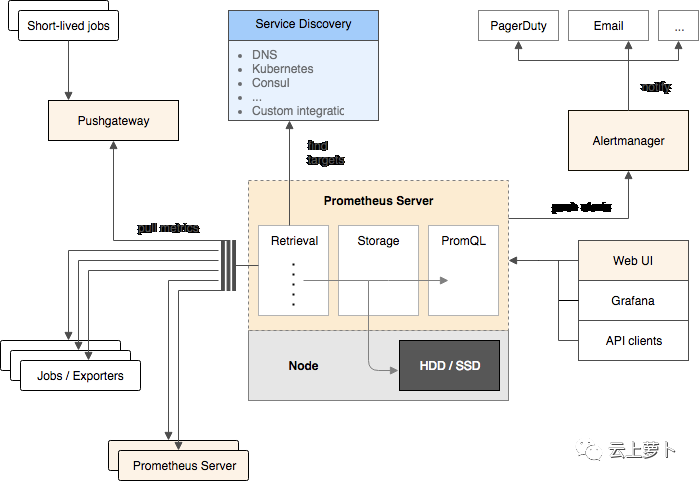
以下是早期的架构图,这里一并给出方便大家做个参照对比
Prometheus适用于什么场景?
Prometheus适用于记录任何纯数字的时间序列数据。它既适合面向主机的监控,也适合面向高动态的服务体系结构的监控。在微服务中,它对多维数据收集和查询的支持具有独特的优势。
Prometheus的设计旨在提高可靠性,它可以在停机时用来快速诊断出现问题的系统。每个Prometheus Server是独立的,不依赖于网络存储或其他远程服务。因此当基础设施中的一部分被破坏时,其仍然可用,所以不需要专门为其规划大量的基础设施来运行它。
Prometheus不合适什么场景?
Prometheus重视高可靠性,因此,即使在部分出现故障的情况下,也可以查看关于系统的可用统计信息。如果您需要100%的准确性,那么Prometheus不是一个好的选择,因为Prometheus收集到的数据可能不够详细和完整,也可能不够即时。在这种情况下,最好使用其他系统来收集和分析数据以进行实时的监控,并使用Prometheus来完成剩下的监控工作(例如:当做grafana的展示数据源使用)。
1.2. 什么是grafana?
Grafana是一个可视化大型测量数据的开源程序,实际上就是一个可视化面板(Dashboard),有着非常漂亮的图表和布局展示,功能齐全的度量仪表盘和图形编辑器,提供了强大和优雅的方式去创建、共享、浏览数据,grafana有热插拔控制面板和可扩展的数据源,目前已经支持的数据源有如下一些:
时序数据库:Prometheus、Graphite、OpenTSDB、InfluxDB
文档数据库:Loki、Elasticsearch
关系型数据库:MySQL、PostgreSQL、Microsoft SQL Server
云监控服务:Stackdriver、CloudWatch、Azure Monitor、Grafana Cloud
商业数据库扩展插件:Splunk、ServiceNow、Oracle、New Relic、Dynatrace、DataDog
其他:TestData DB
PS:随着版本的迭代,支持接入的数据源将会更多
2、安装部署
2.1. 安装prometheus
prometheus是一个监控采集与数据存储框架(监控server端),具体采集什么数据依赖于具体的exporter(监控client端),例如:采集MySQL的数据需要使用到mysql_exporter,prometheus调用mysql_expoter采集到mysql的监控指标之后,把mysql_exporter采集到的数据存放到prometheus所在服务器的TSDB中保存(详情可参考链接:https://prometheus.io/docs/prometheus/latest/storage/)。
2.1.1. 下载安装包
对于prometheus,假设我们需要监控MySQL,那么我们需要下载至少3个组件,如下:
prometheus程序包
node_exporter:监控主机磁盘、内存、CPU等硬件性能指标的采集程序包
mysql_exporter:监控mysql各种性能指标的采集程序包
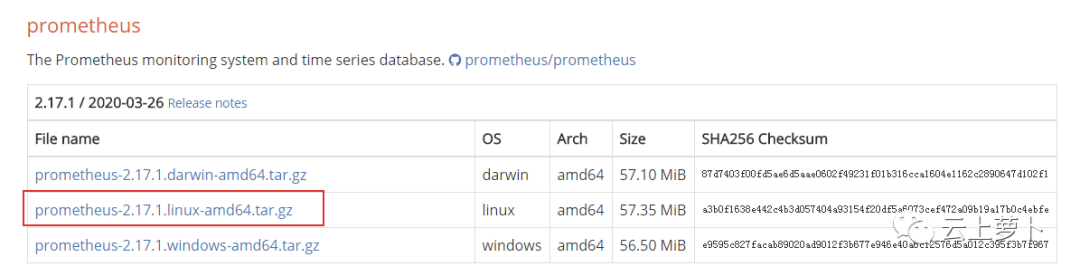
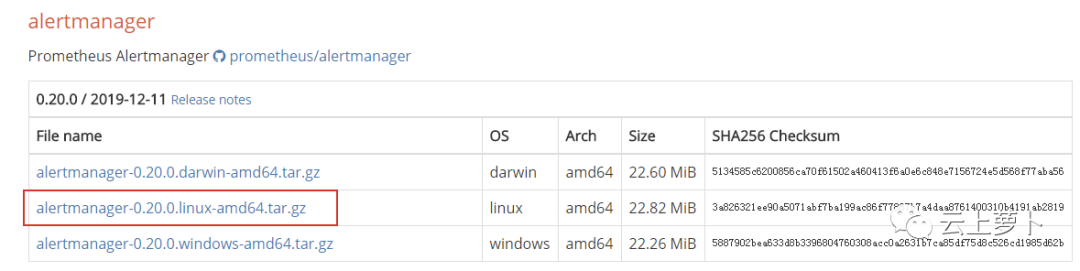
下载链接(该页面始终只有一个最新版本):https://prometheus.io/download/
下载prometheus,其中包含了监控采集框架和存储采集数据的时序数据库
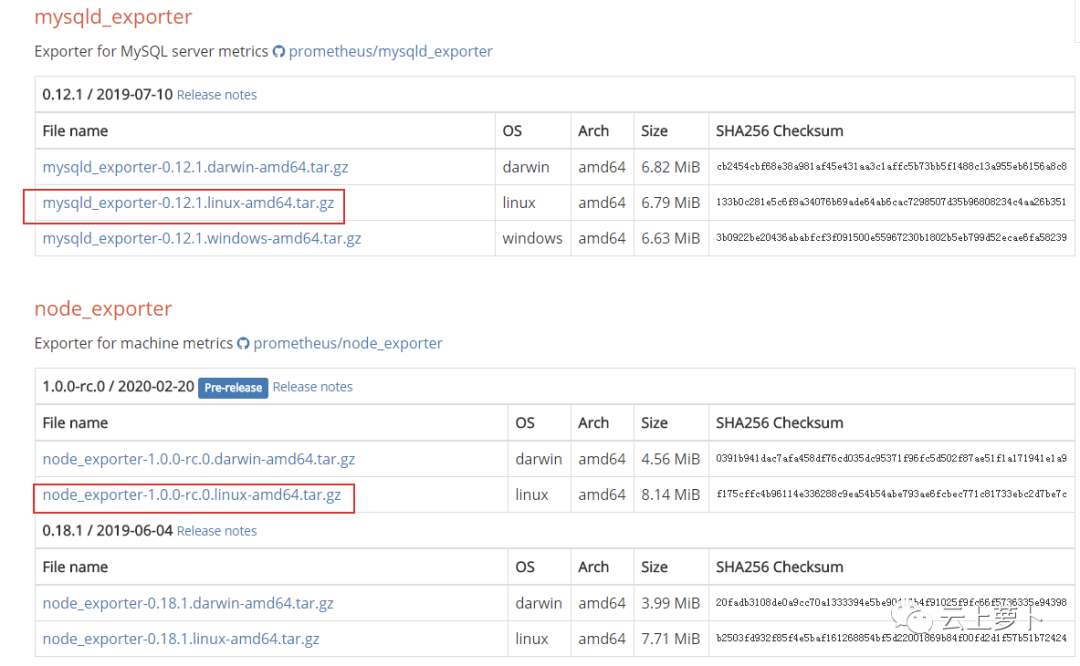
下载mysqld_exporter和node_exporter,其中,mysqld_exporter是MySQL数据的采集端,node_exporter是主机负载数据的采集端
PS:如果你还需要配置监控告警,需要下载alertmanager程序包
2.1.2. 解压程序包
解压prometheus
[root@localhost ~]# mkdir /data
[root@localhost ~]# tar xf prometheus-2.17.1.linux-amd64.tar.gz -C /data/
解压exporter:由于prometheus主机自身也需要监控,所以也至少需要在安装prometheus的主机上解压node_exporter包(安装prometheus的主机上如果没有数据库则不需要安装mysqld_exporter包)
[root@localhost ~]# tar xf node_exporter-1.0.0-rc.0.linux-amd64.tar.gz -C /data/
# 如果需要监控mysql,则继续解压mysql_exporter
[root@localhost ~]# tar xf mysqld_exporter-0.12.1.linux-amd64.tar.gz -C /data/
在其他监控目标数据库服务器上,分别解压上述2个exporter包(略)
2.1.3. 启动prometheus
进入prometheus的工作目录
[root@localhost ~]# cd /data/
[root@localhost data]# mv prometheus-2.17.1.linux-amd64/ prometheus
[root@localhost ~]# cd /data/prometheus
配置 prometheus.yml配置文件
[root@localhost data]# cat prometheus.yml
# my global config
global:
  scrape_interval:    15s # Set the scrape interval to every 15 seconds. Default is every 1 minute.
  evaluation_interval: 15s # Evaluate rules every 15 seconds. The default is every 1 minute.
  # scrape_timeout is set to the global default (10s).


# A scrape configuration containing exactly one endpoint to scrape:
# Here it's Prometheus itself.
scrape_configs:
- file_sd_configs:  # 注意,如果指定从某配置文件加载监控目标,则在prometheus启动之前需要确保该文件在prometheus的工作目录下事先存在,否则可能后续配置过程中出现报错
  - files:
    - host.yml
  job_name: Host
  metrics_path: /metrics
  relabel_configs:
  - source_labels: [__address__]
    regex: (.*)
    target_label: instance
    replacement: $1
  - source_labels: [__address__]
    regex: (.*)
    target_label: __address__
    replacement: $1:9100
- file_sd_configs:  # 注意,如果指定从某配置文件加载监控目标,则在prometheus启动之前需要确保该文件在prometheus的工作目录下事先存在,否则可能后续配置过程中出现报错
  - files:
    - mysql.yml
  job_name: MySQL
  metrics_path: /metrics
  relabel_configs:
  - source_labels: [__address__]
    regex: (.*)
    target_label: instance
    replacement: $1
  - source_labels: [__address__]
    regex: (.*)
    target_label: __address__
    replacement: $1:9104


- job_name: prometheus
  static_configs:
  - targets:
    - localhost:9090
先创建2个空的主机和MySQL配置文件,以避免启动报错
[root@localhost prometheus]# touch host.yml mysql.yml
启动prometheus进程,30d表示prometheus只保留30天以内的数据(注意,如果直接使用prometheus命令启动而不是使用service脚本,那么你需要先切换到工作目录下再启动,例如,这里工作目录为/data/prometheus)
[root@localhost prometheus]# /data/prometheus/prometheus --storage.tsdb.retention=30d &
如果是7.x系统,可以按照如下方式配置service启动脚本
# 修改WorkingDirectory参数为你的prometheus的工作目录
[root@localhost prometheus]# cat /usr/lib/systemd/system/prometheus.service
[Unit]
Description=Prometheus instance
Wants=network-online.target
After=network-online.target
After=postgresql.service mariadb.service mysql.service


[Service]
User=root
Group=root
Type=simple
Restart=on-failure
WorkingDirectory=/data/prometheus/
RuntimeDirectory=prometheus
RuntimeDirectoryMode=0750
ExecStart=/data/prometheus/prometheus  --storage.tsdb.retention=30d --config.file=/data/prometheus/prometheus.yml
LimitNOFILE=10000
TimeoutStopSec=20


[Install]
WantedBy=multi-user.target
注意:如果需要使用service启动脚本,则需要先将手动启动的prometheus进程停止,才能使用
[root@localhost prometheus]# ps aux |grep prometheus
root 10060 0.2 1.9 165356 35528 pts/2 Sl 19:41 0:00 /data/prometheus/prometheus --storage.tsdb.retention=30d
root 10175 0.0 0.0 112728 976 pts/2 S+ 19:42 0:00 grep --color=auto prometheus


[root@localhost prometheus]# kill 10060
[root@localhost prometheus]# level=warn ts=2020-04-11T11:43:08.058Z caller=main.go:512 msg="Received SIGTERM, exiting gracefully..."
level=info ts=2020-04-11T11:43:08.058Z caller=main.go:535 msg="Stopping scrape discovery manager..."
level=info ts=2020-04-11T11:43:08.058Z caller=main.go:549 msg="Stopping notify discovery manager..."
level=info ts=2020-04-11T11:43:08.058Z caller=main.go:571 msg="Stopping scrape manager..."
level=info ts=2020-04-11T11:43:08.058Z caller=main.go:531 msg="Scrape discovery manager stopped"
level=info ts=2020-04-11T11:43:08.058Z caller=main.go:545 msg="Notify discovery manager stopped"
level=info ts=2020-04-11T11:43:08.059Z caller=manager.go:882 component="rule manager" msg="Stopping rule manager..."
level=info ts=2020-04-11T11:43:08.059Z caller=manager.go:892 component="rule manager" msg="Rule manager stopped"
level=info ts=2020-04-11T11:43:08.059Z caller=main.go:565 msg="Scrape manager stopped"
level=info ts=2020-04-11T11:43:08.061Z caller=notifier.go:598 component=notifier msg="Stopping notification manager..."
level=info ts=2020-04-11T11:43:08.061Z caller=main.go:738 msg="Notifier manager stopped"
level=info ts=2020-04-11T11:43:08.061Z caller=main.go:750 msg="See you next time!"


[1]+ 完成 /data/prometheus/prometheus --storage.tsdb.retention=30d


[root@localhost prometheus]# service prometheus start
Redirecting to /bin/systemctl start prometheus.service
[root@localhost prometheus]#
[root@localhost prometheus]# service prometheus status
Redirecting to /bin/systemctl status prometheus.service
# prometheus.service - Prometheus instance
   Loaded: loaded (/usr/lib/systemd/system/prometheus.service; enabled; vendor preset: disabled)
   Active: active (running) since 六 2020-04-11 19:43:36 CST; 2s ago
 Main PID: 10238 (prometheus)
   CGroup: /system.slice/prometheus.service
           └─10238 /data/prometheus/prometheus --storage.tsdb.retention=30d --config.file=/data/prometheus/prometheus.yml


4月 11 19:43:36 localhost.localdomain prometheus[10238]: level=info ts=2020-04-11T11:43:36.317Z caller=web.go:514 component=web msg="Start listening for connections" address=0.0.0.0:9090
4月 11 19:43:36 localhost.localdomain prometheus[10238]: level=info ts=2020-04-11T11:43:36.320Z caller=head.go:575 component=tsdb msg="replaying WAL, this may take awhile"
4月 11 19:43:36 localhost.localdomain prometheus[10238]: level=info ts=2020-04-11T11:43:36.325Z caller=head.go:624 component=tsdb msg="WAL segment loaded" segment=0 maxSegment=1
4月 11 19:43:36 localhost.localdomain prometheus[10238]: level=info ts=2020-04-11T11:43:36.325Z caller=head.go:624 component=tsdb msg="WAL segment loaded" segment=1 maxSegment=1
4月 11 19:43:36 localhost.localdomain prometheus[10238]: level=info ts=2020-04-11T11:43:36.325Z caller=head.go:627 component=tsdb msg="WAL replay completed" duration=4.382388ms
4月 11 19:43:36 localhost.localdomain prometheus[10238]: level=info ts=2020-04-11T11:43:36.326Z caller=main.go:683 fs_type=XFS_SUPER_MAGIC
4月 11 19:43:36 localhost.localdomain prometheus[10238]: level=info ts=2020-04-11T11:43:36.326Z caller=main.go:684 msg="TSDB started"
4月 11 19:43:36 localhost.localdomain prometheus[10238]: level=info ts=2020-04-11T11:43:36.326Z caller=main.go:788 msg="Loading configuration file" filename=/data/prometheus/prometheus.yml
4月 11 19:43:36 localhost.localdomain prometheus[10238]: level=info ts=2020-04-11T11:43:36.327Z caller=main.go:816 msg="Completed loading of configuration file" filename=/data/prometheus/prometheus.yml
4月 11 19:43:36 localhost.localdomain prometheus[10238]: level=info ts=2020-04-11T11:43:36.327Z caller=main.go:635 msg="Server is ready to receive web requests."
PS:prometheus默认的web访问端口为9090,可以使用如下地址访问(使用谷歌内核浏览器,注,此时由于还位添加任何主机和数据库监控列表,页面是没有任何数据的,如果有需要,请跳转到"3、监控节点部署")
http://192.168.2.181:9090
2.2. 安装grafana
grafana是类似于一个出图展示框架,grafana根据grafana-dashboards来进行展示,grafana-dashboards就类似于grafana的出图配置文件,根据在grafana-dashboards中的定义来确定在页面中需要展示什么指标,需要如何展示等
2.2.1. 下载安装包
对于grafana来说,需要下载一个程序包,一个grafana-dashboards包
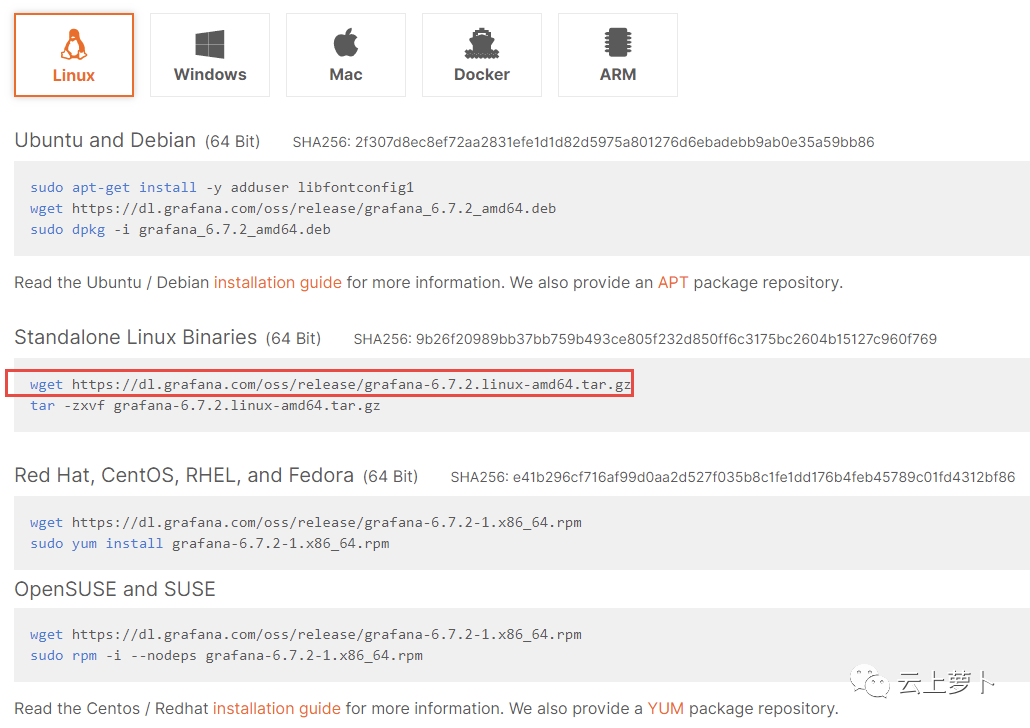
下载链接
grafana程序包:https://grafana.com/grafana/download
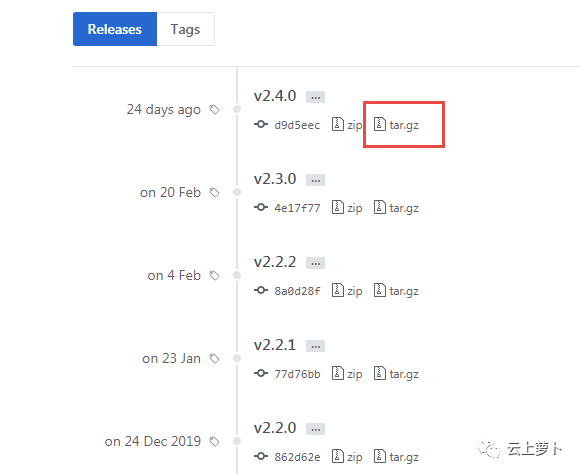
grafana-dashboards包:https://github.com/percona/grafana-dashboards/releases
2.2.2. 解压程序包
解压grafana
[root@localhost ~]# tar xf grafana-6.7.2.linux-amd64.tar.gz -C /data/prometheus/
[root@localhost ~]# cd /data/prometheus
[root@localhost prometheus]# mv grafana-6.7.2/ grafana
2.2.3. 启动grafana
进入grafana工作目录,并启动
[root@localhost ]# cd /data/prometheus/grafana
[root@localhost ]# ./bin/grafana-server &
如果是7.x系统,可以按照如下方式配置service启动脚本
[root@localhost service]# cat /usr/lib/systemd/system/grafana-server.service
[Unit]
Description=Grafana instance
Documentation=http://docs.grafana.org
Wants=network-online.target
After=network-online.target
After=postgresql.service mariadb.service mysql.service


[Service]
User=root
Group=root
Type=simple
Restart=on-failure
WorkingDirectory=/data/prometheus/grafana
RuntimeDirectory=grafana
RuntimeDirectoryMode=0750
ExecStart=/data/prometheus/grafana/bin/grafana-server
LimitNOFILE=10000
TimeoutStopSec=20


[Install]
WantedBy=multi-user.target


# 注意,如果手工启动了grafana-server,则需要先手动杀掉grafana进程之后才能使用service脚本
[root@localhost grafana]# service grafana-server start
Redirecting to /bin/systemctl start grafana-server.service
[root@localhost grafana]# service grafana-server status
Redirecting to /bin/systemctl status grafana-server.service
# grafana-server.service - Grafana instance
   Loaded: loaded (/usr/lib/systemd/system/grafana-server.service; disabled; vendor preset: disabled)
   Active: active (running) since 六 2020-04-11 21:24:59 CST; 3s ago
     Docs: http://docs.grafana.org
 Main PID: 10512 (grafana-server)
   CGroup: /system.slice/grafana-server.service
           └─10512 /data/prometheus/grafana/bin/grafana-server


4月 11 21:24:59 localhost.localdomain grafana-server[10512]: t=2020-04-11T21:24:59+0800 lvl=info msg="Initializing SearchService" logger=server
4月 11 21:24:59 localhost.localdomain grafana-server[10512]: t=2020-04-11T21:24:59+0800 lvl=info msg="Initializing TracingService" logger=server
4月 11 21:24:59 localhost.localdomain grafana-server[10512]: t=2020-04-11T21:24:59+0800 lvl=info msg="Initializing UsageStatsService" logger=server
4月 11 21:24:59 localhost.localdomain grafana-server[10512]: t=2020-04-11T21:24:59+0800 lvl=info msg="Initializing CleanUpService" logger=server
4月 11 21:24:59 localhost.localdomain grafana-server[10512]: t=2020-04-11T21:24:59+0800 lvl=info msg="Initializing NotificationService" logger=server
4月 11 21:24:59 localhost.localdomain grafana-server[10512]: t=2020-04-11T21:24:59+0800 lvl=info msg="Initializing provisioningServiceImpl" logger=server
4月 11 21:24:59 localhost.localdomain grafana-server[10512]: t=2020-04-11T21:24:59+0800 lvl=info msg="Initializing Stream Manager"
4月 11 21:24:59 localhost.localdomain grafana-server[10512]: t=2020-04-11T21:24:59+0800 lvl=info msg="HTTP Server Listen" logger=http.server address=[::]:3000 protocol=http subUrl= socket=
4月 11 21:24:59 localhost.localdomain grafana-server[10512]: t=2020-04-11T21:24:59+0800 lvl=info msg="Backend rendering via phantomJS" logger=rendering renderer=phantomJS
4月 11 21:24:59 localhost.localdomain grafana-server[10512]: t=2020-04-11T21:24:59+0800 lvl=warn msg="phantomJS is deprecated and will be removed in a future release. You should consider migrating from phantomJS to grafana-image-renderer plugin. Read more at https:/...
Hint: Some lines were ellipsized, use -l to show in full.
2.2.4. 配置grafana
2.2.4.1. 登录grafana页面
打开grafana页面(默认帐号和密码:admin/admin,默认的端口为3000,通过地址:http://192.168.2.181:3000 访问。使用谷歌内核浏览器),配置数据来源
输入原始账号和密码:admin/admin

输入新密码,重置初始密码(这里我们选择跳过),注意,不要使用IE内核浏览器,否则可能出现无法修改密码、也无法跳过修改密码的步骤

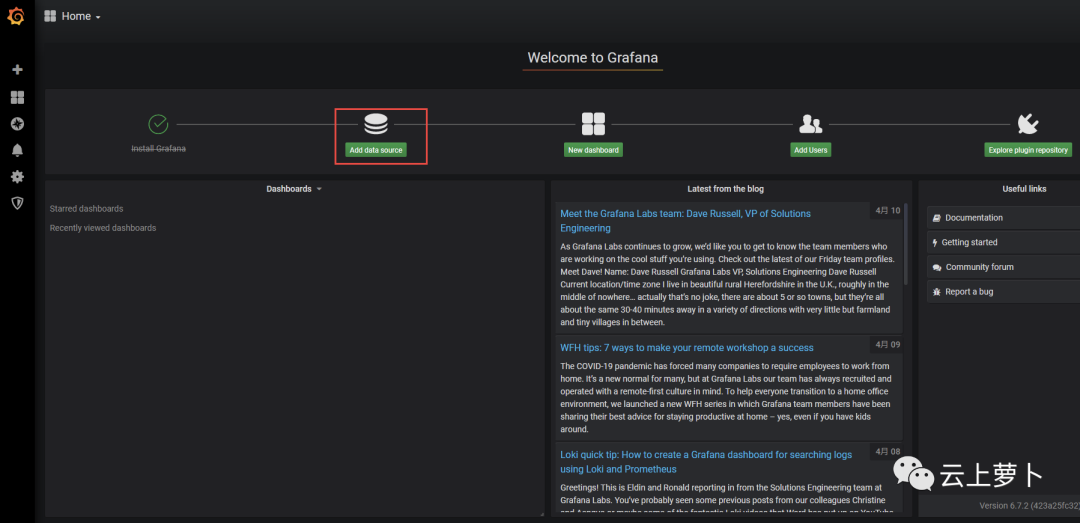
到了这里,可以发现新版本的配置步骤变成了向导式的了,点击"Add data source"按钮
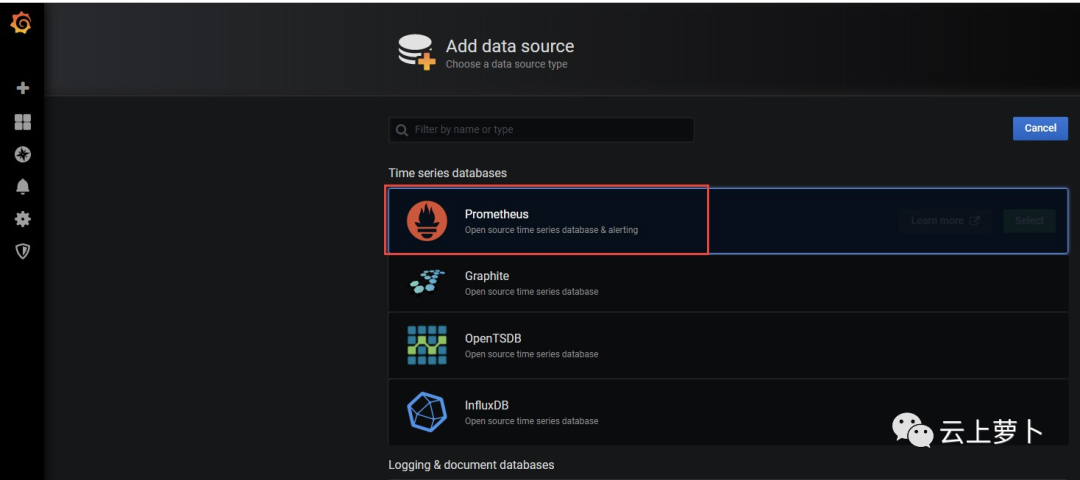
在跳转的页面中,可以看到,新版本支持的数据源非常多,这里我们选择prometheus
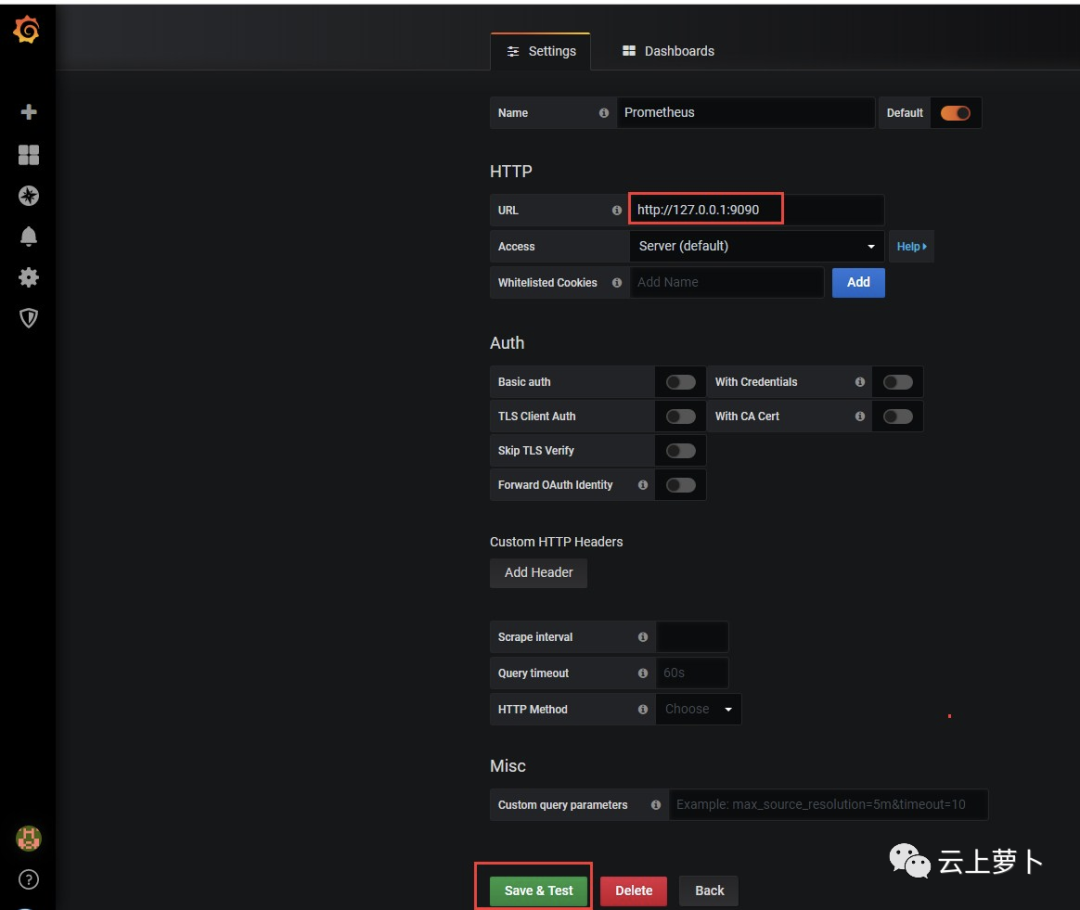
指定prometheus地址,这里我们把grafana装在了同一台机器,直接使用127.0.0.1的地址配置即可,如下图
2.2.4.2. 在grafana中导入grafana-dashboards
解压grafana-dashboards包,该包中提供了大量的json格式文件的grafana dashboards,根据需要自行选择,我们这里需要监控主机和MySQL,就选择如下一些json文件
[root@localhost ~]#  tar xf grafana-dashboards-2.4.0.tar.gz
[root@localhost ~]# cd grafana-dashboards-2.4.0/dashboards/
[root@localhost dashboards]# updatedb
[root@localhost ~]# locate grafana-dashboards |grep dashboards |grep json
......
/root/grafana-dashboards-2.4.0/dashboards/Advanced_Data_Exploration.json
/root/grafana-dashboards-2.4.0/dashboards/CPU_Utilization_Details.json
/root/grafana-dashboards-2.4.0/dashboards/Disk_Details.json
/root/grafana-dashboards-2.4.0/dashboards/Home_Dashboard.json
/root/grafana-dashboards-2.4.0/dashboards/Memory_Details.json
......
/root/grafana-dashboards-2.4.0/dashboards/MySQL_Command_Handler_Counters_Compare.json
/root/grafana-dashboards-2.4.0/dashboards/MySQL_InnoDB_Compression_Details.json
/root/grafana-dashboards-2.4.0/dashboards/MySQL_InnoDB_Details.json
/root/grafana-dashboards-2.4.0/dashboards/MySQL_Instance_Summary.json
/root/grafana-dashboards-2.4.0/dashboards/MySQL_Instances_Compare.json
/root/grafana-dashboards-2.4.0/dashboards/MySQL_Instances_Overview.json
/root/grafana-dashboards-2.4.0/dashboards/MySQL_MyISAM_Aria_Details.json
/root/grafana-dashboards-2.4.0/dashboards/MySQL_MyRocks_Details.json
/root/grafana-dashboards-2.4.0/dashboards/MySQL_Performance_Schema_Details.json
/root/grafana-dashboards-2.4.0/dashboards/MySQL_Query_Response_Time_Details.json
/root/grafana-dashboards-2.4.0/dashboards/MySQL_Replication_Summary.json
/root/grafana-dashboards-2.4.0/dashboards/MySQL_Table_Details.json
......
/root/grafana-dashboards-2.4.0/dashboards/MySQL_Wait_Event_Analyses_Details.json
......
/root/grafana-dashboards-2.4.0/dashboards/Network_Details.json
/root/grafana-dashboards-2.4.0/dashboards/Node_Summary.json
/root/grafana-dashboards-2.4.0/dashboards/Node_Temperature_Details.json
/root/grafana-dashboards-2.4.0/dashboards/Nodes_Compare.json
/root/grafana-dashboards-2.4.0/dashboards/Nodes_Overview.json
......
/root/grafana-dashboards-2.4.0/dashboards/Processes_Details.json
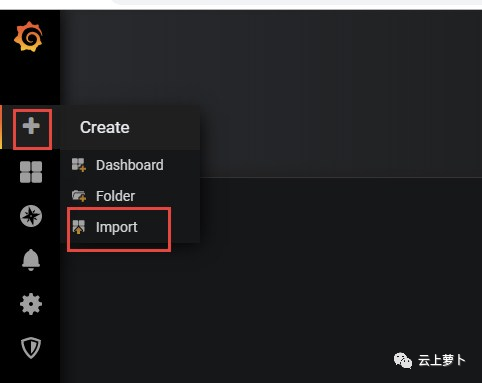
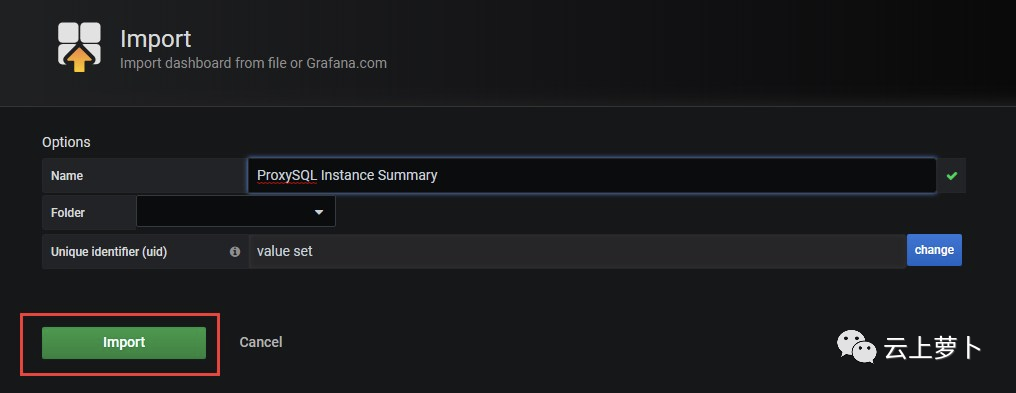
在grafana页面中,导入需要的json文件
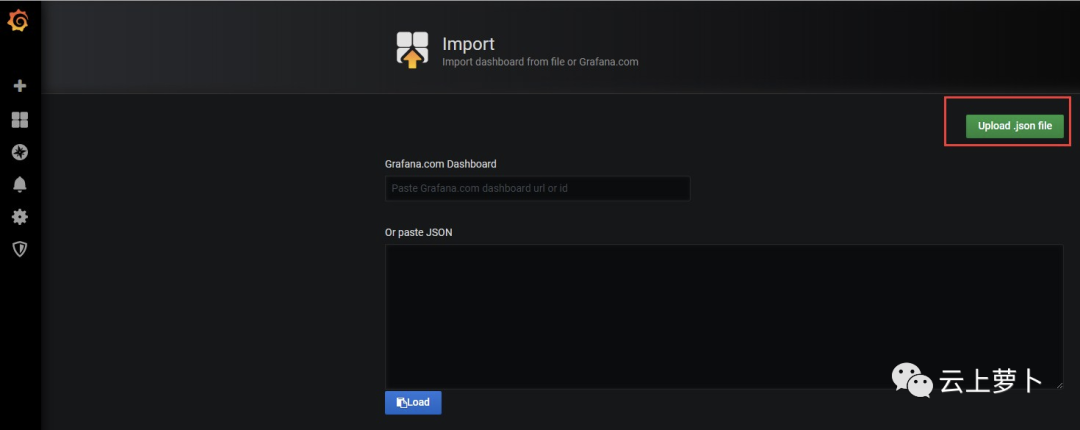
在弹出的窗口中选择你需要导入的json文件
然后,如果你的grafana中已经添加过主机,此时,就可以看到相应的json dashboard监控数据(注意:这里还不会有数据,因为监控主机的exporter程序还未启动,后续步骤马上讲到,这里只需要模版添加成功即可)

至此,prometheus+grafana的基础架构(server端)已经搭建好了,现在,你可以去给他们添加监控节点了(client端)
PS:如果dashboard文件加载之后报如下错误,则说明缺少了digiapulssi-breadcrumb-panel面板插件
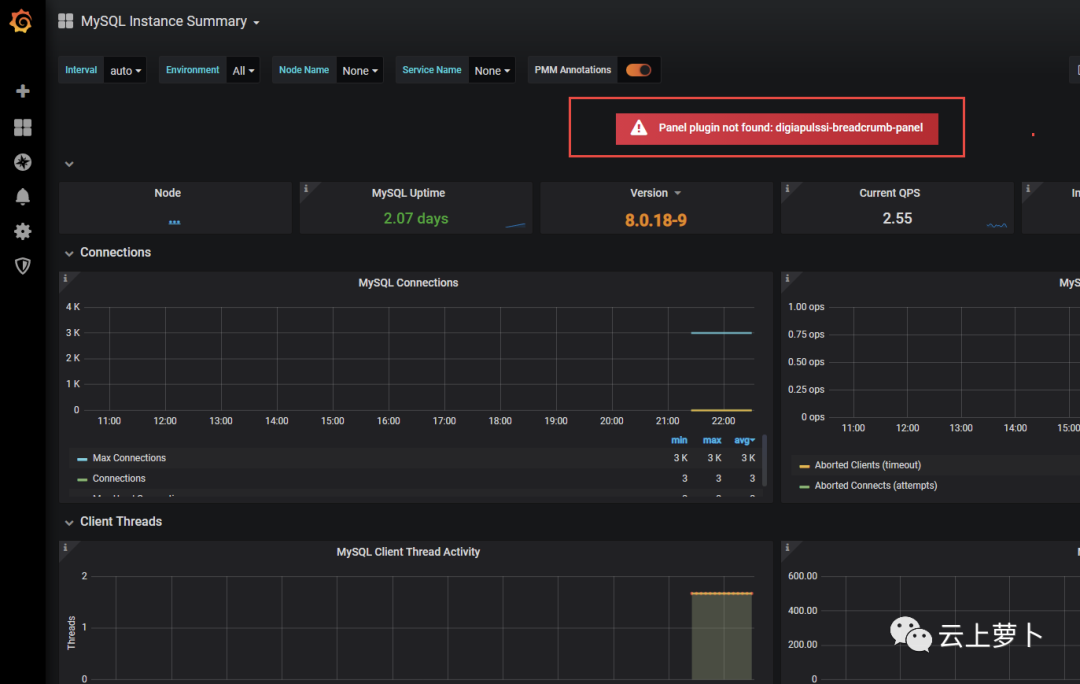
使用grafana-cli命令安装该面板插件,然后重启grafana-server服务即可
[root@localhost ~]# cd /data/prometheus/grafana/
[root@localhost grafana]# ./bin/grafana-cli plugins install digiapulssi-breadcrumb-panel
installing digiapulssi-breadcrumb-panel @ 1.1.6
from: https://grafana.com/api/plugins/digiapulssi-breadcrumb-panel/versions/1.1.6/download
into: /var/lib/grafana/plugins
✔ Installed digiapulssi-breadcrumb-panel successfully
Restart grafana after installing plugins . <service grafana-server restart>


[root@localhost grafana]# ./bin/grafana-cli plugins install grafana-polystat-panel
installing grafana-polystat-panel @ 1.1.0
from: https://grafana.com/api/plugins/grafana-polystat-panel/versions/1.1.0/download
into: /var/lib/grafana/plugins
✔ Installed grafana-polystat-panel successfully
Restart grafana after installing plugins . <service grafana-server restart>


[root@localhost grafana]# service grafana-server restart
Redirecting to /bin/systemctl restart grafana-server.service
如果还有其他面板插件需要安装,可以通过如下命令查看可用的插件列表,然后进行安装
[root@localhost grafana]# cd /data/prometheus/grafana/
[root@localhost grafana]# ./bin/grafana-cli plugins list-remote
id: abhisant-druid-datasource version: 0.0.5
id: agenty-flowcharting-panel version: 0.7.0
id: aidanmountford-html-panel version: 0.0.1
id: akumuli-datasource version: 1.3.11
id: alexanderzobnin-zabbix-app version: 3.11.0
id: alexandra-trackmap-panel version: 1.2.4
id: andig-darksky-datasource version: 1.0.1
id: ayoungprogrammer-finance-datasource version: 1.0.0
id: belugacdn-app version: 1.2.0
id: bessler-pictureit-panel version: 1.0.0
id: blackmirror1-singlestat-math-panel version: 1.1.7
id: blackmirror1-statusbygroup-panel version: 1.1.1
id: bosun-app version: 0.0.28
id: briangann-datatable-panel version: 0.0.9
id: briangann-gauge-panel version: 0.0.6
id: btplc-alarm-box-panel version: 1.0.8
id: btplc-peak-report-panel version: 0.2.4
id: btplc-status-dot-panel version: 0.2.4
id: btplc-trend-box-panel version: 0.1.9
id: camptocamp-prometheus-alertmanager-datasource version: 0.0.7
id: citilogics-geoloop-panel version: 1.1.1
id: cloudflare-app version: 0.1.4
id: cognitedata-datasource version: 1.0.1
id: corpglory-progresslist-panel version: 1.0.5
id: dalmatinerdb-datasource version: 1.0.5
id: ddurieux-glpi-app version: 1.3.0
id: devicehive-devicehive-datasource version: 2.0.1
id: devopsprodigy-kubegraf-app version: 1.3.0
id: digiapulssi-breadcrumb-panel version: 1.1.6
id: digiapulssi-organisations-panel version: 1.3.0
id: digrich-bubblechart-panel version: 1.1.0
id: doitintl-bigquery-datasource version: 1.0.7
id: farski-blendstat-panel version: 1.0.2
id: fastweb-openfalcon-datasource version: 1.0.0
id: fatcloud-windrose-panel version: 0.7.0
id: fetzerch-sunandmoon-datasource version: 0.1.5
id: flant-statusmap-panel version: 0.2.0
id: foursquare-clouderamanager-datasource version: 0.9.2
id: fzakaria-simple-annotations-datasource version: 1.0.0
id: gnocchixyz-gnocchi-datasource version: 1.7.0
id: goshposh-metaqueries-datasource version: 0.0.3
id: grafana-azure-data-explorer-datasource version: 2.0.5
id: grafana-azure-monitor-datasource version: 0.3.0
id: grafana-clock-panel version: 1.0.3
id: grafana-googlesheets-datasource version: 0.9.0
id: grafana-image-renderer version: 1.0.12
id: grafana-influxdb-08-datasource version: 1.0.2
id: grafana-influxdb-flux-datasource version: 5.4.1
id: grafana-kairosdb-datasource version: 3.0.1
id: grafana-kubernetes-app version: 1.0.1
id: grafana-piechart-panel version: 1.4.0
id: grafana-polystat-panel version: 1.1.0
id: grafana-sensu-app version: 1.0.6
id: grafana-simple-json-datasource version: 1.4.0
id: grafana-strava-datasource version: 1.1.1
id: grafana-worldmap-panel version: 0.2.1
id: gretamosa-topology-panel version: 1.0.0
id: gridprotectionalliance-openhistorian-datasource version: 1.0.2
id: gridprotectionalliance-osisoftpi-datasource version: 1.0.4
id: hawkular-datasource version: 1.1.1
id: ibm-apm-datasource version: 0.9.0
id: instana-datasource version: 2.7.0
id: jasonlashua-prtg-datasource version: 4.0.3
id: jdbranham-diagram-panel version: 1.6.1
id: jeanbaptistewatenberg-percent-panel version: 1.0.6
id: kentik-app version: 1.3.4
id: larona-epict-panel version: 1.2.2
id: linksmart-hds-datasource version: 1.0.1
id: linksmart-sensorthings-datasource version: 1.3.0
id: logzio-datasource version: 5.0.0
id: macropower-analytics-panel version: 0.0.1
id: marcuscalidus-svg-panel version: 0.3.3
id: michaeldmoore-annunciator-panel version: 1.0.4
id: michaeldmoore-multistat-panel version: 1.2.7
id: monasca-datasource version: 1.0.0
id: monitoringartist-monitoringart-datasource version: 1.0.0
id: moogsoft-aiops-app version: 7.3.1
id: mtanda-google-calendar-datasource version: 1.0.4
id: mtanda-heatmap-epoch-panel version: 0.1.7
id: mtanda-histogram-panel version: 0.1.6
id: mxswat-separator-panel version: 1.0.0
id: natel-discrete-panel version: 0.0.9
id: natel-influx-admin-panel version: 0.0.5
id: natel-plotly-panel version: 0.0.6
id: natel-usgs-datasource version: 0.0.2
id: neocat-cal-heatmap-panel version: 0.0.3
id: novalabs-annotations-panel version: 0.0.1
id: ns1-app version: 0.0.7
id: ntop-ntopng-datasource version: 1.0.0
id: oci-datasource version: 1.0.2
id: opennms-helm-app version: 5.0.1
id: ovh-warp10-datasource version: 2.1.2
id: paytm-kapacitor-datasource version: 0.1.2
id: percona-percona-app version: 1.0.0
id: petrslavotinek-carpetplot-panel version: 0.1.1
id: pierosavi-imageit-panel version: 0.1.3
id: pr0ps-trackmap-panel version: 2.0.4
id: praj-ams-datasource version: 1.2.0
id: pue-solr-datasource version: 1.0.2
id: quasardb-datasource version: 3.5.0
id: rackerlabs-blueflood-datasource version: 0.0.2
id: radensolutions-netxms-datasource version: 1.2.1
id: raintank-snap-app version: 0.0.5
id: raintank-worldping-app version: 1.2.7
id: ryantxu-ajax-panel version: 0.0.7-dev
id: ryantxu-annolist-panel version: 0.0.1
id: satellogic-3d-globe-panel version: 0.1.0
id: savantly-heatmap-panel version: 0.2.0
id: sbueringer-consul-datasource version: 0.1.5
id: scadavis-synoptic-panel version: 1.0.4
id: sidewinder-datasource version: 0.2.0
id: simpod-json-datasource version: 0.1.7
id: skydive-datasource version: 1.2.0
id: smartmakers-trafficlight-panel version: 1.0.0
id: sni-pnp-datasource version: 1.0.5
id: sni-thruk-datasource version: 1.0.3
id: snuids-radar-panel version: 1.4.4
id: snuids-trafficlights-panel version: 1.4.5
id: spotify-heroic-datasource version: 0.0.1
id: stagemonitor-elasticsearch-app version: 0.83.2
id: udoprog-heroic-datasource version: 0.1.0
id: vertamedia-clickhouse-datasource version: 1.9.5
id: vertica-grafana-datasource version: 0.1.0
id: vonage-status-panel version: 1.0.9
id: voxter-app version: 0.0.1
id: xginn8-pagerduty-datasource version: 0.2.1
id: yesoreyeram-boomtable-panel version: 1.3.0
id: yesoreyeram-boomtheme-panel version: 0.1.0
id: zuburqan-parity-report-panel version: 1.2.1


Restart grafana after installing plugins . <service grafana-server restart>


[root@localhost grafana]# ./bin/grafana-cli plugins install grafana-polystat-panel
installing grafana-polystat-panel @ 1.1.0
from: https://grafana.com/api/plugins/grafana-polystat-panel/versions/1.1.0/download
into: /var/lib/grafana/plugins
✔ Installed grafana-polystat-panel successfully
PS1:如果是二进制包直接解压安装的,而不是rpm或者yum安装的,那么,你需要修改grafana的配置文件中的插件路径,二进制包中的插件路径默认为grafana根目录下的data/plugins目录下,而grafana-cli命令安装的插件路径位于/var/lib/grafana/plugins/下,修改grafana配置文件,更正插件路径
[root@localhost grafana]# vim /data/prometheus/grafana/conf/defaults.ini
......
# Directory where grafana will automatically scan and look for plugins
#plugins = data/plugins
plugins = /var/lib/grafana/plugins
......


# 重启grafana-server
[root@localhost grafana]# service grafana-server restart
Redirecting to /bin/systemctl restart grafana-server.service
PS2:grafana支持的插件有3种,应用程序插件(App plugin)、数据源插件(Data source plugin)、面板插件(Panel plugin)
应用程序插件:通过自定义的检查方式来扩展Grafana。它包括一组面板和数据源插件,以及自定义页面
数据源插件:扩展了Grafana的数据源,并在Grafana中支持其他数据源
面板插件:使用其他可视化选项扩展了Grafana
2.3. 监控节点部署
2.3.1. 添加主机监控
以添加prometheus主机(这里我们以将所有的监控主机都一并添加)为例进行说明
解压exporter压缩包
[root@localhost ~]# mkdir /data/
[root@localhost ~]# tar xf node_exporter-1.0.0-rc.0.linux-amd64.tar.gz -C /data/
[root@localhost ~]# cd /data/
[root@localhost data]# mv node_exporter-1.0.0-rc.0.linux-amd64 node_exporter
启动node_exporter程序
[root@localhost data]# cd node_exporter
[root@localhost node_exporter]# nohup ./node_exporter --collector.processes --collector.mountstats --collector.interrupts &
配置prometheus主机监控配置列表文件,由于之前主配置文件prometheus.yml 中已经定义了监控主机的配置文件host.yml,这里只需要把主机IP信息填入即可动态生效(注意,在该配置文件的labels的键值对,需要定义哪些值需要参考你加载的dashboard文件而定,具体详见下文)
[root@localhost node_exporter]# cat /data/prometheus/host.yml
- labels:
    node_name: Host-Prometheus
    service_name: Host-Prometheus
  targets:
  - 192.168.2.181
然后,在grafana页面中就可以看到你配置的主机
PS:如果该文件中已经配置过lables且不需要使用独立的labels标签进行标记,则新添加的实例的IP可以直接放在同一个targets下,但这样就无法在dashboard中进行筛选了(旧版本的不添加独立的labels标签是可以使用IP地址进行筛选的),未便于演示,这里我们未每台主机配置独立的labels标签,如下
[root@localhost mysqld_exporter]# cat /data/prometheus/host.yml
- labels:
    node_name: Host-Master
    service_name: Host-Master
  targets:
  - 192.168.2.135
- labels:
    node_name: Host-Slave1
    service_name: Host-Slave1
  targets:
  - 192.168.2.108
- labels:
    node_name: Host-Slave2
    service_name: Host-Slave2
  targets:
  - 192.168.2.156
- labels:
    node_name: Host-Prometheus
    service_name: Host-Prometheus
  targets:
  - 192.168.2.181
添加MySQL监控主机,这里以添加192.168.2.135为例进行说明
解压exporter压缩包
[root@localhost ~]# mkdir /data/
[root@localhost ~]# tar xf mysqld_exporter-0.12.1.linux-amd64.tar.gz -C /data/
[root@localhost ~]# cd /data/
[root@localhost ~]# mv mysqld_exporter-0.12.1.linux-amd64 mysqld_exporter
配置监控数据库需要的主机IP、数据库端口、数据库账号和密码的环境变量
[root@luoxiaobo-01 ~]# export DATA_SOURCE_NAME='admin:letsg0@(192.168.2.135:3306)/'
[root@luoxiaobo-01 ~]# echo "export DATA_SOURCE_NAME='admin:letsg0@(192.168.2.135:3306)/'" >> /etc/profile
启动exporter
# 由于目前最新的版本默认关闭了大量的mysql采集项,需要显式使用相应的选项开启(截止到写稿时间,最新的开发版本可以通过prometheus端的配置项让exporter端生效,而无需再exporter中使用大量的启动选项开启)
[root@localhost ~]# cd mysqld_exporter
[root@localhost mysqld_exporter]# nohup ./mysqld_exporter --collect.auto_increment.columns --collect.info_schema.tables --collect.perf_schema.eventsstatements --collect.perf_schema.eventsstatementssum --collect.perf_schema.eventswaits --collect.perf_schema.file_events --collect.perf_schema.file_instances --collect.perf_schema.indexiowaits --collect.perf_schema.tableiowaits --collect.perf_schema.tablelocks --collect.perf_schema.replication_group_member_stats --collect.perf_schema.replication_applier_status_by_worker --collect.slave_hosts --collect.info_schema.query_response_time --collect.info_schema.processlist --collect.info_schema.innodb_tablespaces --collect.info_schema.innodb_metrics --collect.engine_innodb_status --collect.binlog_size --collect.info_schema.clientstats &
# 注意,新版本的mysqld_exporter可能不支持--collect.info_schema.processlist 选项,请自行使用./mysqld_exporter --help查看
配置prometheus MySQL监控配置列表文件,由于之前主配置文件prometheus.yml 中已经定义了监控MySQL的配置文件mysql.yml,这里只需要把主机IP信息填入即可动态生效
[root@localhost mysqld_exporter]# cat /data/prometheus/mysql.yml
- labels:
    node_name: MySQL-Master
    service_name: MySQL-Master
  targets:
  - 192.168.2.135
- labels:
    node_name: MySQL-Slave1
    service_name: MySQL-Slave1
  targets:
  - 192.168.2.108
- labels:
    node_name: MySQL-Slave2
    service_name: MySQL-Slave2
  targets:
  - 192.168.2.156
- labels:
    node_name: MySQL-Slave3
    service_name: MySQL-Slave3
  targets:
  - 192.168.2.181
然后,在grafana页面中就可以看到你配置的MySQL实例
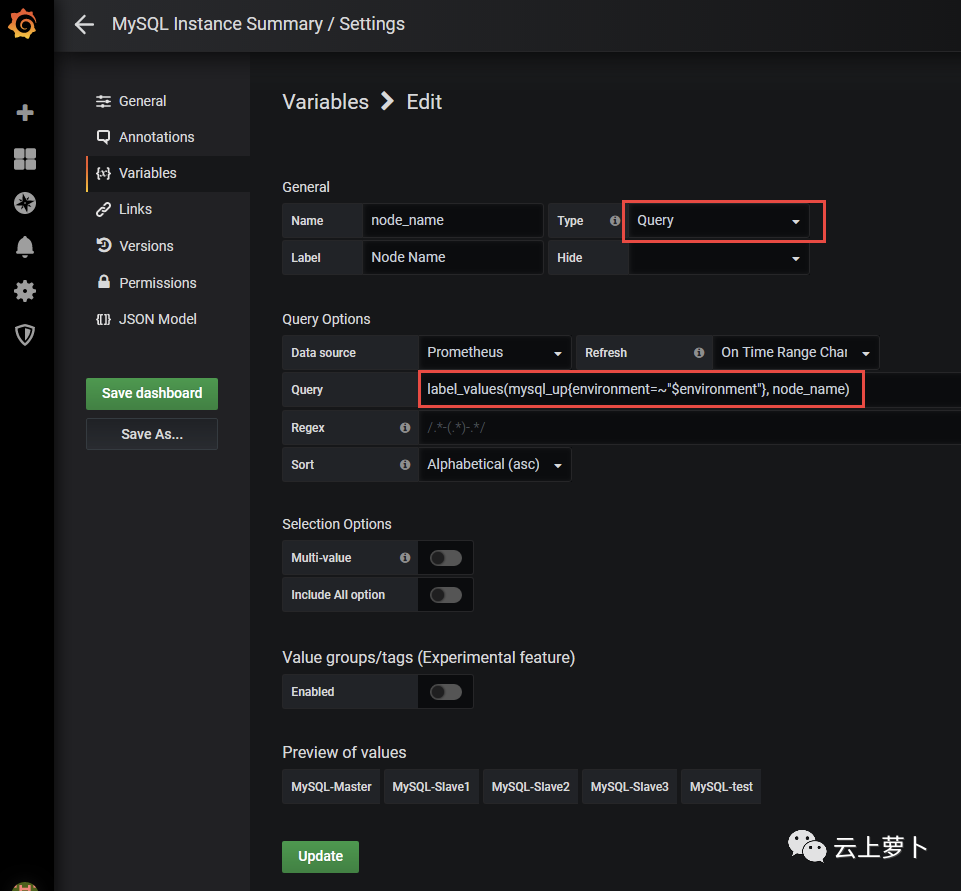
PS:查看dashboard配置文件中的过滤选项,以便在prometheus的yml配置文件中添加对应的labels标签,如下:
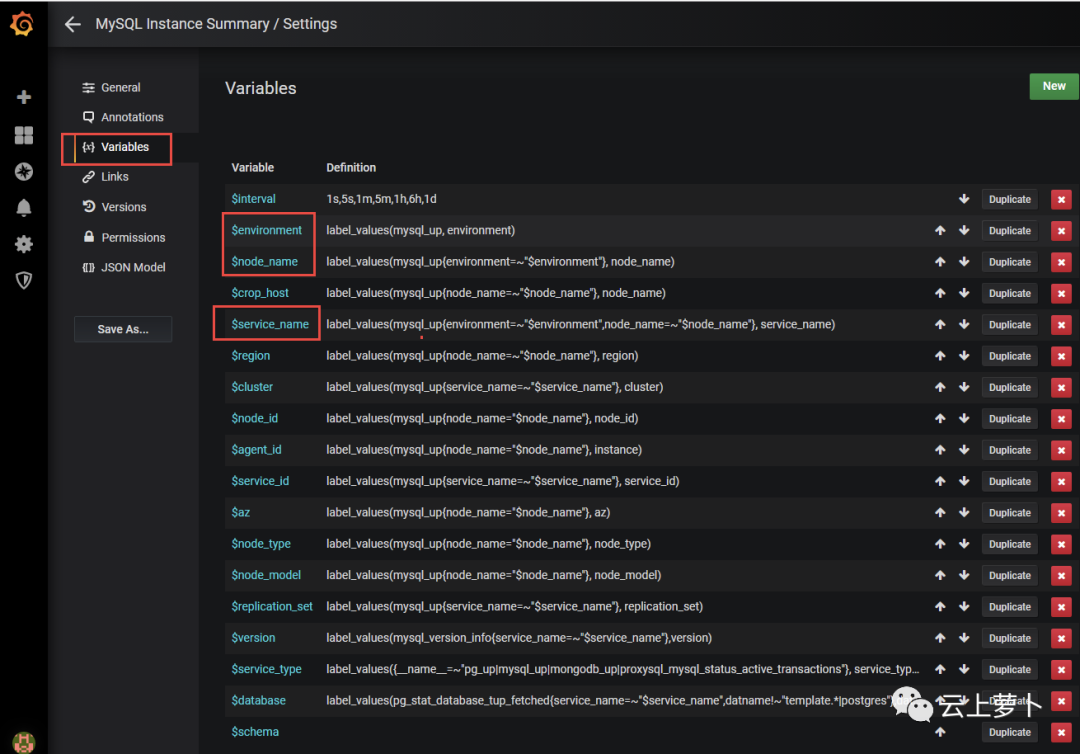
以上这几个variable都是query类型的,根据具体的definition值可以看到,通过环境变量和labels标签值来获取,也就是说,这些就是可用于生成下拉筛选列表的值,我们将其variable名称写入到host.yml和mysql.yml文件中作为label的名称,值自行根据需要取名即可(但是要注意,这些variables是有先后顺序的,如果某一个variables引用了另外一个variables,那么被引用的variables一定要在其之前定义,否则无法使用)。
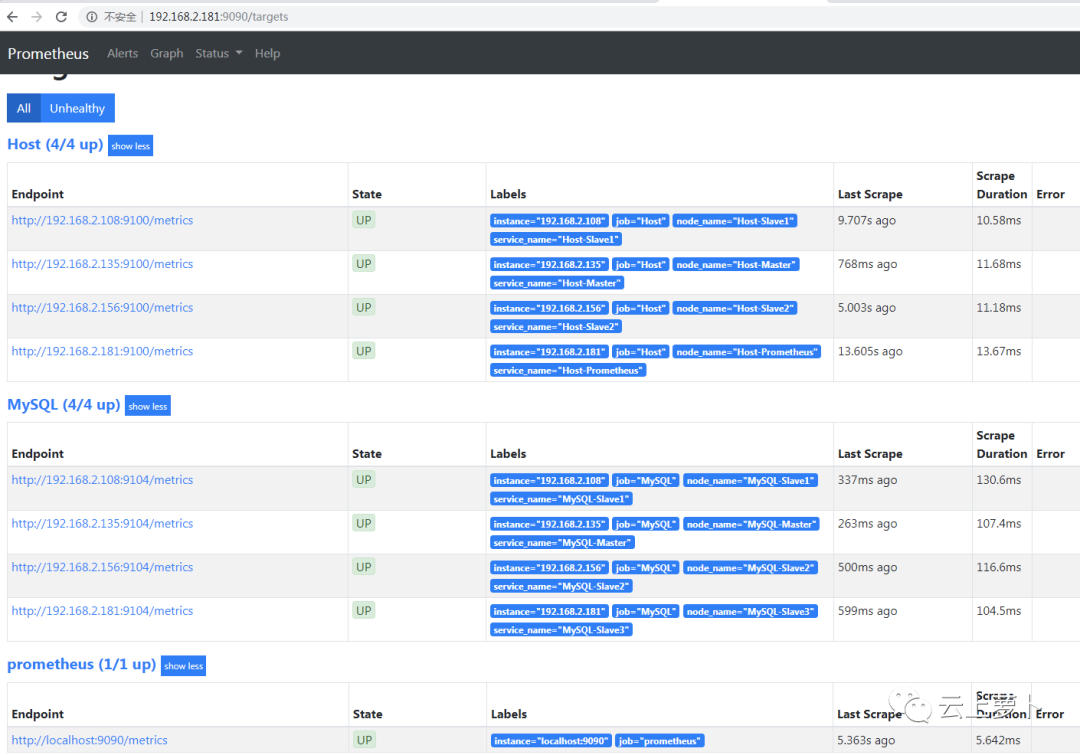
prometheus的targets信息(目标主机)可以通过如下页面进行查看
2.3.3. grafana页面dashboard切换
根据需要切换监控模板
然后,就能看到你想要的数据
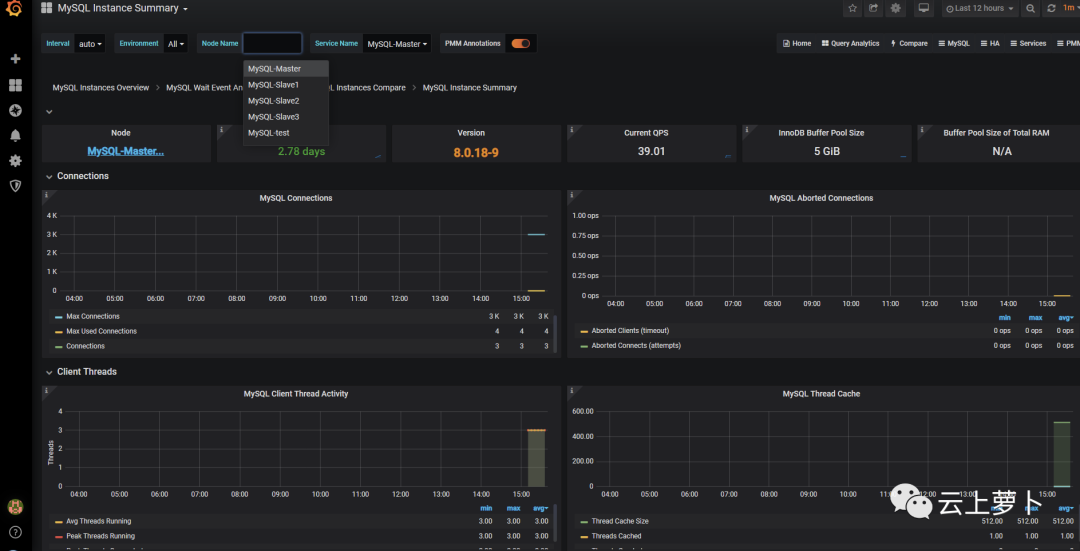
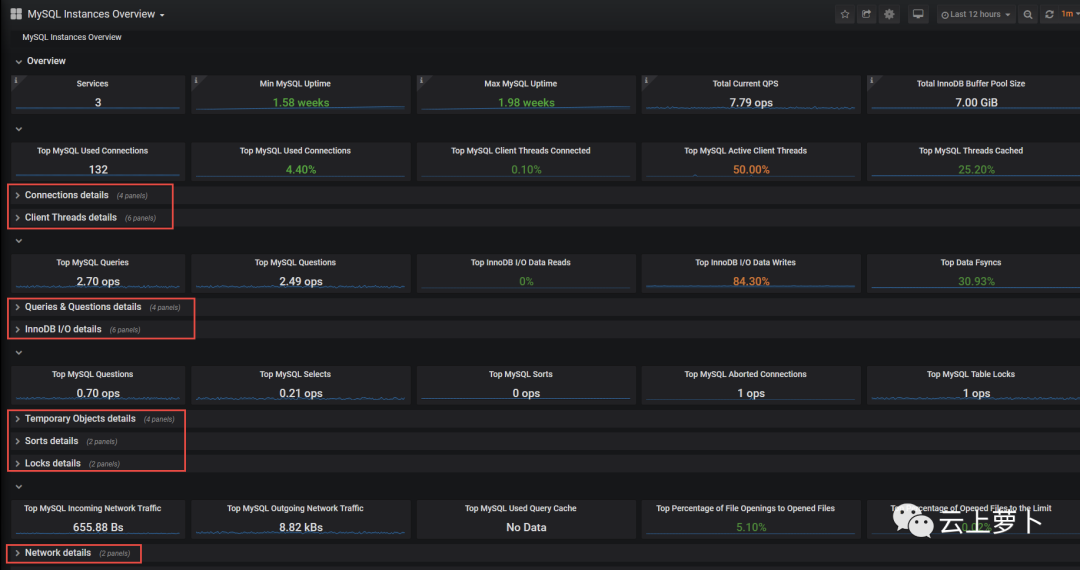
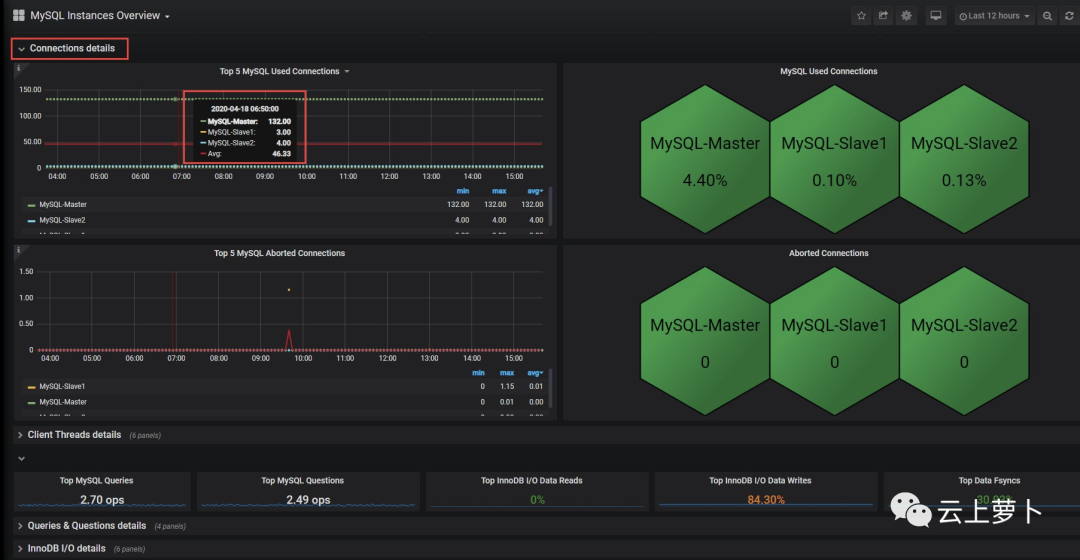
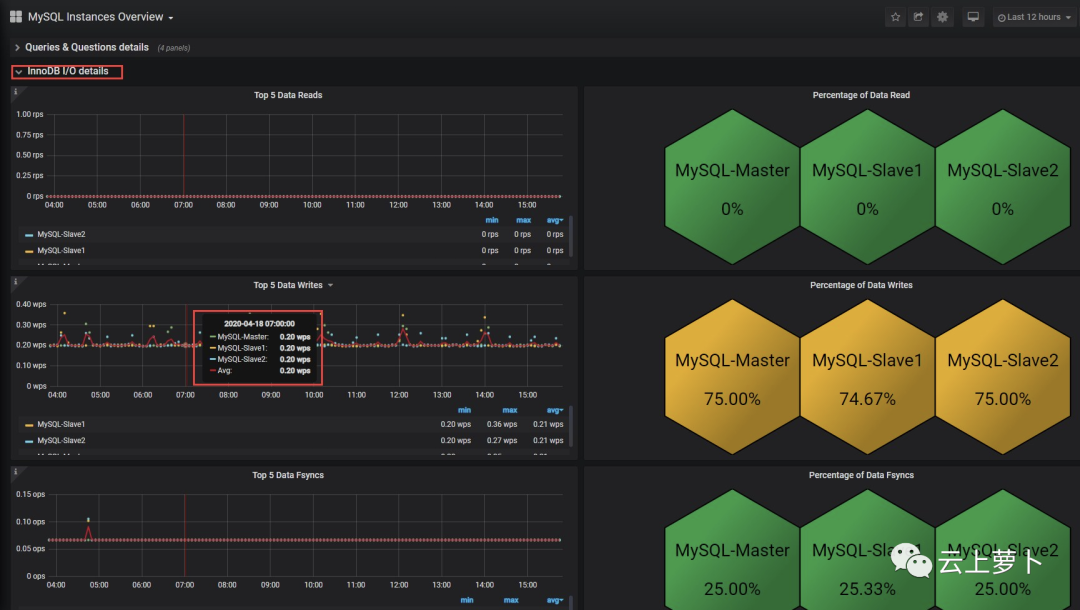
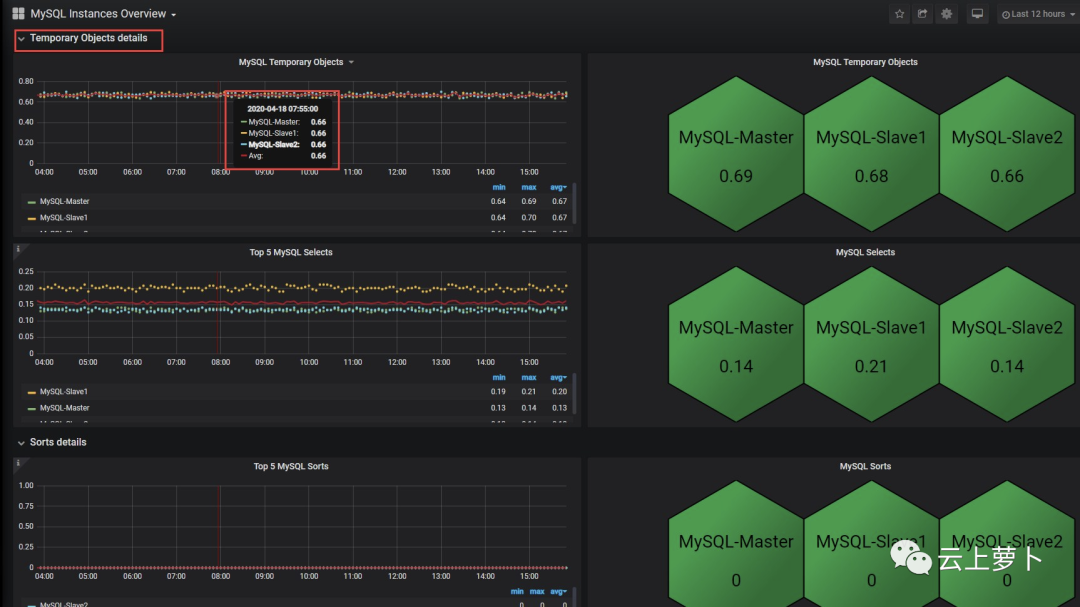
MySQL instances Overview dashboard展示
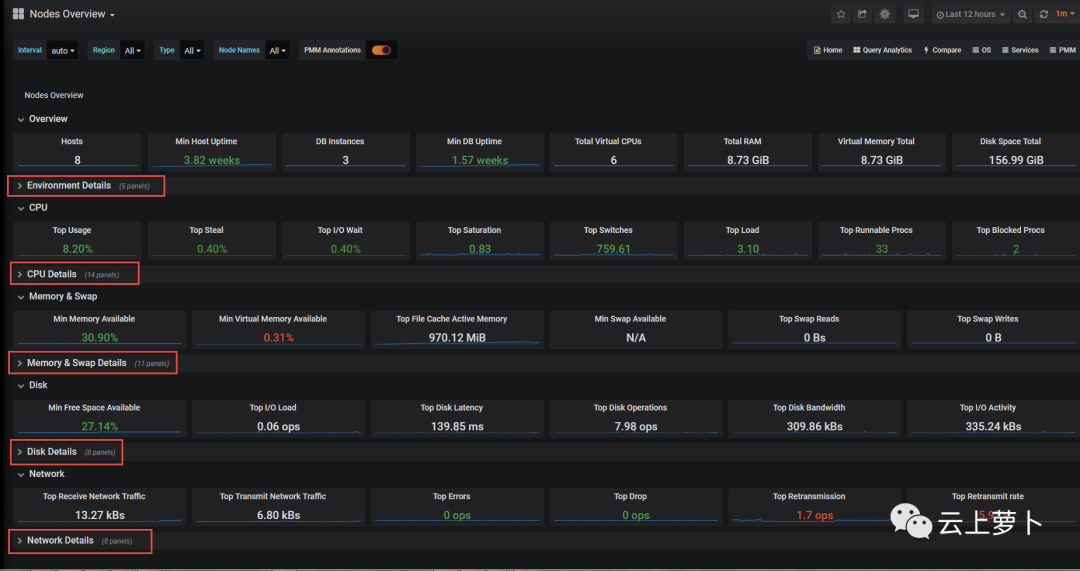
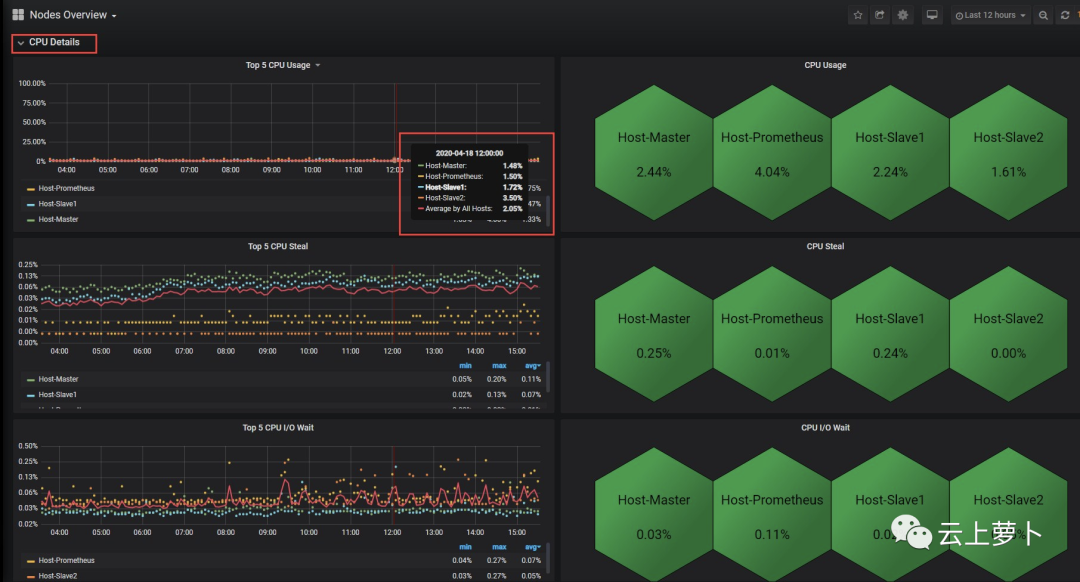
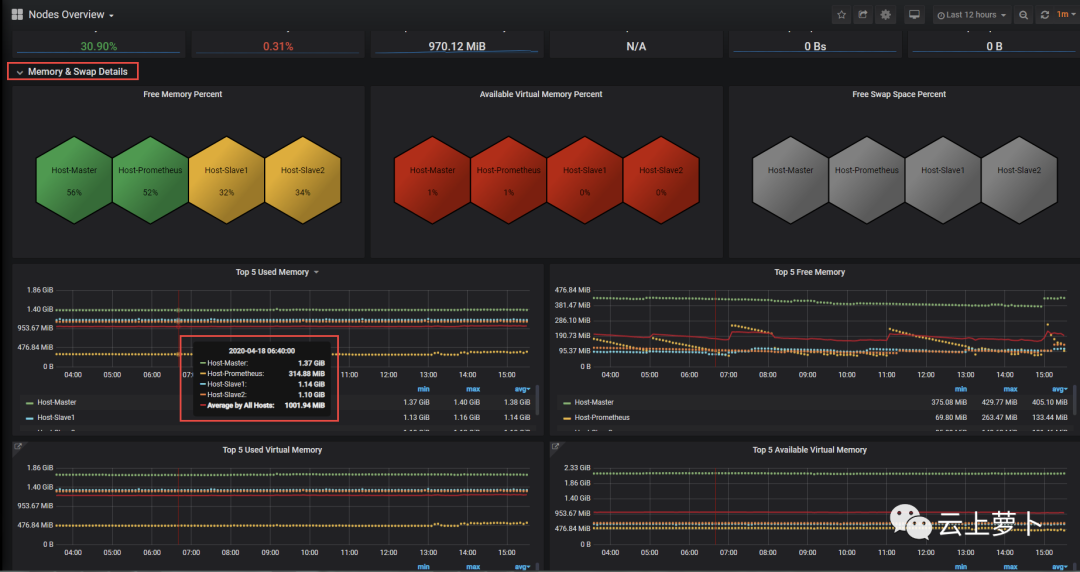
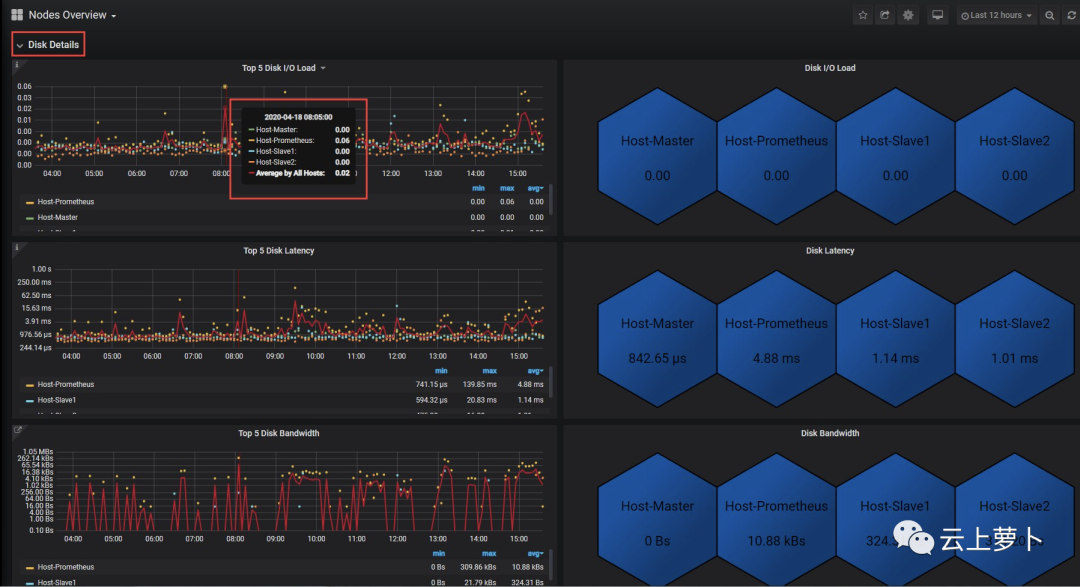
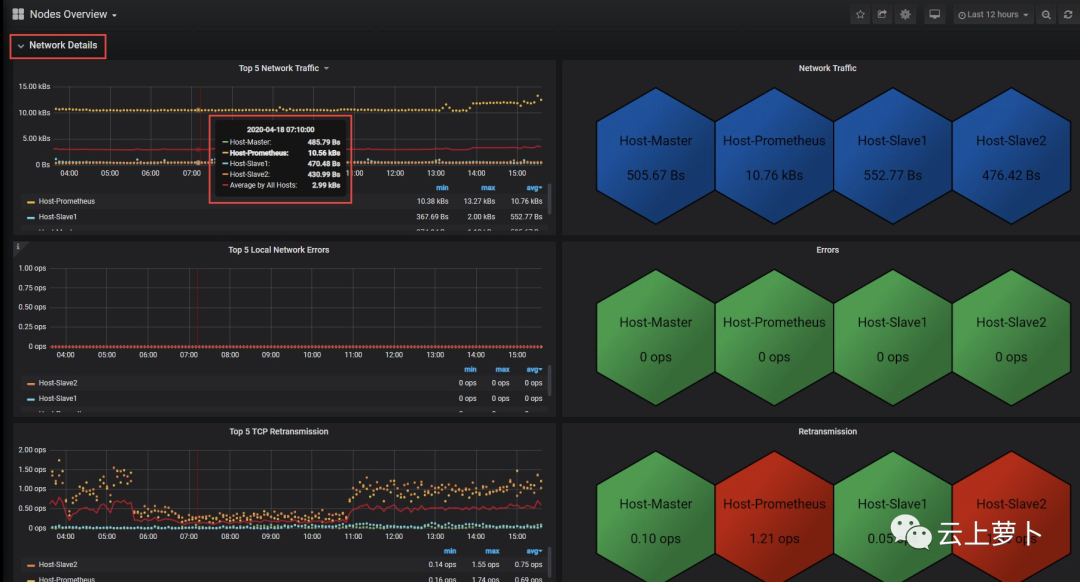
Nodes Overview dashboard展示
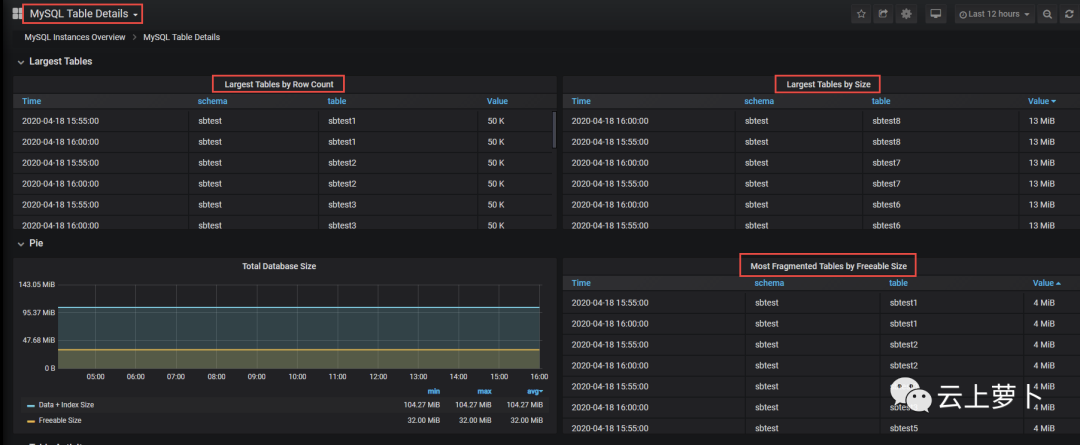
MySQL Table Details dashboard展示
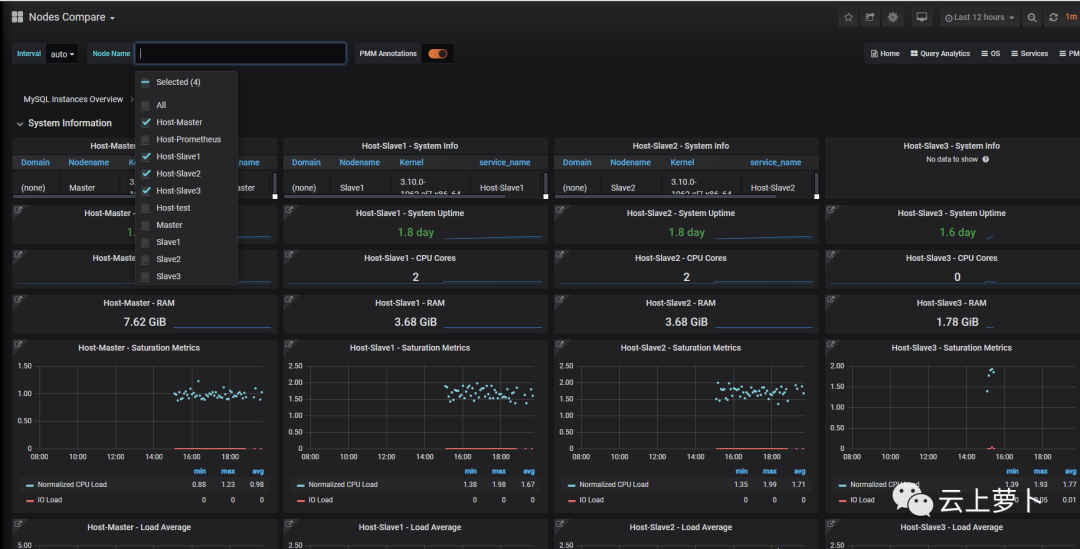
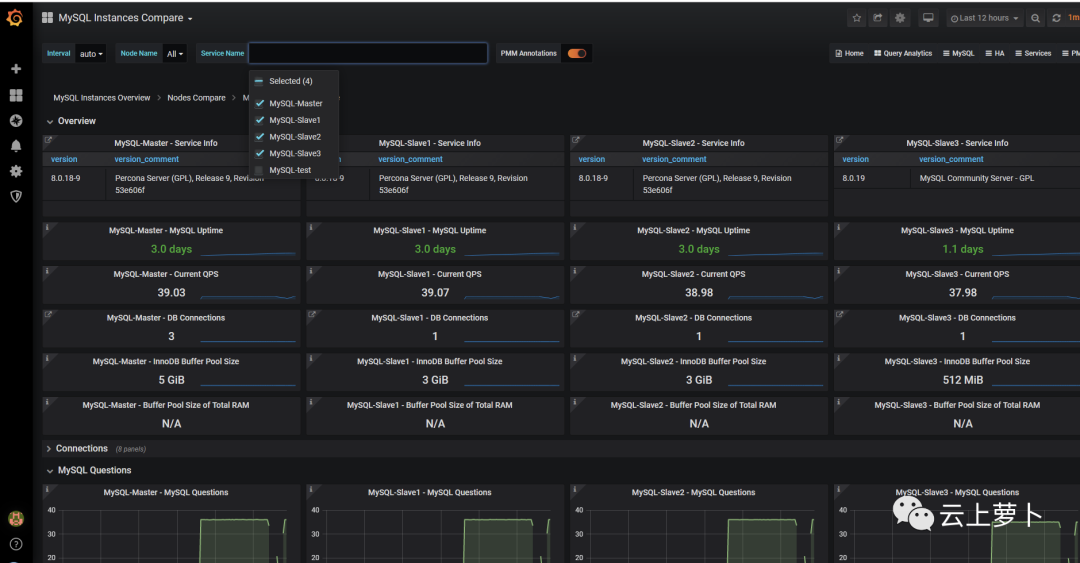
切换到主机和MySQL的比较模板,可以清晰地看到多台监控主机之间的差异
主机比较模板
MySQL 比较模板
2.4. Prometheus采集频率修改
以下以修改MySQL 监控采集频率为例进行说明(注意:有需要才修改,通常不需要修改,修改MySQL的采集间隔可能会影响MySQL实例的性能)
如果不知道如何修改,则可打开如下页面(Prometheus主机,访问链接请对应修改为你的环境中的Prometheus主机IP),查看当前模板中生效的采集频率(scrape_interval和scrape_timeout值)
http://192.168.2.181:9090/config
在prometheus所在服务器中,找到你的prometheus配置文件,类似如下(配置文件的globalIxia的scrape_interval是全局采集的间隔时间,不要修改,找到job_name: MySQL,如果在该标签下未找到scrape_interval,则添加一行信息,并修改为5s)
 [root@localhost ~]# cat /data/prometheus/config/prometheus.yml
# my global config
global:
  scrape_interval:    15s # Set the scrape interval to every 15 seconds. Default is every 1 minute.
  evaluation_interval: 15s # Evaluate rules every 15 seconds. The default is every 1 minute.
  # scrape_timeout is set to the global default (10s).


# A scrape configuration containing exactly one endpoint to scrape:
# Here it's Prometheus itself.
scrape_configs:
- file_sd_configs:
  - files:
    - host.yml
  job_name: Host
  metrics_path: /metrics
  relabel_configs:
  - source_labels: [__address__]
    regex: (.*)
    target_label: instance
    replacement: $1
  - source_labels: [__address__]
    regex: (.*)
    target_label: __address__
    replacement: $1:9100
- file_sd_configs:
  - files:
    - mysql.yml
  job_name: MySQL
  scrape_interval:    5s # 修改MySQL的采集间隔为5s
  scrape_timeout: 5s # 采集超时时间也需要设置,且不能大于采集间隔时间,需要设置为小于等于scrape_interval的值
  metrics_path: /metrics
  relabel_configs:
  - source_labels: [__address__]
    regex: (.*)
    target_label: instance
    replacement: $1
  - source_labels: [__address__]
    regex: (.*)
    target_label: __address__
    replacement: $1:9104


- job_name: prometheus
  static_configs:
  - targets:
    - localhost:9090
重新加载prometheus配置文件
[root@localhost ~]# kill -1 `pgrep prometheus`
然后 ,查看页面中生效的采集时间间隔信息
http://192.168.2.181:9090/config
PS:经测试,发现grafana并不能展示低于15s的展示频率,所以要展示低于15秒一次的采集数据,可能需要使用prometheus提供的API自己去获取数据
2.5. 配置监控告警
采用alertmanager组件
2.5.1. 安装alertmanager
解压alertmanager包
[root@Slave3 ~]# tar xf alertmanager-0.20.0.linux-amd64.tar.gz -C /data/prometheus/
[root@Slave3 ~]# cd /data/prometheus/
[root@Slave3 prometheus]# mv alertmanager-0.20.0.linux-amd64/ alertmanager
使用默认的配置文件启动
[root@Slave3 alertmanager]# nohup ./alertmanager --config.file=alertmanager.yml &
......
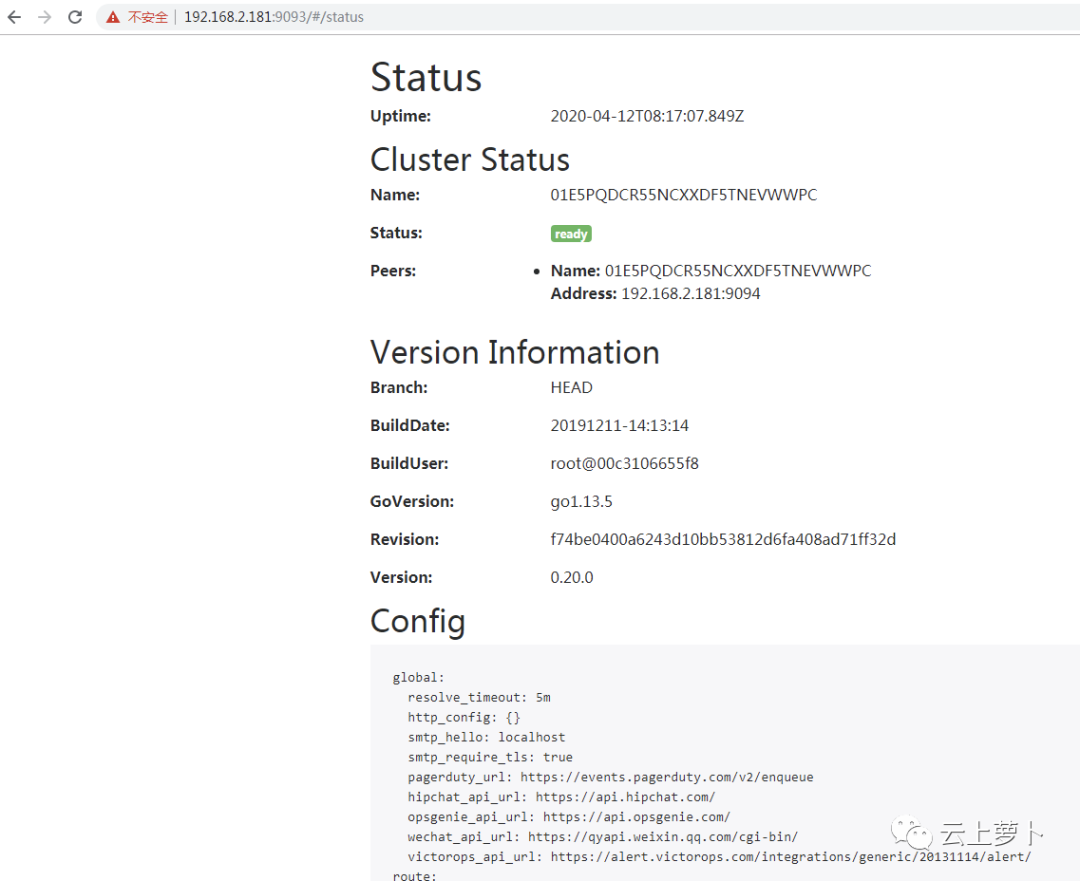
启动之后,可以通过如下链接查看监控节点的状态以及告警项等信息
http://192.168.2.181:9093
修改prometheus的配置文件,添加alertmanager的配置信息,添加到global配置段之后,scrape_configs配置段之前,如下
[root@Slave3 alertmanager]# cat /data/prometheus/prometheus.yml
global:
  scrape_interval: 15s # Set the scrape interval to every 15 seconds. Default is every 1 minute.
  evaluation_interval: 15s # Evaluate rules every 15 seconds. The default is every 1 minute.
  # scrape_timeout is set to the global default (10s).


alerting:
  alertmanagers:
  - static_configs:
    - targets:
       - 192.168.2.181:9093


rule_files:
   - "first_rules.yml"
  # - "second_rules.yml"


# A scrape configuration containing exactly one endpoint to scrape:
# Here it's Prometheus itself.
scrape_configs:
......
添加告警规则文件,这里以添加一个监控node_exporter进程的存活为例
[root@Slave3 alertmanager]# cat /data/prometheus/first_rules.yml
groups:
- name: test_alert_up
  rules:
  - alert: node_time:sum:error
    expr: up < 1
    labels:
      severity: warnging
      action: text
      kind: node_export
    annotations:
      summary: not up
      last: "{{ $value }}"
重启prometheus服务
[root@Slave3 alertmanager]# service prometheus status
Redirecting to /bin/systemctl status prometheus.service
alertmanager模块还支持集群化部署,避免单点故障而无法及时发出告警,关于集群化部署,可参考链接:https://blog.csdn.net/u014686399/article/details/88902340
2.6. 自定义dashboard
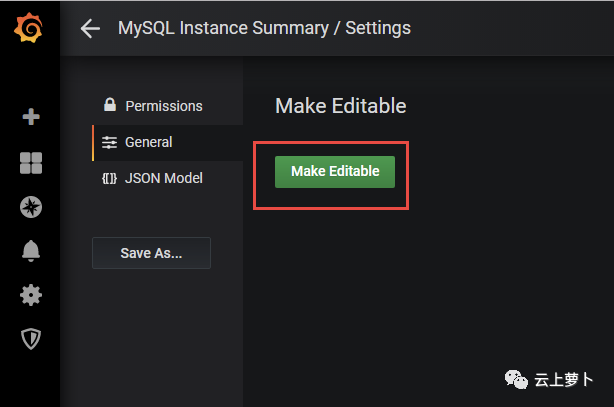
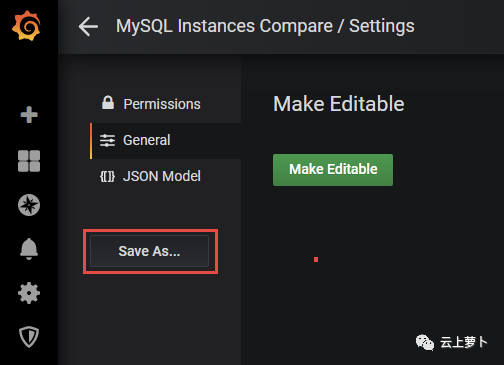
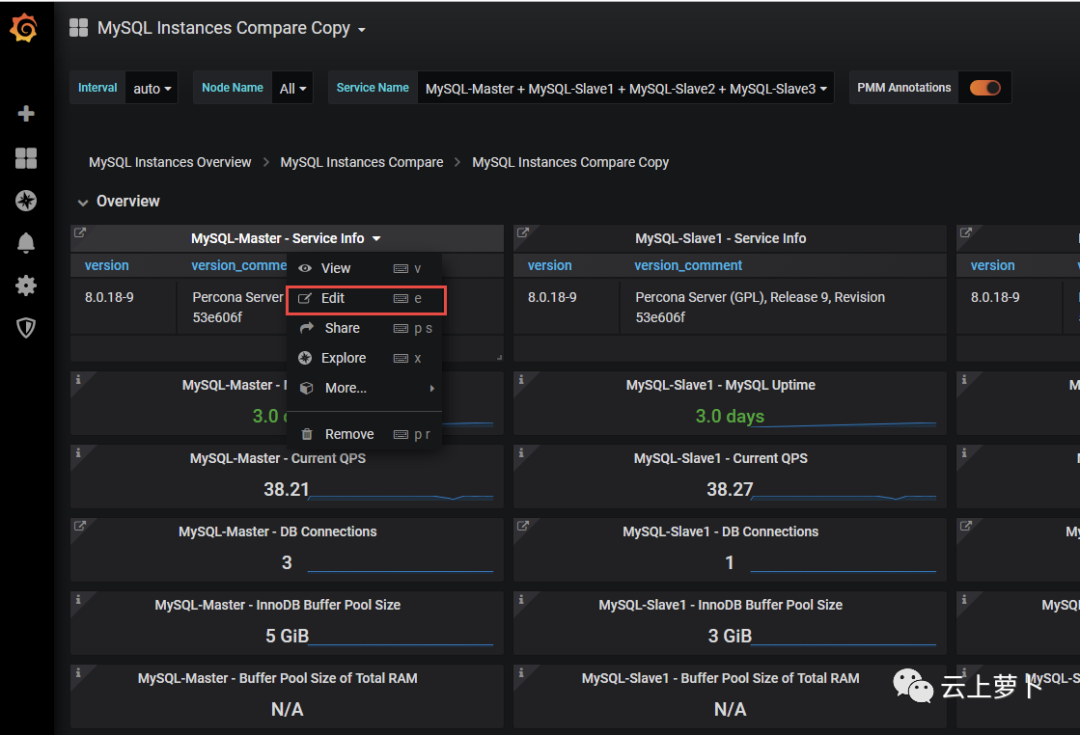
在grafana页面,可以自定义dashboard,将自己关心的监控指标自定义一个仪表盘,并设置好每一个告警项的样式、相应的告警阀值等,非常灵活,有兴趣的童鞋可自行研究,不过,这里特别说明一点,自己纯手工拼凑一个dashboard繁琐不说,而且学习成本非常高,通常,grafana-dashboard包中自带的dashboard模板导入之后是只读权限,但是我们可以对这些模板进行拷贝(也可以通过模板设置界面添加具有编辑或管理权限的账号,就可以对模板进行编辑,但是通常不建议这么做,因为在有编辑权限的用户下,很容易误操作误修改),拷贝的副本是可以自由编辑的,如下
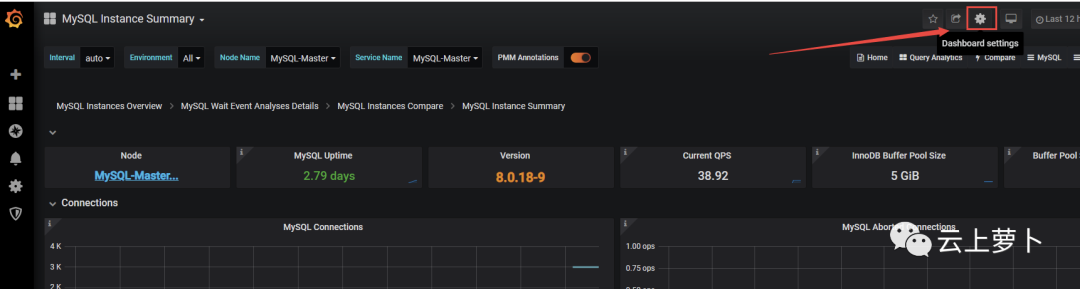
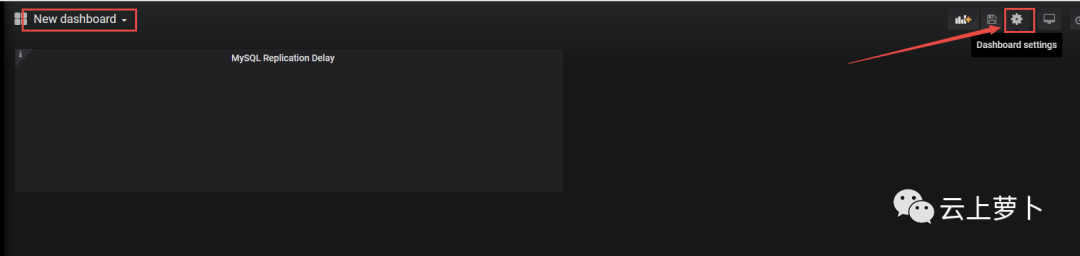
切换到你想要抄袭的dashboard模板,然后点击右上角的"Dashboard settings"按钮
点击左侧的"Save as..."按钮
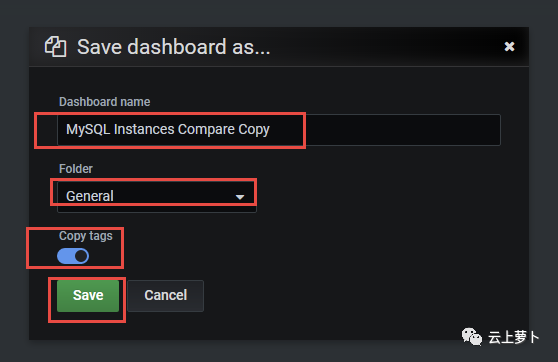
然后,在弹出的文本框中输入一个dashboard名字
然后,切换到你拷贝的dashboard模板中,你会发现,dashboard中的所有元素都可以自由修改了
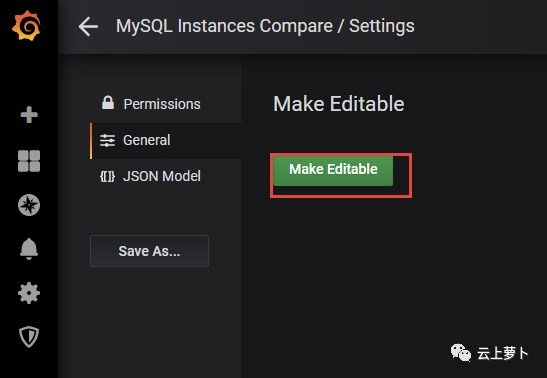
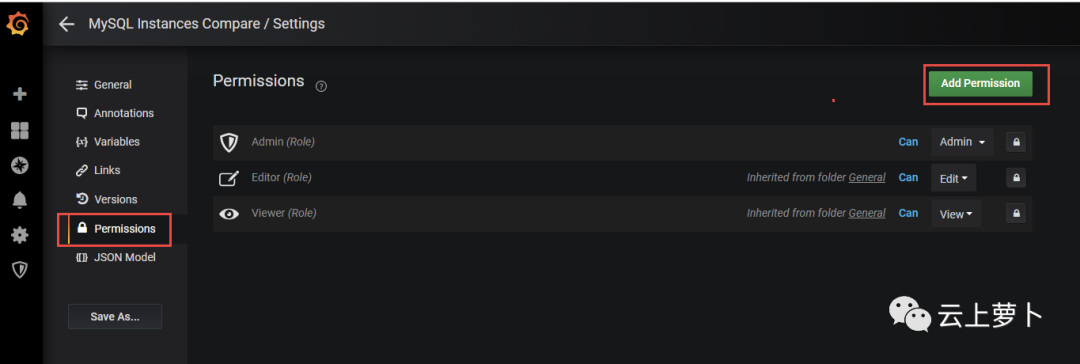
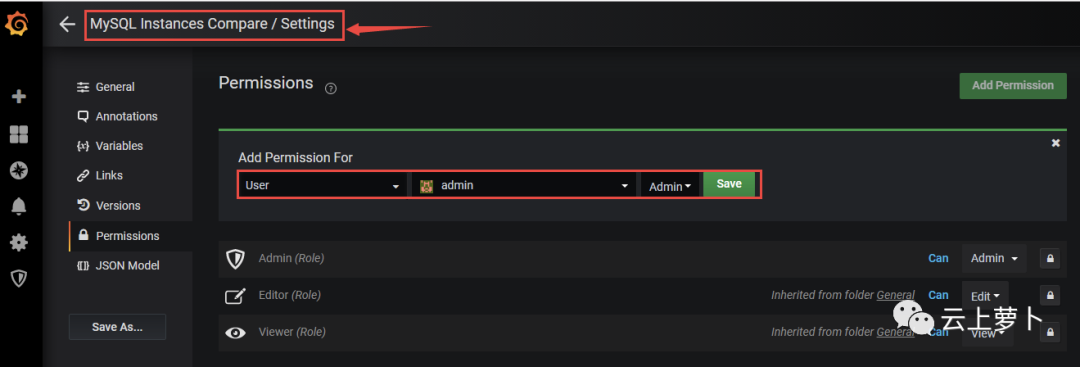
如果你确实需要直接编辑dashboard,那么,可以按照如下步骤添加一个具有编辑或者管理权限的账号,然后退出设置界面,你就会发现,可以对模板进行编辑了
如果你想自定义dashboard,且只需要提取某几个dashboard中的少数监控项面板,并设置页面告警列表(注意,这里不是邮件告警,而是页面告警),那么,可以直接从其他dashboard模板中拷贝看中的监控项面板,直接导入自定义dashboard里即可,下面以设置从库复制延迟为例进行说明:
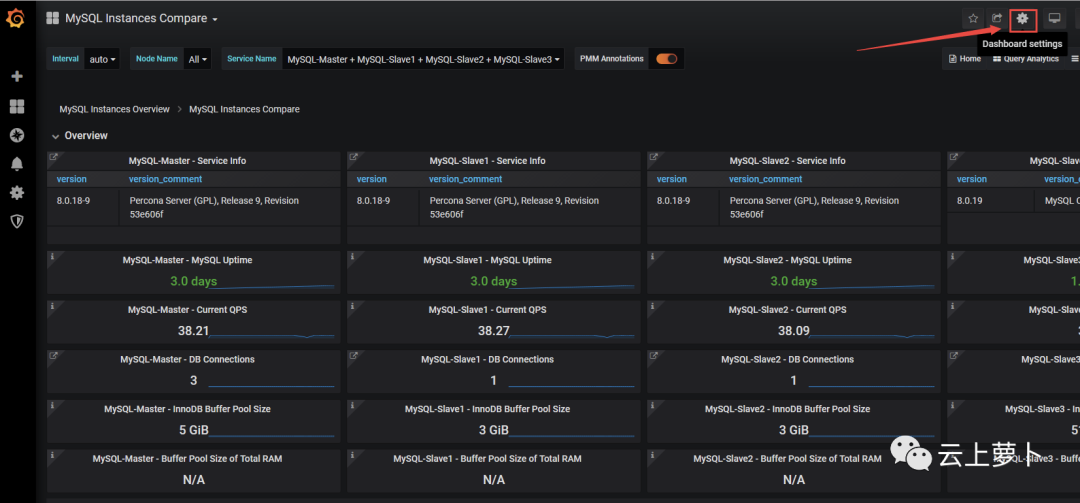
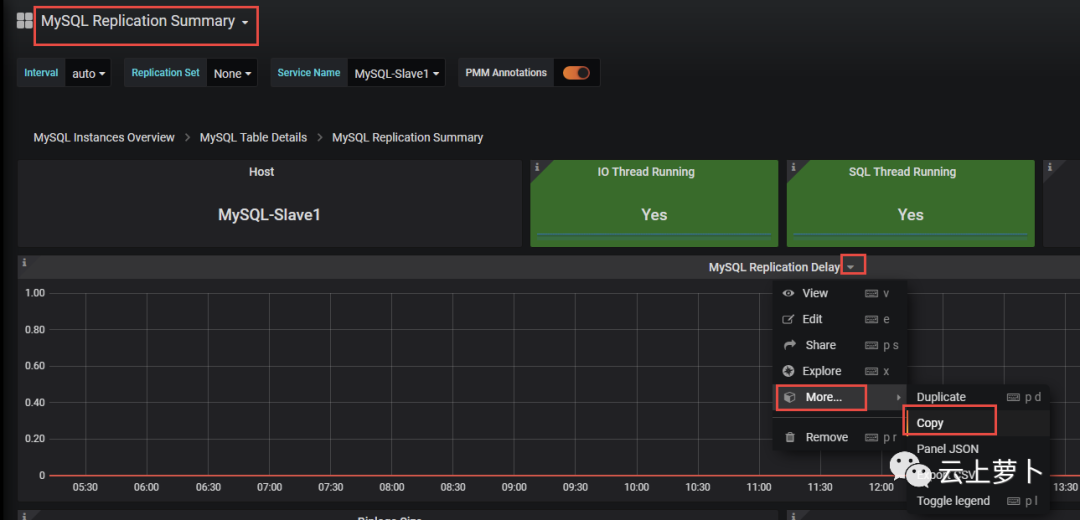
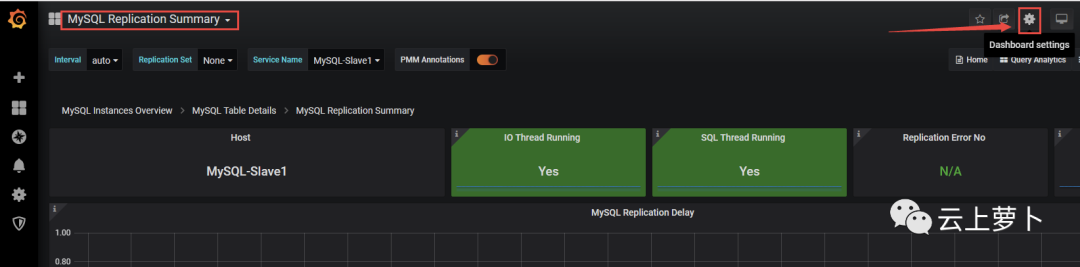
现在切换到MySQL Replication Summary dashboard(需要先按照PS1里介绍的方法完整拷贝其他模板或者添加编辑权限),点击如图所示MySQL Replication Delay监控项面板标题旁边的"倒三角"图标,选择"more",点击"Copy"
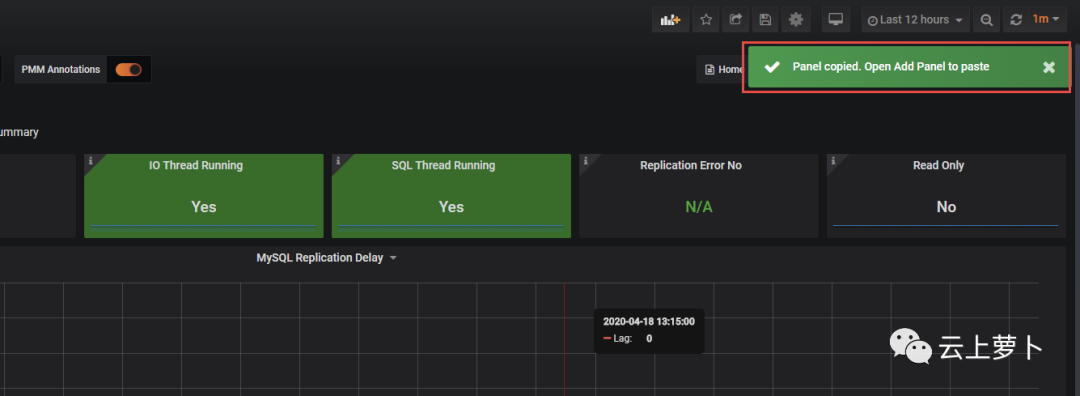
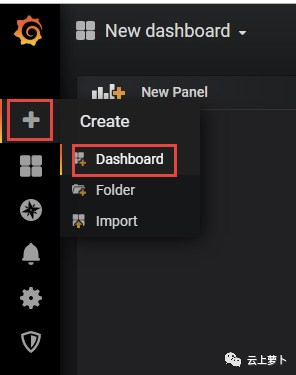
copy成功时能看到提示信息,这个时候,就可以创建自定义dashboard了,按照下图标记处操作(当然,如果你没有编辑或管理权限,那么,在上一步骤的more中点击"Panel JSON",在弹出的文本框中复制下所有的JSON文本,然后,粘贴到你自定义的dashboard的"JSON Model"标签页中的代码段的Panels标签下,注意,要针贴到中括号中,多个监控项的panel json之间要用逗号分割 )
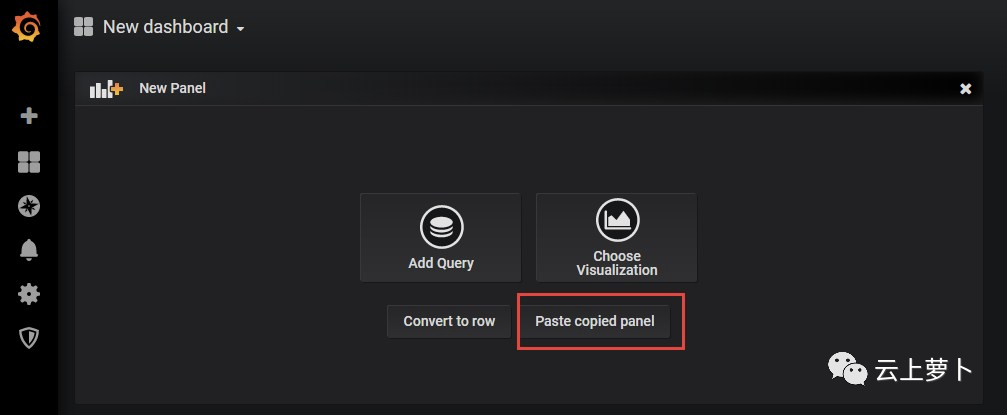
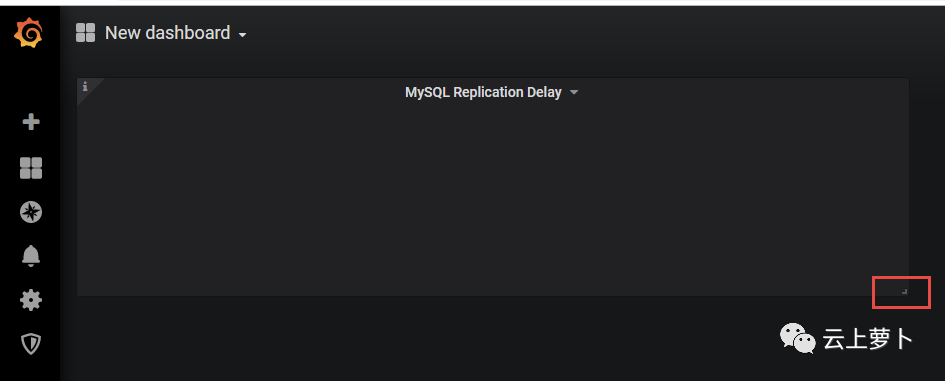
现在,面板没有任何东西,一块白板(窗口可以在鼠标指向面板时通过右下角的小符号拖动调整)
现在,我们还要在dashboard settings面板中拷贝一些variables设置才能够查询到数据
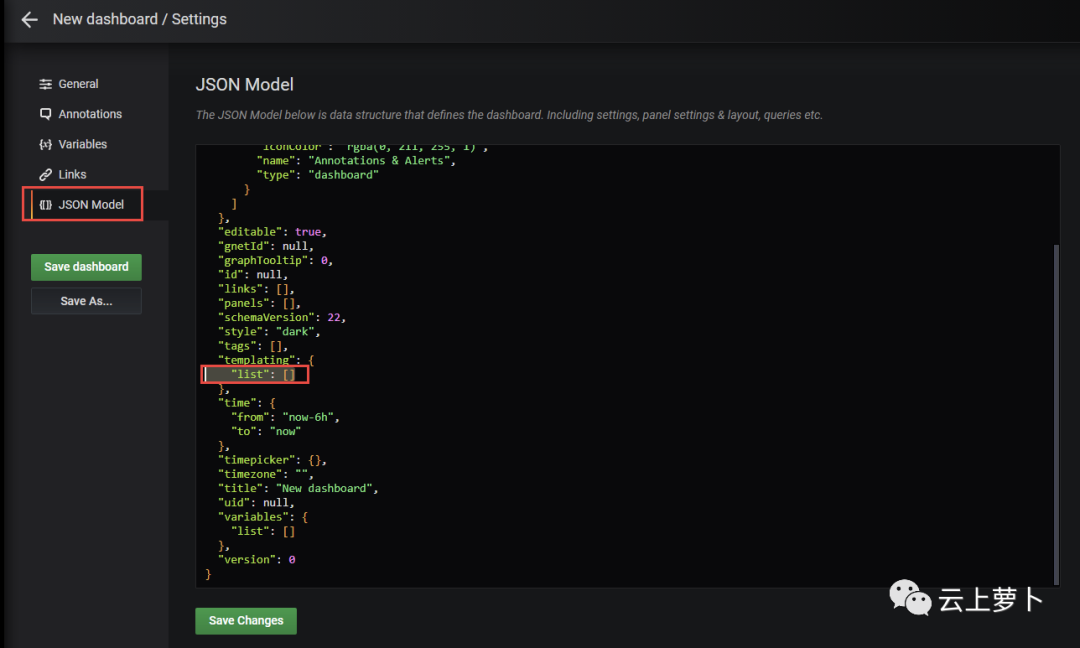
在跳转的窗口中,点击"JSON Model",将其中的templating部分全部copy(templating)
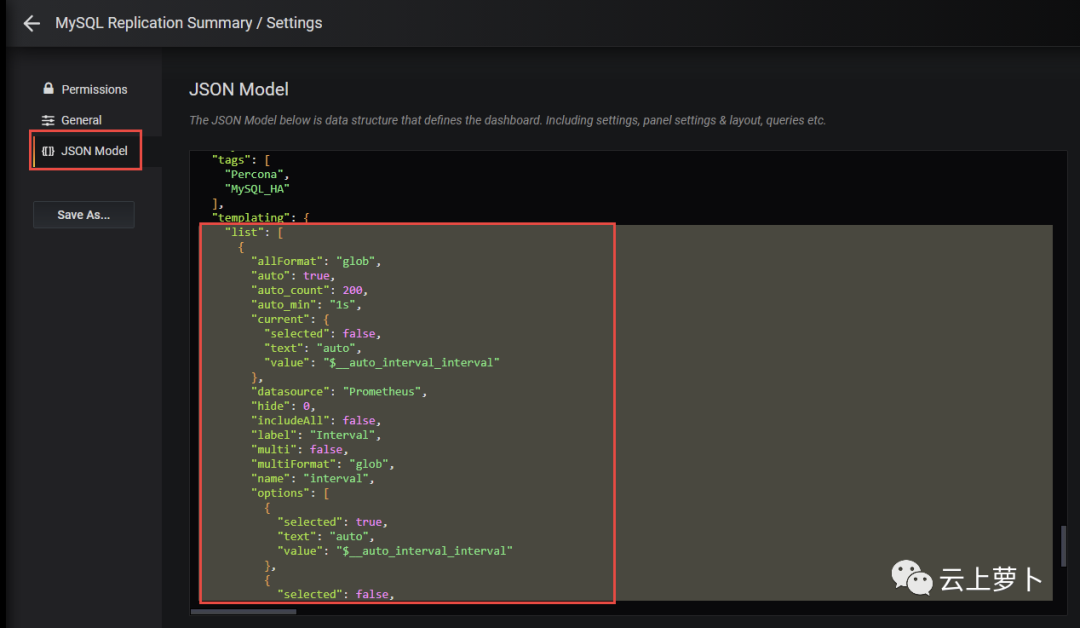
粘贴到自定义的dashboard settings的JSON Model窗口中的templating花括号下,然后点击下方的"Save Changes"按钮
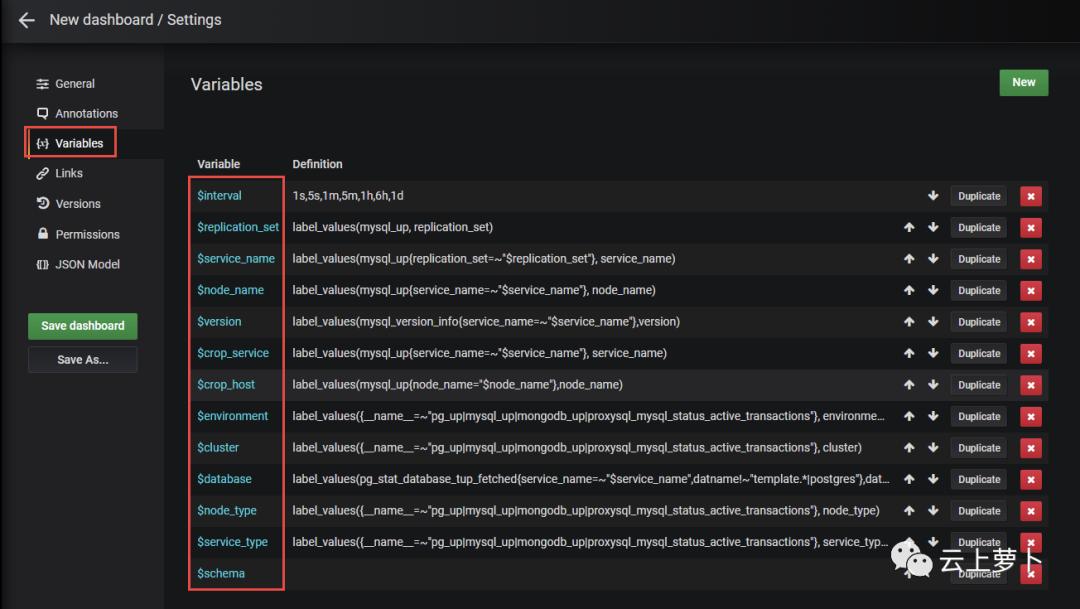
然后,在Variables标签页下就可以看到一堆variables了,而且,刚添加的复制延迟监控项的面板也有数据了,而且,下拉列表也有了(除了直接拷贝json代码之外,你当然也可以对照着其他模板的每一个variables,一个一个手工照着配置,只是比较麻烦)
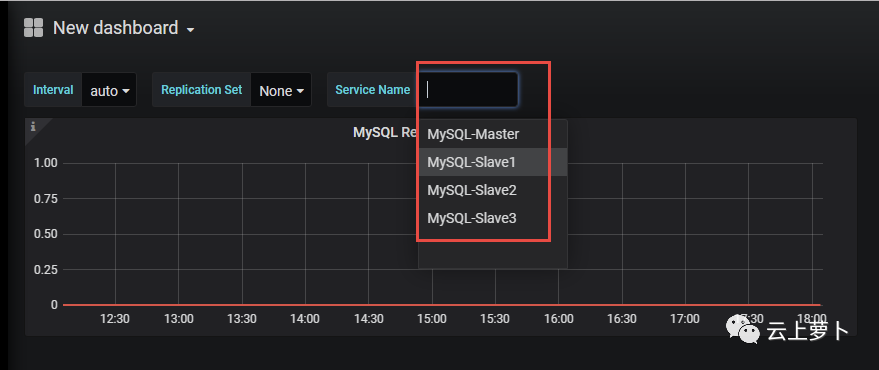
现在,我们调整一下该面板的一些属性,如下图,Metrics输入框中的2个花括号删除,时期不安列表切换,所有监控数据库在一个面板中可以看到
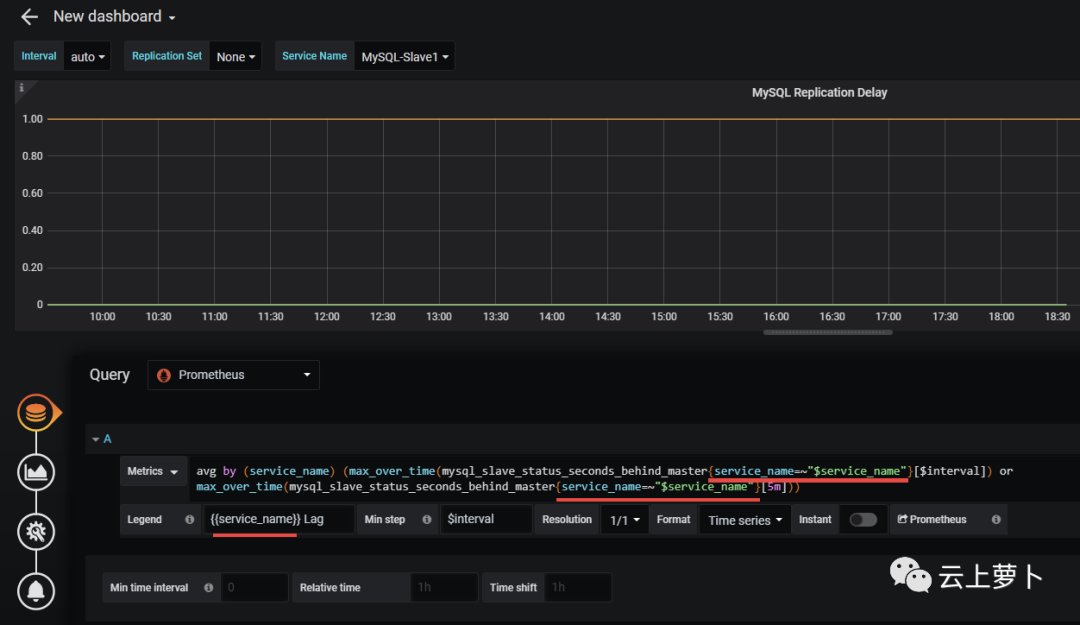
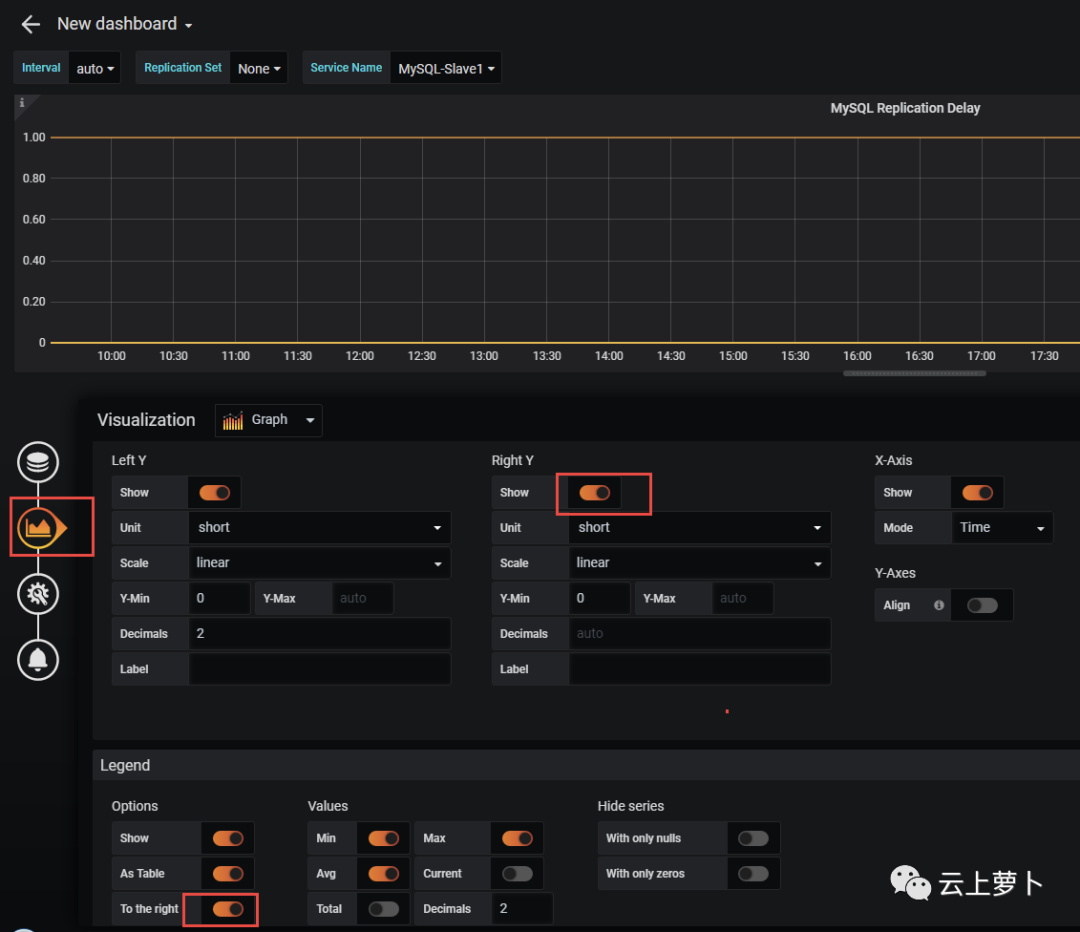
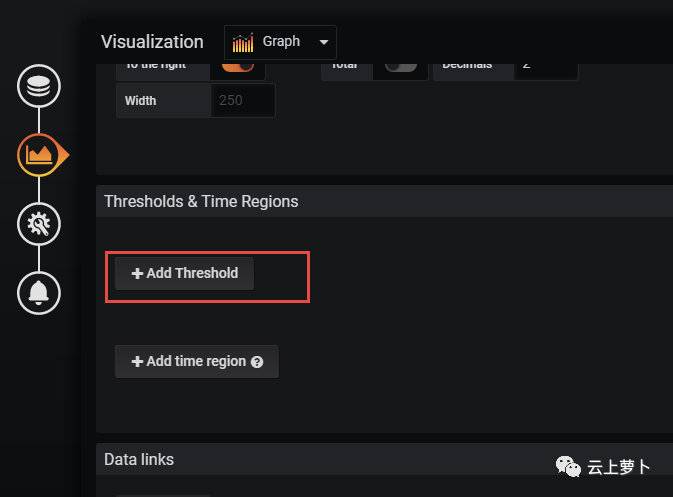
现在,我们为这个面板添加一个页面视觉阀值(Visual thresholds,即,相当于可以直接肉眼观察的一个阀值水位线)
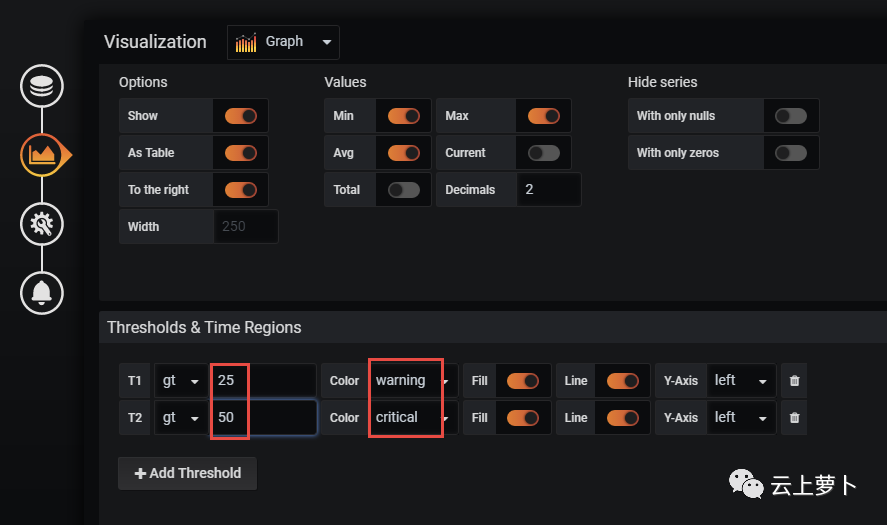
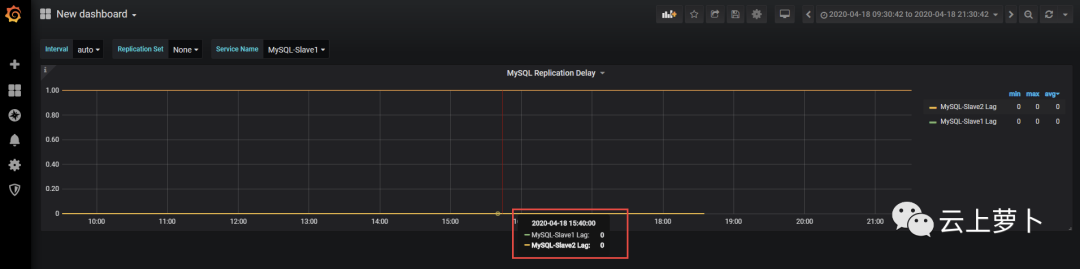
设置完成之后,我们回到dashboard,可以看到如下效果
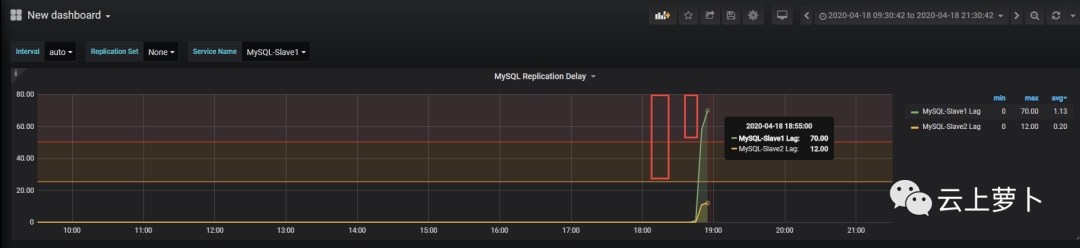
现在,我们对主库使用sysbench 1.0版本加一些写压力(oltp_write_only),持续几分钟之后观察效果,如下图,可以看到,MySQL-Slave1超过了严重级别的告警线,MySQL-Slave2超过了警告级别的告警线
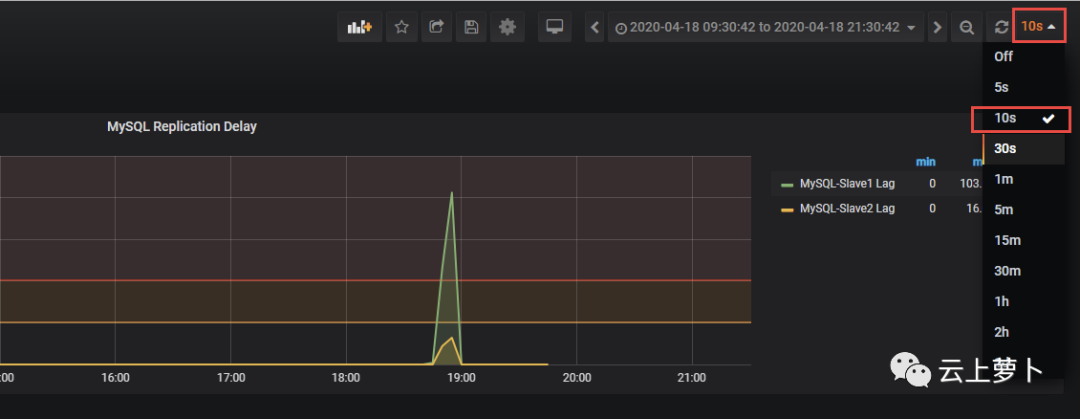
如果你的在面板中看到的数值很久没动静,那么很可能是你的刷新间隔被关掉了,可以通过右上角的下拉列表进行调整
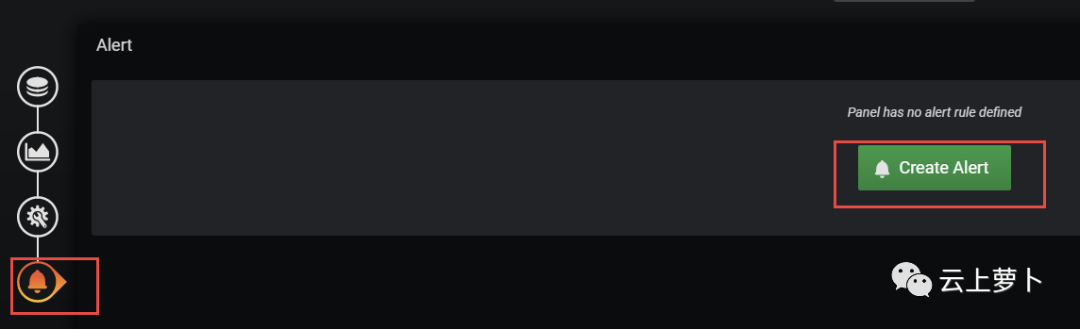
到这里,dashboard的面板中直接配置视觉阀值线完结,除此之外,我们还可以单独配置一个告警列表面板,但是,由于监控复制延迟的面板配置中使用了模板中的变量,因此不支持alert列表,它与视觉阀值是互斥的。这里不再赘述,如果有需要的童鞋请自行研究(如果某个监控项的面板可以配置alert,则可以看到类似如下按钮)
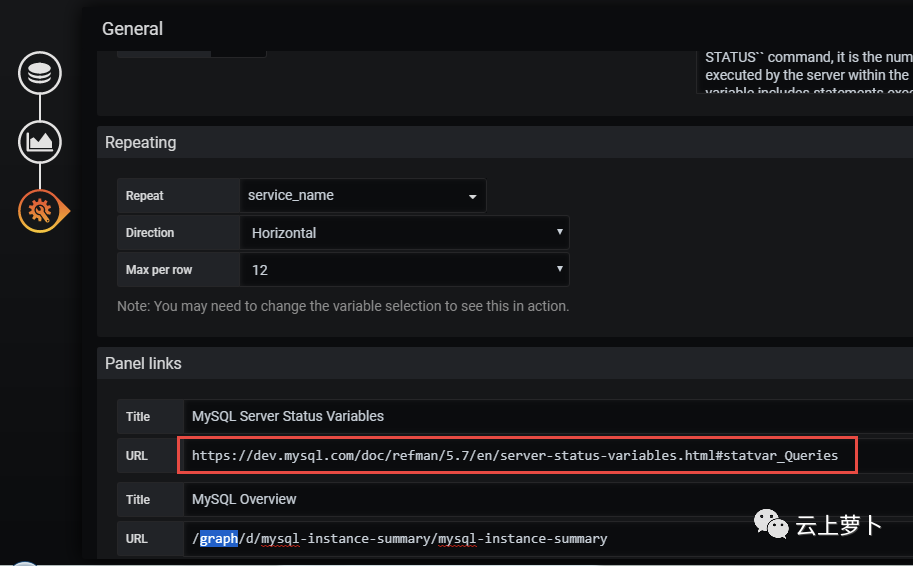
PS1:如果你想要查看某个监控指标是采集的什么值,那么可以查看URL信息,通常一个外网的链接就是真实的,如果是一个内部URL,可能无法查看有效信息
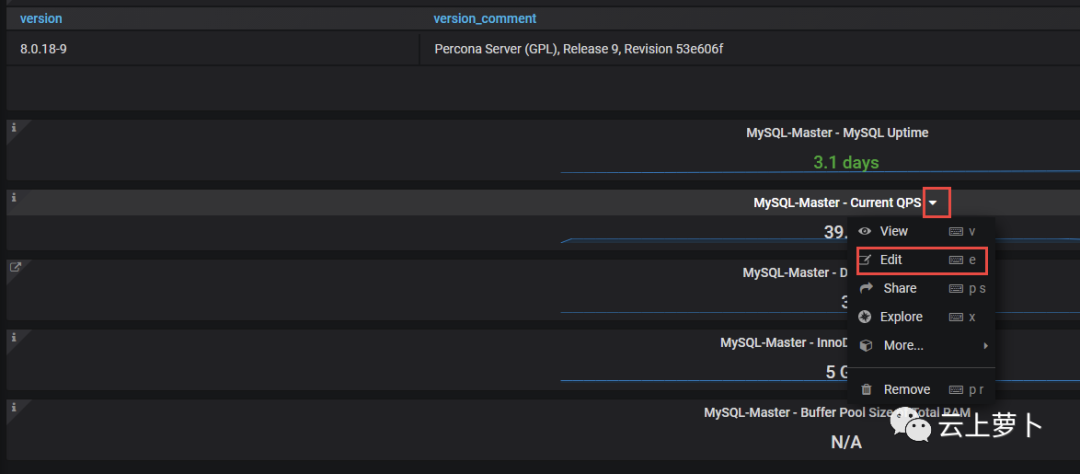
通常将鼠标指向左侧的"i"图标,就能看到弹出一个蓝色框,点击下方的链接就可以进行跳转,需要注意的是,这些链接有些是外部链接,有些是内部链接
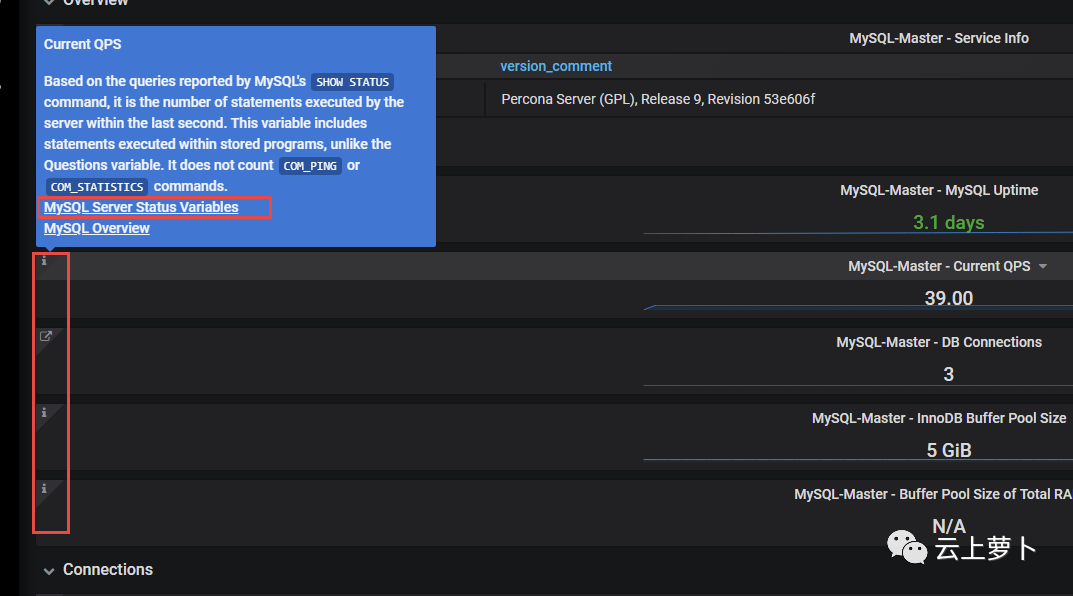
进入编辑模式,就能看到具体的URL,带https开头的都是外部的,带/graph开头的就是内部链接,只有外部链接能正常跳转,内部链接通常不能用
PS2:
关于单机多实例部署MySQL的监控,可参考"沃趣技术"微信公众号中的 "prometheus配置监控多个MySQL实例"
更多关于配置邮件告警的步骤,可参考"沃趣技术"微信公众号中的 "prometheus配置MySQL邮件报警配置"
更多关于prometheus的原理和架构,可参考"沃趣技术"微信公众号中的"开源监控系统Prometheus的前世今生"
参考链接:
https://prometheus.io/docs/
https://grafana.com/docs/
https://www.cnblogs.com/biaopei/p/12096705.html
zabbix + grafana:https://cloud.tencent.com/developer/article/1352735
全文完。
由叶老师主讲的知数堂「MySQL优化课」课程从第15期就升级到MySQL 8.0版本了,现在上车刚刚好,扫码开启MySQL 8.0的修行之旅吧。

另外,叶老师在腾讯课堂《MySQL性能优化》精编版第一期已完结,本课程讲解读几个MySQL性能优化的核心要素:合理利用索引,降低锁影响,提高事务并发度。
下面是自动拼团的二维码,组团价仅需78元


 950
950

 被折叠的 条评论
为什么被折叠?
被折叠的 条评论
为什么被折叠?
 到【灌水乐园】发言


