


本文是我自己在Macbook上本地从零开始搭建一套MySQL监控平台,监控的也是我本机的MySQL,过程包括prometheus、mysql_exporter、Grafana的配置与下载。
一、软件安装
我是根据Mac挑选的如下版本下载:
| OS | Arch |
|---|---|
| darwin | amd64 |
prometheus: 普罗米修斯是一个监控工具,以时间为单位展示指定数据维度的变化趋势。
Download | Prometheus->prometheus->prometheus-2.43.0.darwin-amd64.tar.gz
mysql_exporter:mysql数据采集器
Download | Prometheus->mysqld_exporter->mysqld_exporter-0.15.0-rc.0.darwin-amd64.tar.gz
Grafana:可视化展示的监控软件,支持多种仪表盘
Download Grafana | Grafana Labs-> Mac
二、 软件配置
配置mysql_exporter
-
进入上面mysqld_exporter-0.15.0-rc.0.darwin-amd64解压的目录中,
touch my.cnf创建配置文件 -
进行my.cnf文件配置
输入想要采集数据的登陆用户信息,即本地数据库信息
[client] # mysql用户名 user=xxxxx #mysql的密码 password=xxxxx #主机地址 host=localhost # mysql端口号 prot=3306 -
启动mysql-exporter
./mysqld_exporter --config.my-cnf=./my.cnf -
本地浏览器访问端口9104监控页面
http://localhost:9104/显示如下,则成功,但是这亮橙色,真的很容易让人认为报错了orz:
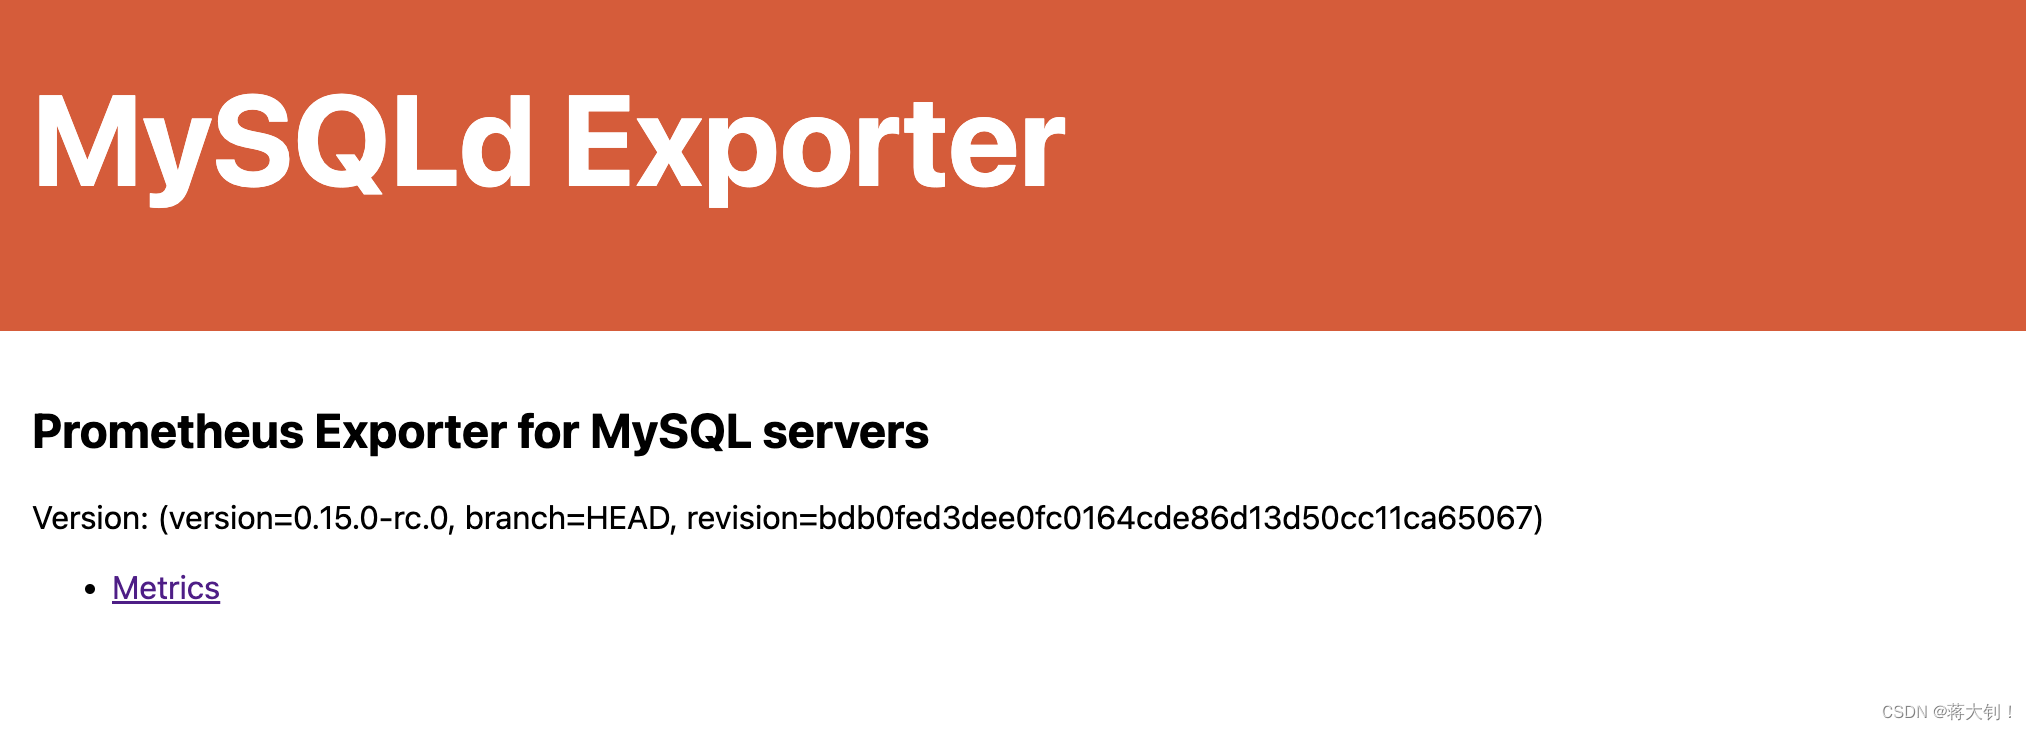
点进去Metrics就能看到具体的采集到的信息
配置prometheus
-
进入上面mysqld_exporter-0.15.0-rc.0.darwin-amd64解压的目录中
-
配置prometheus.yml文件中的scrape_configs
以相同的格式,添加mysql的监听任务以及其监听端口9104:
- job_name: "mysql"

    # metrics_path defaults to '/metrics'
    # scheme defaults to 'http'.

    static_configs:
      - targets: ["localhost:9104"]
最终如下:
# my global config global: scrape_interval: 15s # Set the scrape interval to every 15 seconds. Default is every 1 minute. evaluation_interval: 15s # Evaluate rules every 15 seconds. The default is every 1 minute. # scrape_timeout is set to the global default (10s). # Alertmanager configuration alerting: alertmanagers: - static_configs: - targets: # - alertmanager:9093 # Load rules once and periodically evaluate them according to the global 'evaluation_interval'. rule_files: # - "first_rules.yml" # - "second_rules.yml" # A scrape configuration containing exactly one endpoint to scrape: # Here it's Prometheus itself. scrape_configs: # The job name is added as a label `job=<job_name>` to any timeseries scraped from this config. - job_name: "prometheus" # metrics_path defaults to '/metrics' # scheme defaults to 'http'. static_configs: - targets: ["localhost:9090"] - job_name: "mysql" # metrics_path defaults to '/metrics' # scheme defaults to 'http'. static_configs: - targets: ["localhost:9104"] -
启动prometheus
./prometheus -
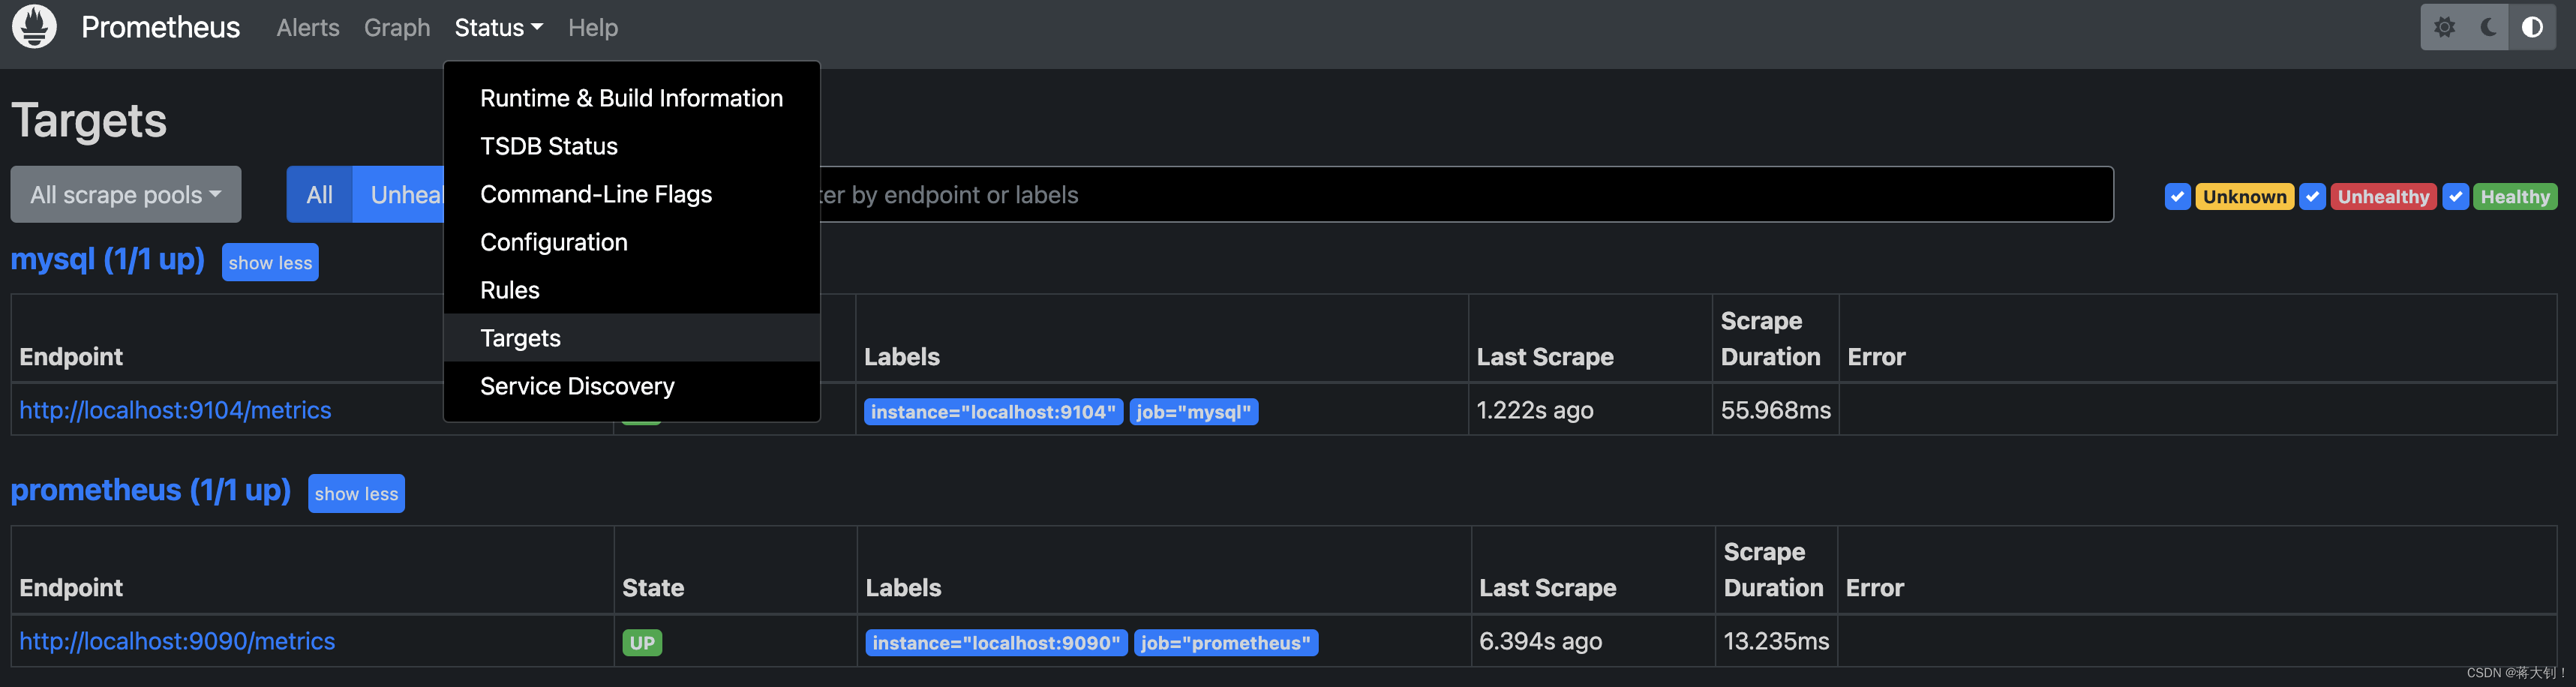
本地浏览器访问端口9090监控页面
http://localhost:9090/ -
进入Status-Targets查看上面收集的Metrics指标
配置Grafana
-
进入解压后的目录grafana-9.4.7/bin
-
运行grafana
./grafana-server -
本地浏览器访问端口3000监控页面
http://localhost:3000/ -
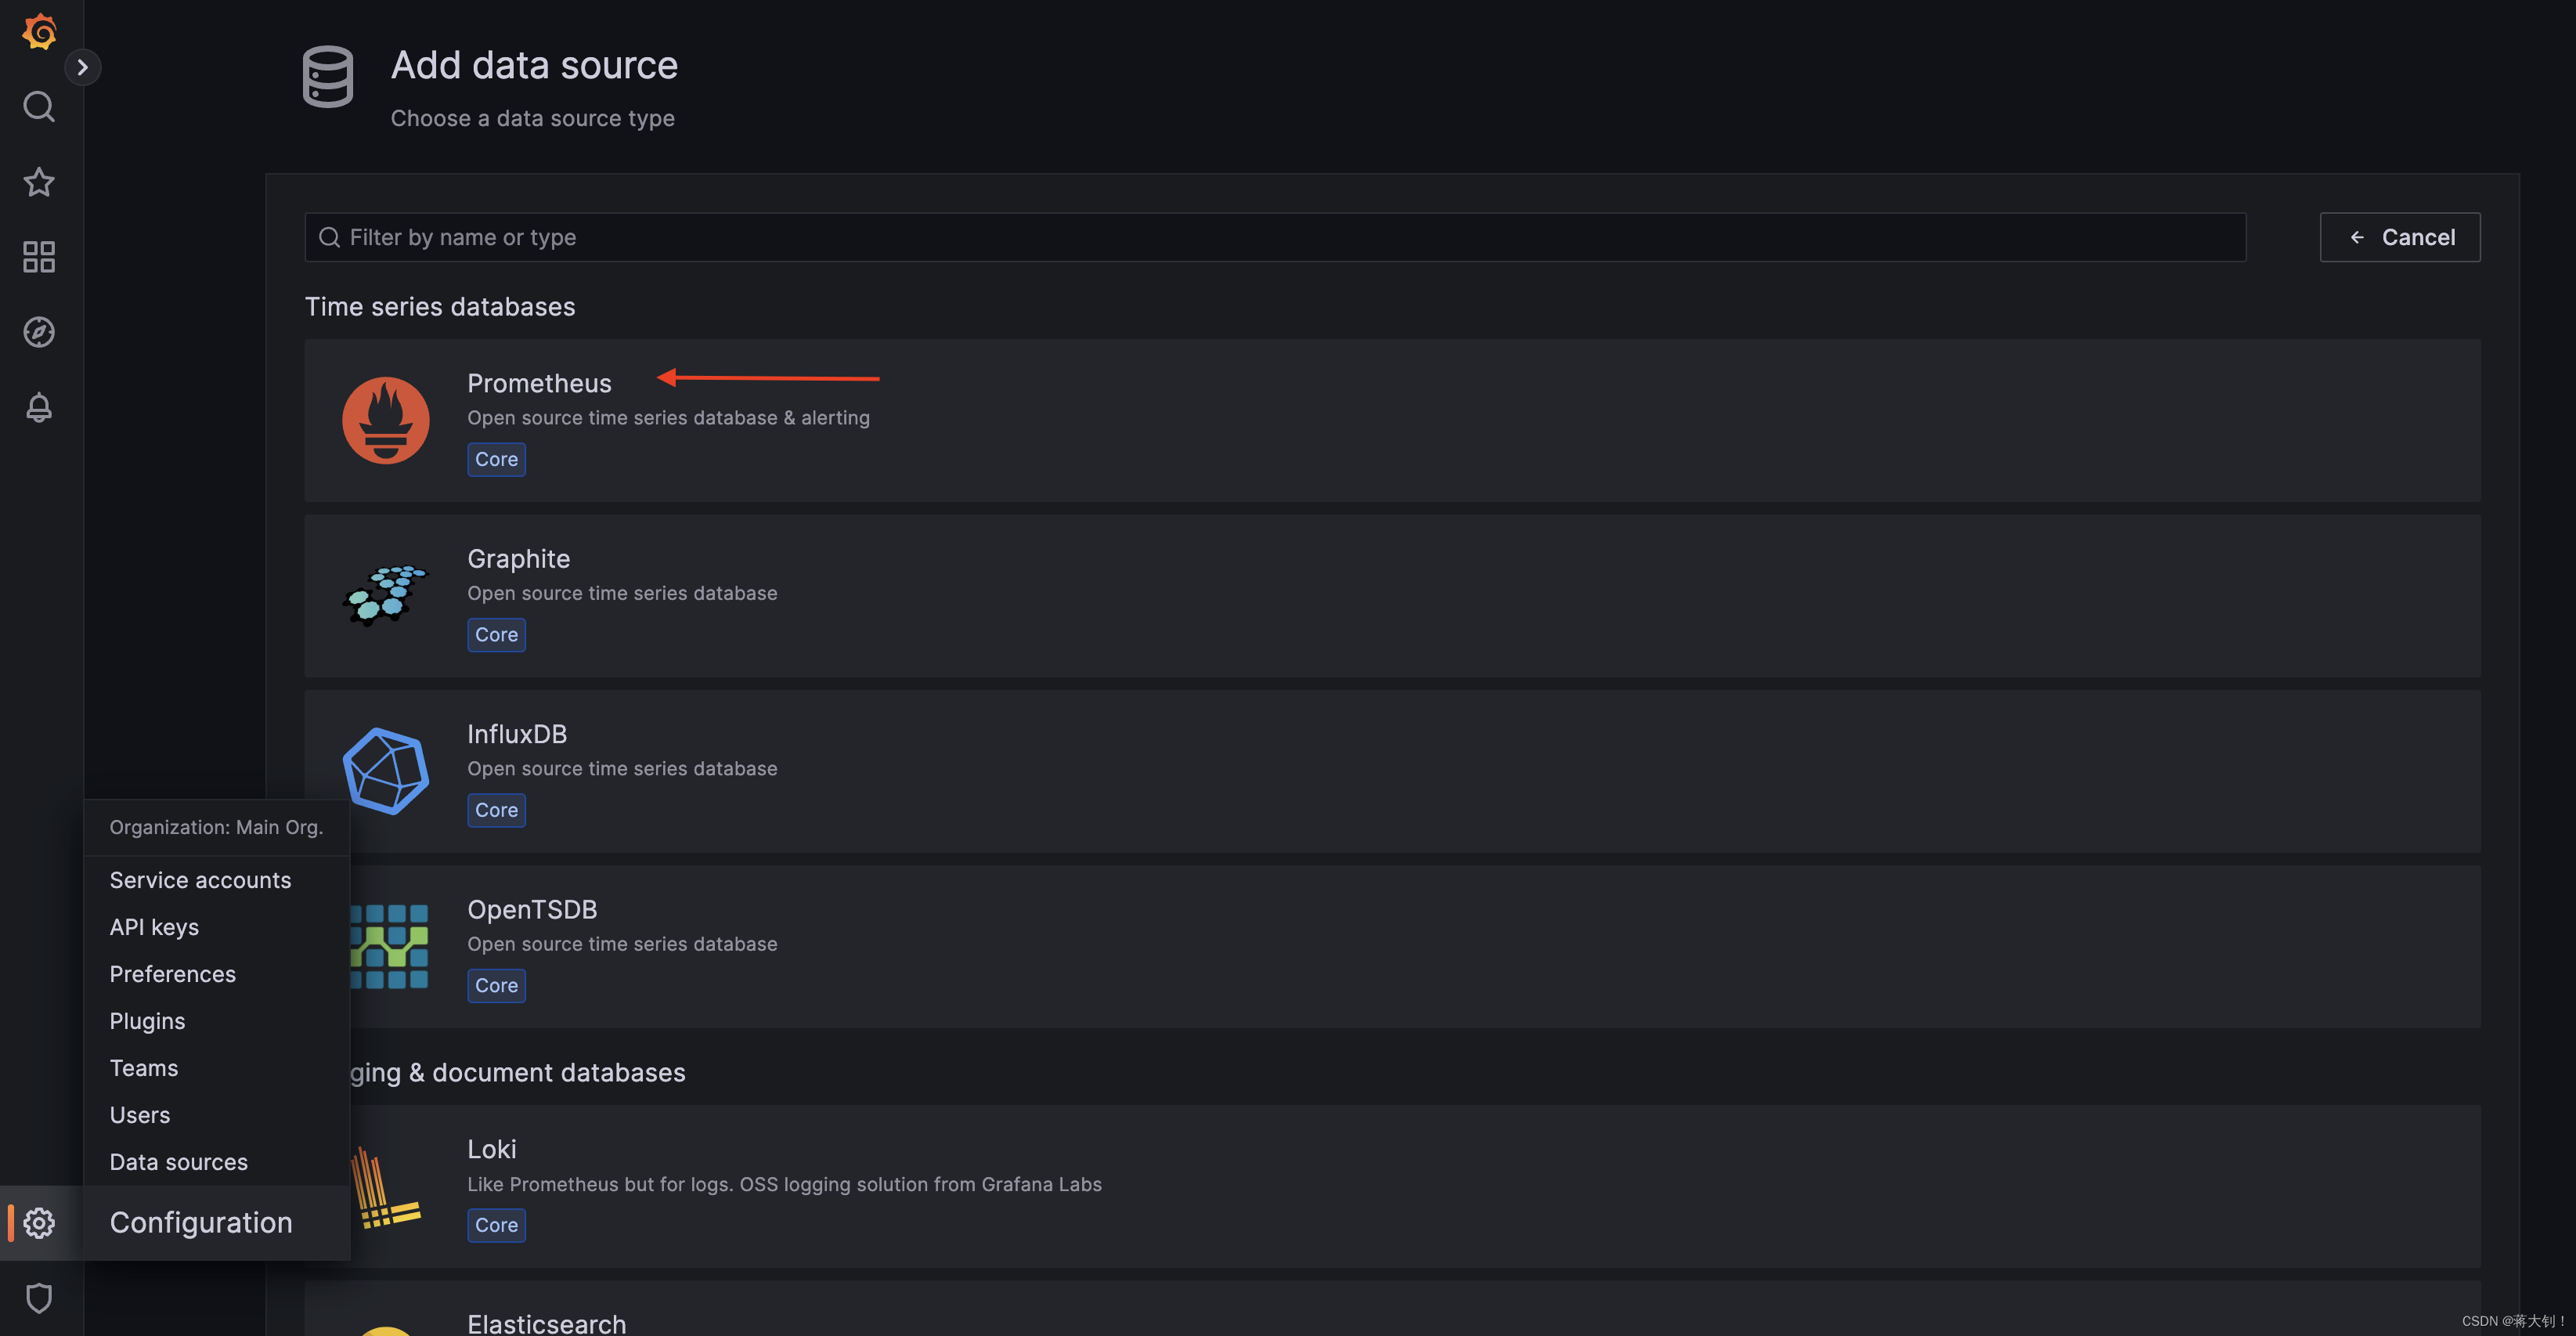
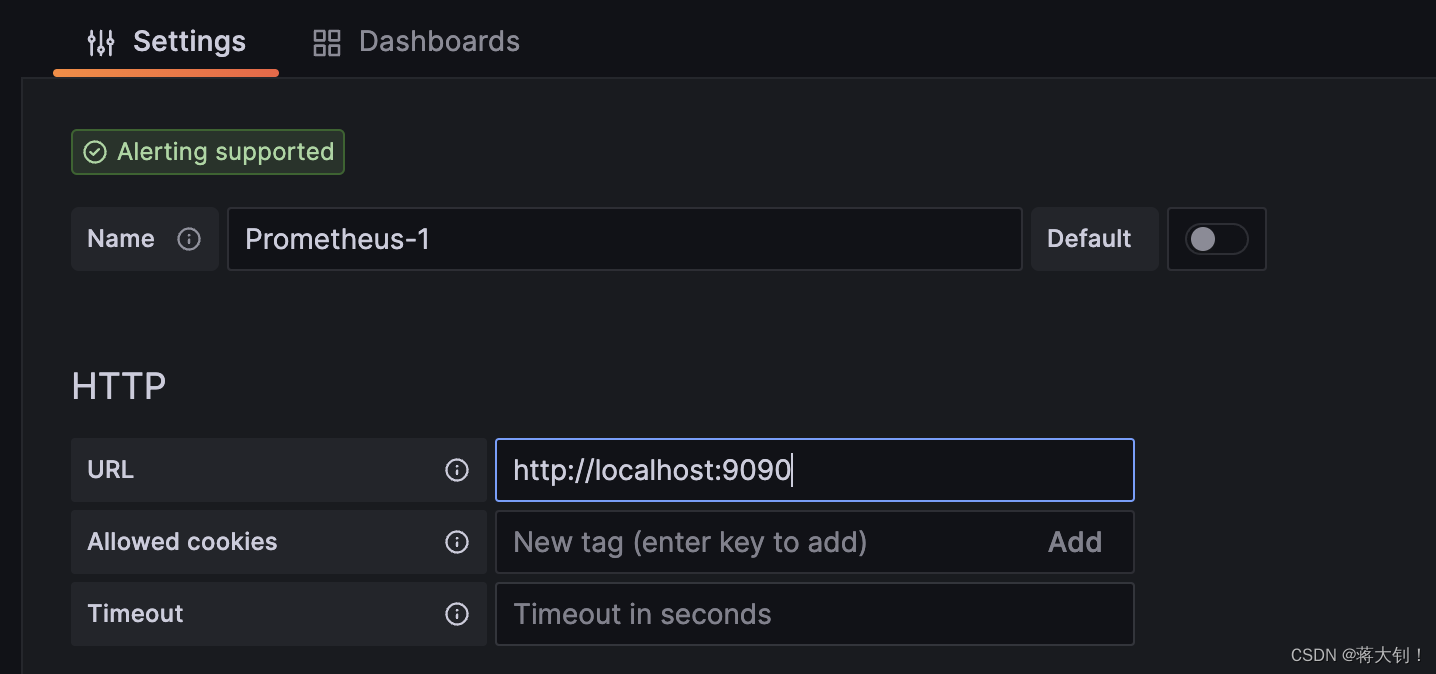
添加prometheus数据源
设置prometheus URL地址并Save&Test:
-
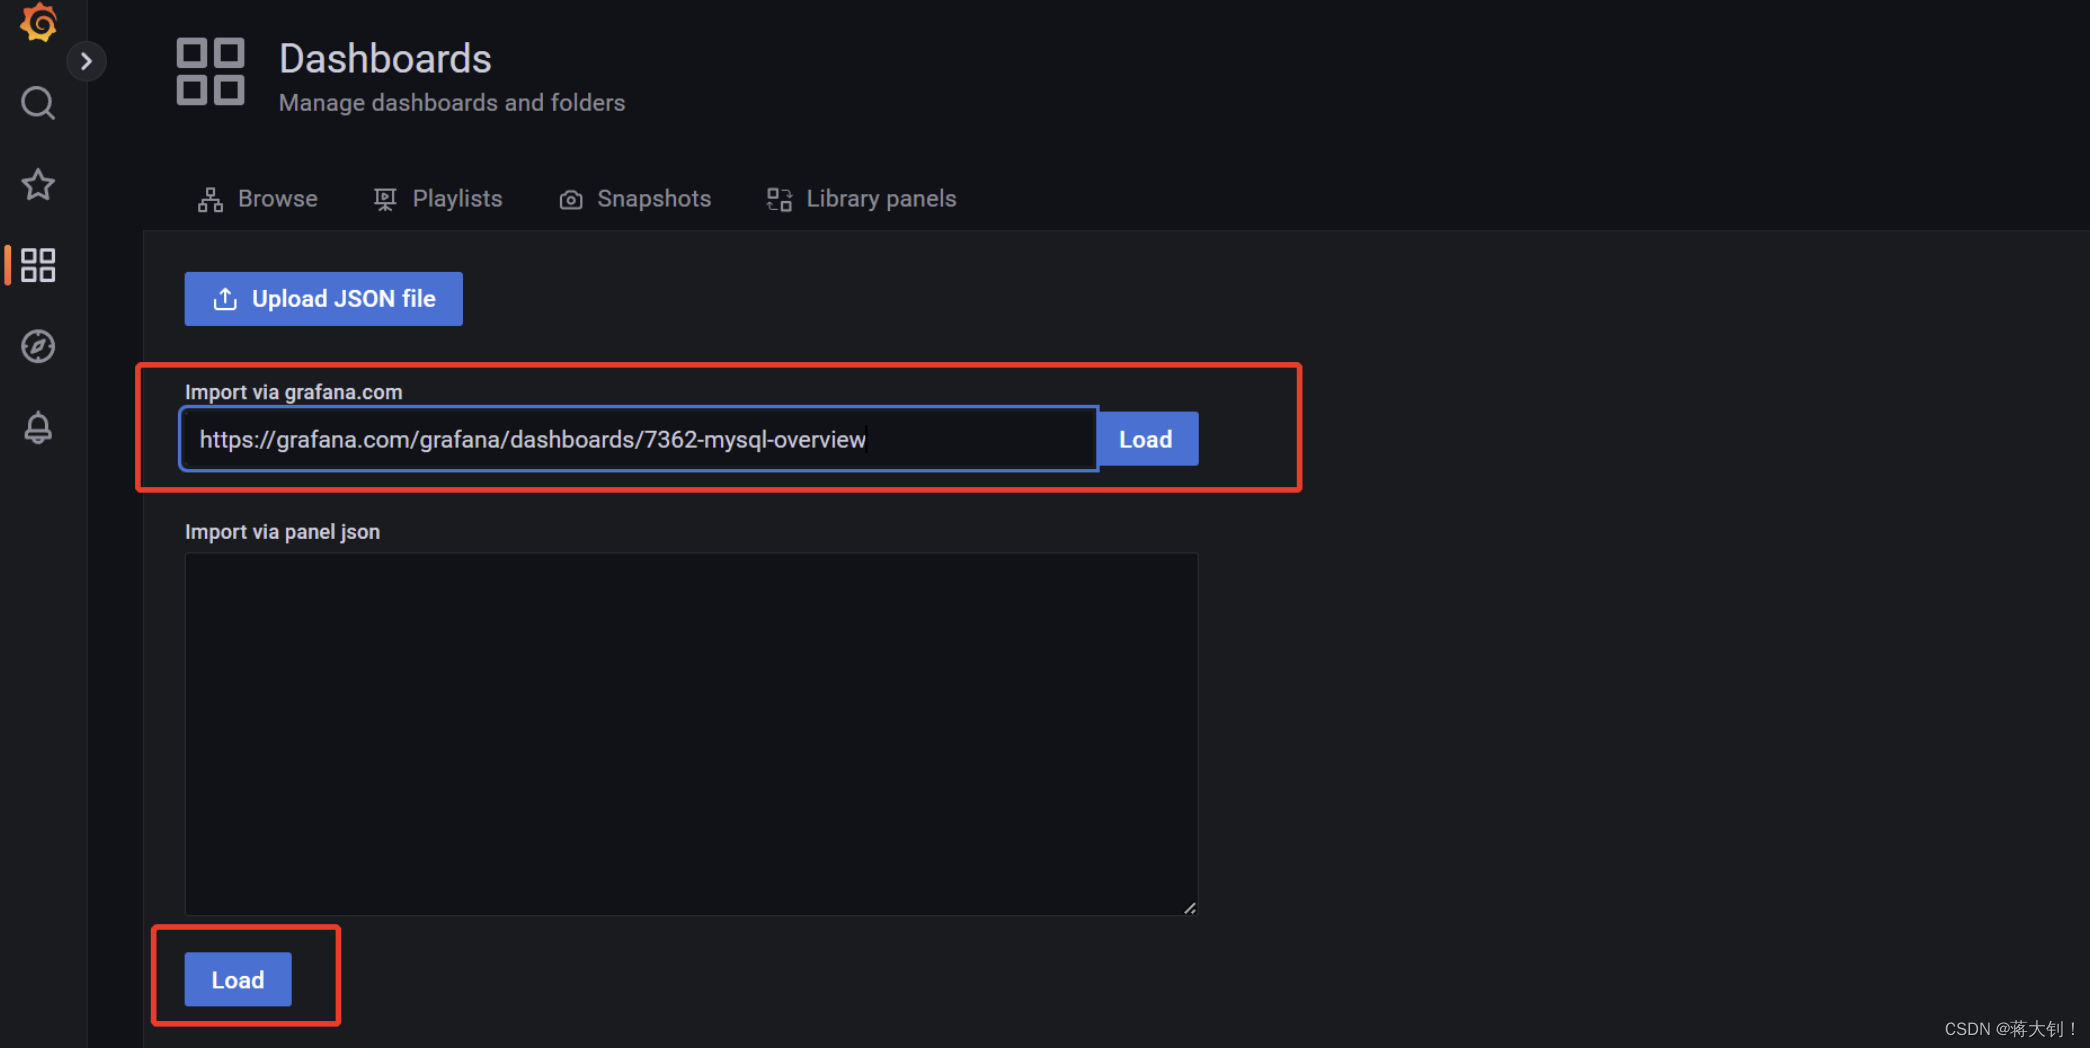
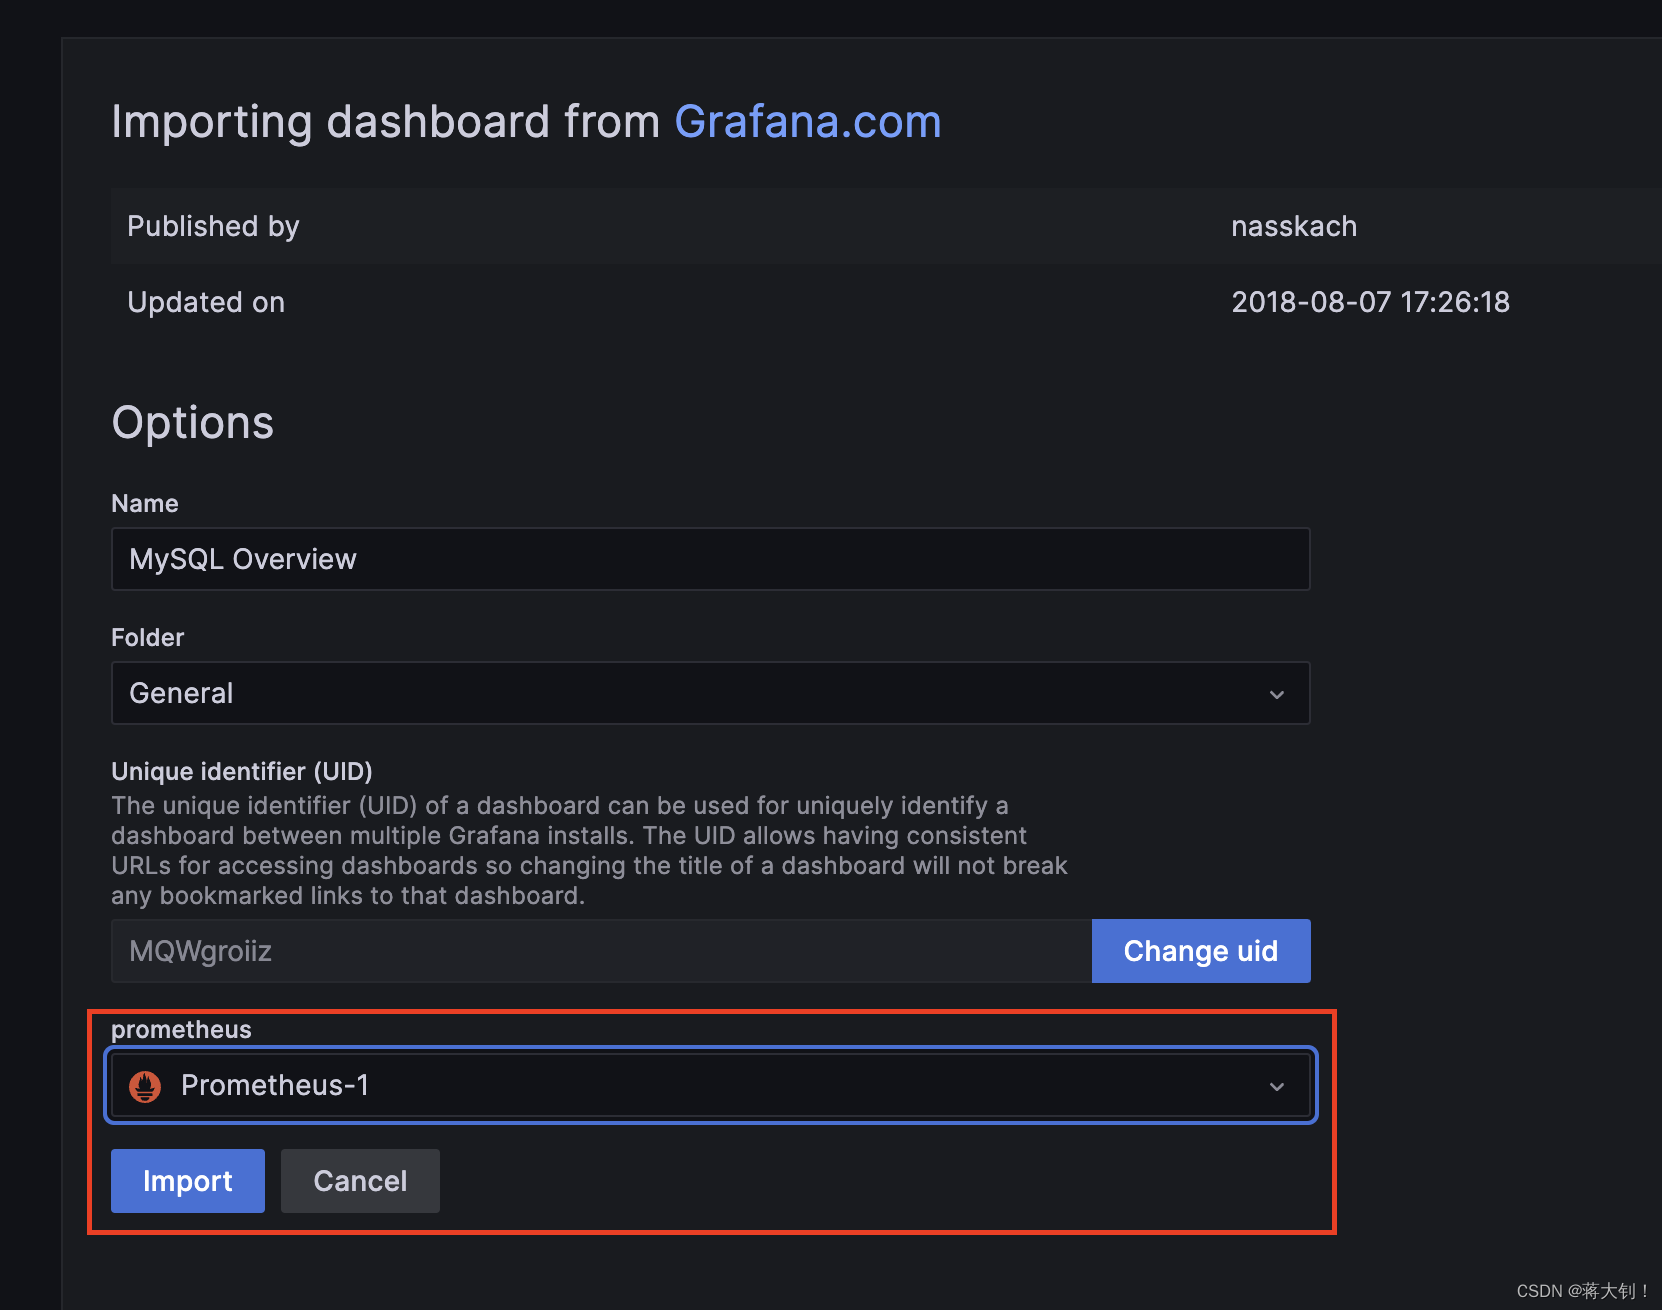
Dashboards导入仪表盘
Dashboards–>Import
填入模板链接:https://grafana.com/grafana/dashboards/7362-mysql-overview
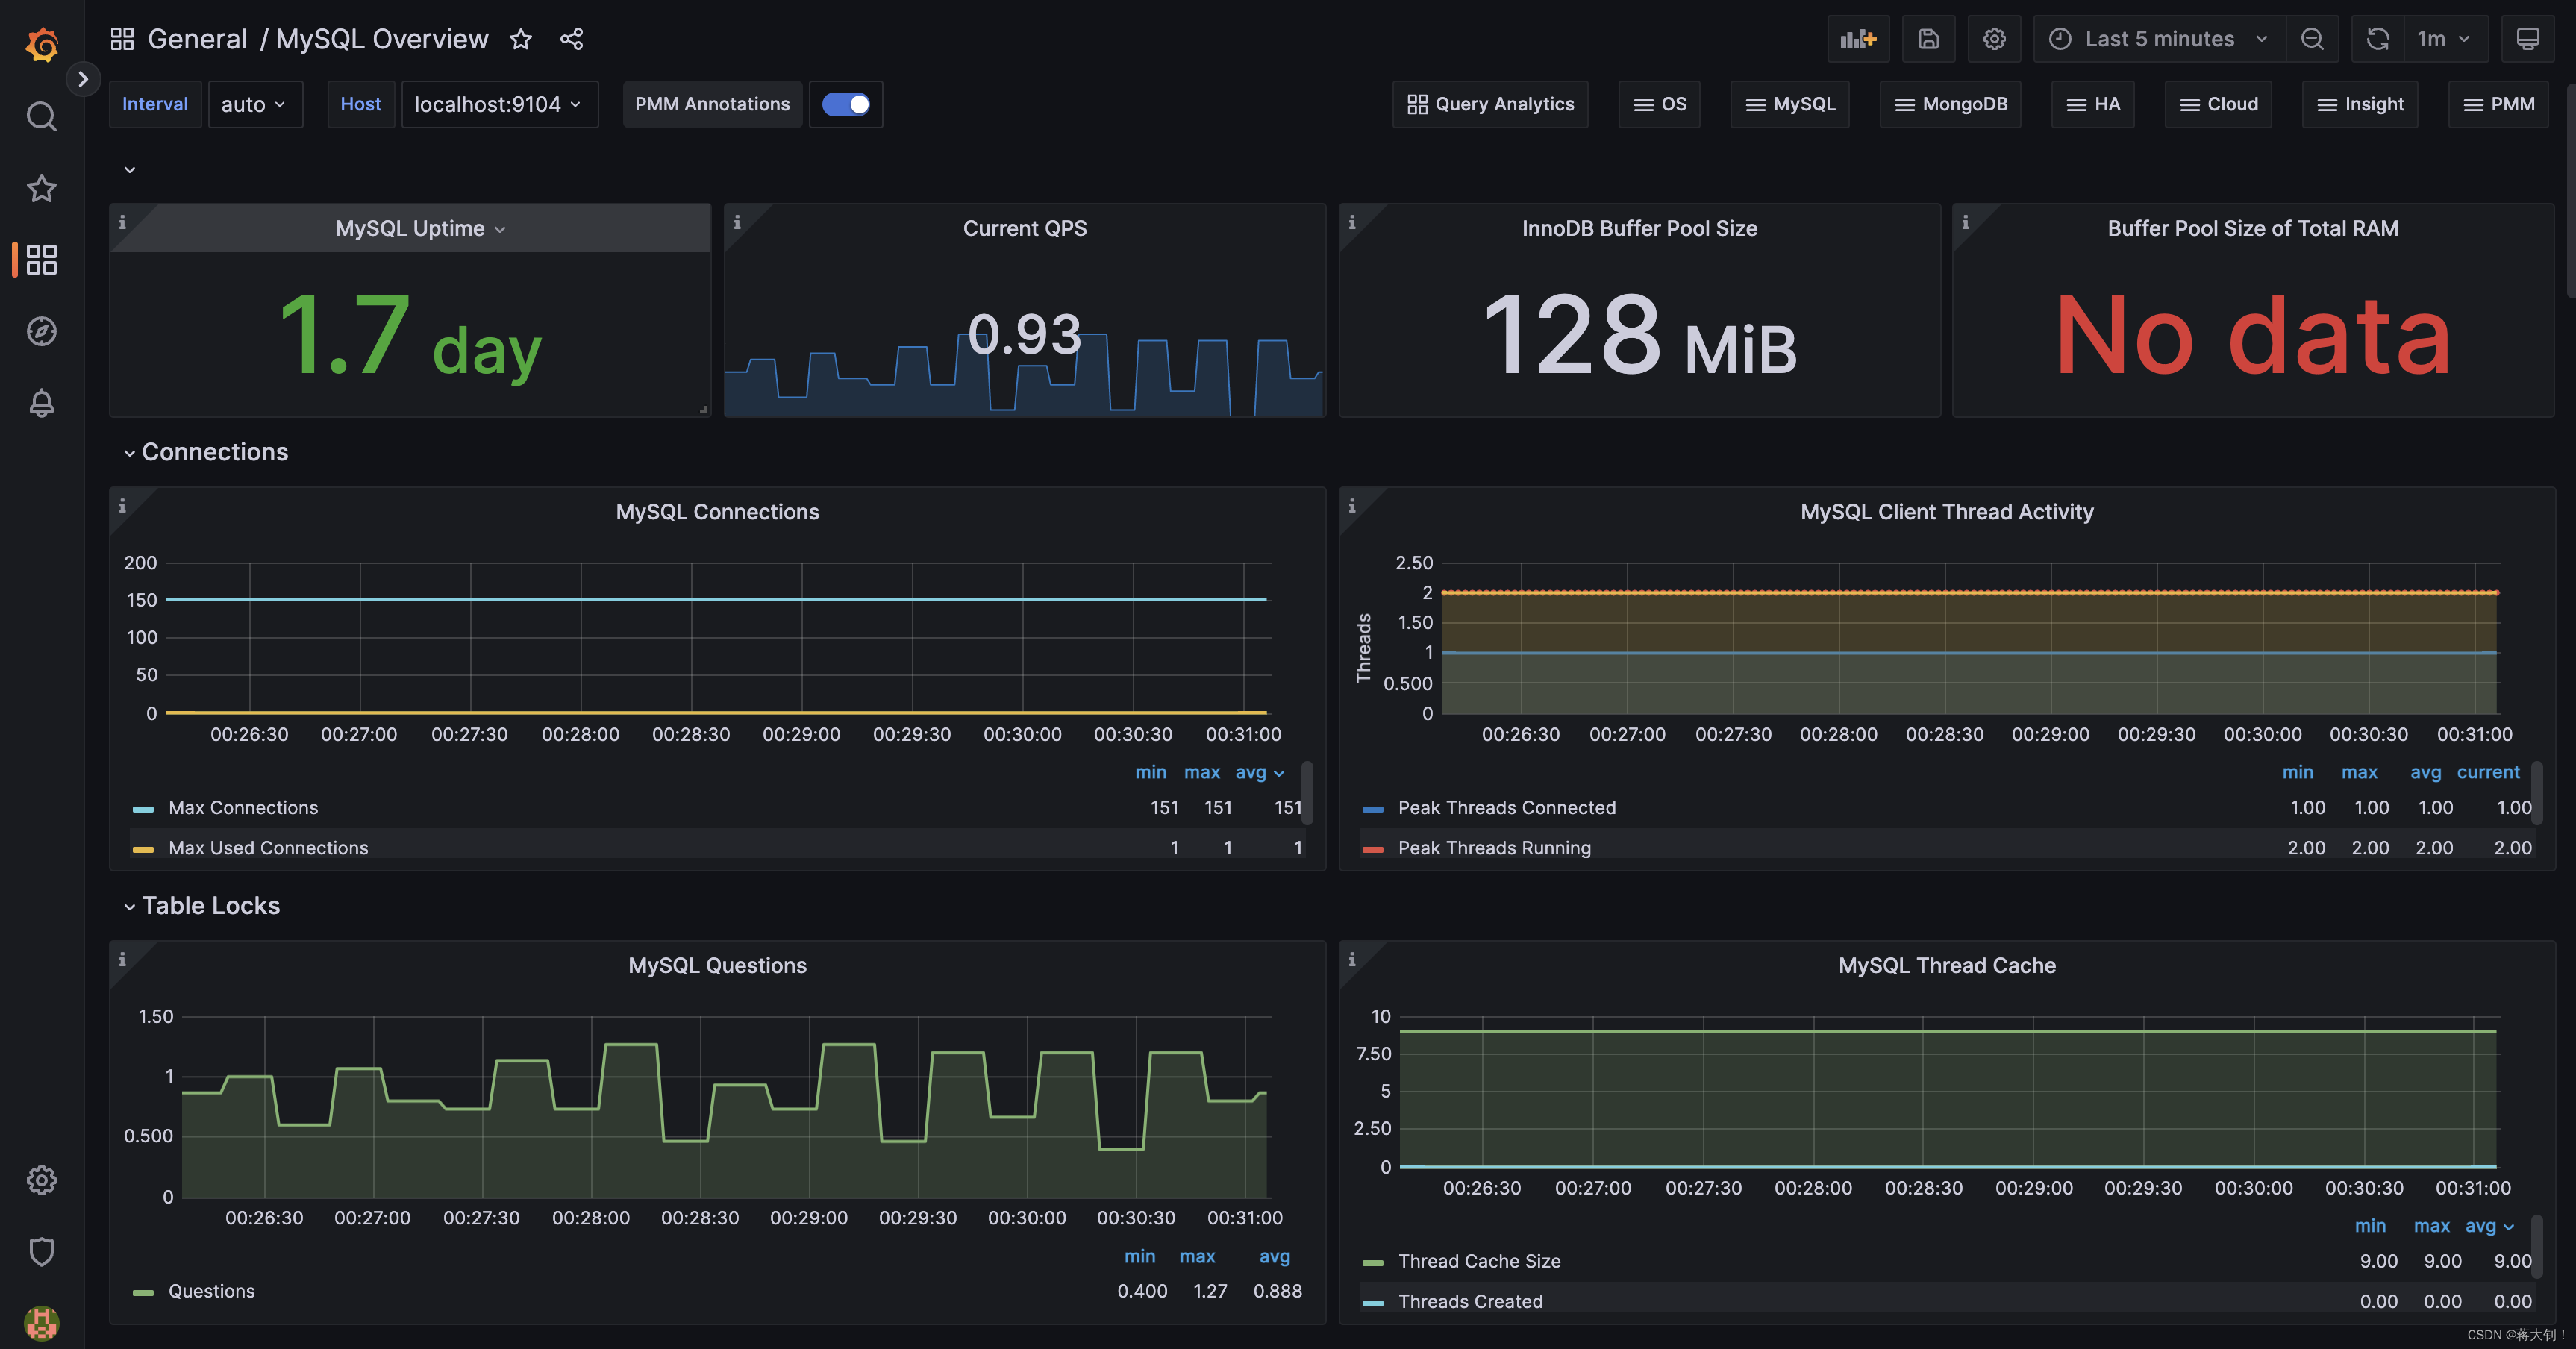
- 结果展示如下


 91
91


 被折叠的 条评论
为什么被折叠?
被折叠的 条评论
为什么被折叠?
 到【灌水乐园】发言


