matplotlib.pyplot中add_subplot方法
- 一般使用add_subplot(111)
- 特殊实例add_subplot(349),等同add_subplot(3,4,9)
>>> import matplotlib.pyplot as plt
>>> fig = plt.figure()
>>> ax = fig.add_subplot(349)
>>> plt.show()
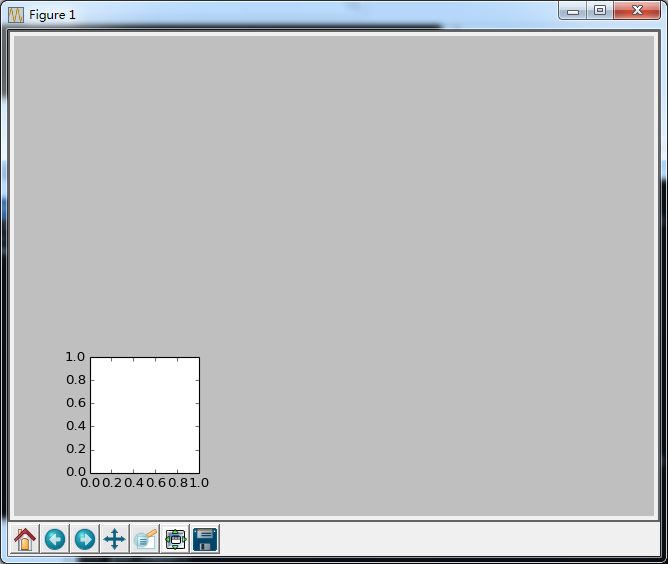
生成的结果图:
参数349的意思是:将画布分割成3行4列,图像画在从左到右从上到下的第9块。选择第10块,只能使用add_subplot(3,4,10)。
- 一个画布上要显示多个图的处理方法:
>>> import matplotlib.pyplot as plt
>>> from numpy import *
>>> fig = plt.figure()
>>> ax = fig.add_subplot(2,1,1)
>>> ax.plot((1,2,3),(3,6,5))
[<matplotlib.lines.Line2D object at 0x02D42A10>]
>>> ax = fig.add_subplot(2,2,3)
>>> ax.plot((1,2,3),(3,6,5))
[<matplotlib.lines.Line2D object at 0x0300EED0>]
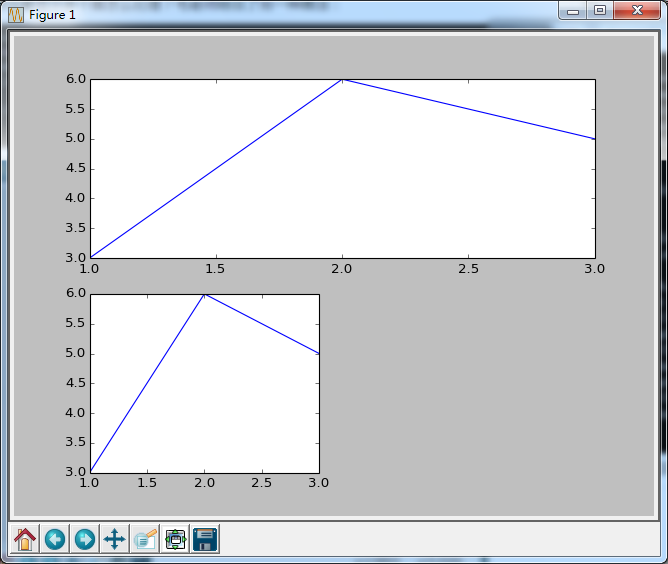
>>> plt.show()
生成的结果图:
排序 sorted(iterable[, key][, reverse])
- 旧版:sorted(iterable[,cmp,[,key[,reverse=True]]])
- 功能:第一个参数是一个iterable,返回值是一个对iterable中元素进行排序后的列表(list)。
- key:接收一个参数的函数,这个函数用于从每个元素中提取一个用于比较的关键字。默认值为None。
- reverse:布尔值。若为True,列表元素将被倒序排列。
- key和reverse比一个等价的cmp函数处理速度要快。这是因为对于每个列表元素,cmp都会被调用多次,而key和reverse只被调用一次。
一、排序基础
一个简单的升序排列很简单,只需要调用sorted()函数即可。 这个函数返回一个新的排序列表。
>>> sorted([5,2,3,1,4])
[1,2,3,4,5]
可以使用只为list定义的list.sort()方法。这个方法会修改原始的list(返回值为None)。此方法不如sorted()方便,若不需要原始的list,list.sort()方法效率会稍微高一些。
二、Key Functions(关键字函数)
从Python2.4开始,list.sort()和sorted()方法都添加了一个key参数来说明一个函数,这个函数在做比较之前会对list中的每个元素进行调用。
>>> sorted("This is a test string from Andrew".split(), key=str.lower)
['a', 'Andrew', 'from', 'is', 'string', 'test', 'This']
key的值应该是一个函数,这个函数接收一个参数并且返回一个用于比较的关键字。这种技术比较快,原因在于对每个输入记录,这个函数只会被调用一次。
对复杂对象的比较通常是使用对象的切片作为关键字。例如:
>>> student_tuples = [('john', 'A', 15), ('jane', 'B', 12), ('dave', 'B', 10), ]
>>> sorted(student_tuples, key=lambda student: student[2])   # sort by age
[('dave', 'B', 10), ('jane', 'B', 12), ('john', 'A', 15)]
同样的技术适用于有named属性的对象。
>>> student_objects = [Student('john', 'A', 15),Student('jane', 'B', 12),Student('dave', 'B', 10), ]
>>> sorted(student_objects, key=lambda student: student.age)   # sort by age
[('dave', 'B', 10), ('jane', 'B', 12), ('john', 'A', 15)]
三、Operator Module Functions (Operator模块中的函数)
operator module有itemgetter,attrgetter,以及从Python2.6开始的methodcaller函数。使用这些函数,上面的例子会变得更简单和快捷:
>>> from operator import itemgetter, attrgetter
>>> sorted(student_tuples, key=itemgetter(2))
[('dave', 'B', 10), ('jane', 'B', 12), ('john', 'A', 15)]
>>> sorted(student_objects, key=attrgetter('age'))
[('dave', 'B', 10), ('jane', 'B', 12), ('john', 'A', 15)]
operator模块支持多级排序。例如先按成绩排序,再按年龄排序:
>>> sorted(student_tuples, key=itemgetter(1,2))
[('john', 'A', 15), ('dave', 'B', 10), ('jane', 'B', 12)]
>>> sorted(student_objects, key=attrgetter('grade', 'age'))
[('john', 'A', 15), ('dave', 'B', 10), ('jane', 'B', 12)]
四、升序和降序
list.sort()和sorted()都接收一个reverse参数。它是用于降序排序的标志。例如,为了获得学生年龄的降序排序:
>>> sorted(student_tuples, key=itemgetter(2), reverse=True)
[('john', 'A', 15), ('jane', 'B', 12), ('dave', 'B', 10)]
字典方法 dict.get(key, default)
- 功能:获取字典中,一个给定的key对应的值。若key不存在,则返回默认值default。
>>> dict = {'A':1, 'B':2, 'C':'dict'}
>>> dict.get('A',0)
1
>>> dict.get('A')
1
>>> dict.get('D')
>>> dict.get('D', 0)
0
>>> dict.get('C', 0)
'dict'
sum(a[, axis, dtype, out])
max(a[, axis, out])
min(a[, axis, out])
mean(a[, axis, dtype, out])
- 功能:根据给定的axis(轴),计算数组或者矩阵的和、最大值、最小值、平均值。下面以求和为例介绍axis参数。
- 没有axis参数:将数组、矩阵所有元素相加
- 一维数组:
- axis=0,将所有元素相加
- axis=1,一维数组没有1轴,会提示错误
- 二维数组:
- axis=0:将二维数组的每一列向量相加
- axis=1:将二维数组的每一行向量相加
- 矩阵:
- axis=0:将矩阵的每一列向量相加
- axis=1:将矩阵的每一行向量相加
>>> import numpy as np
>>> a = np.array([[0, 2, 1]])
>>> a.sum()
3
>>> a.sum(axis=0)
array([0, 2, 1])
>>> a.sum(axis=1)
array([3])
>>> b = np.array([0, 2, 1])
>>> b.sum()
3
>>> b.sum(axis=0)
3
>>> b.sum(axis=1)
ValueError: 'axis' entry is out of bounds
>>> c = np.array([[0, 2, 1], [3, 5, 6], [0, 1, 1]])
>>> c.sum()
19
>>> c.sum(axis=0)
array([3, 8, 8])
>>> c.sum(axis=1)
array([ 3, 14,  2])
>>> d = matrix([0,2,1])
>>> d.sum()
3
>>> d.sum(axis=0)
matrix([[0, 2, 1]])
>>> d.sum(axis=1)
matrix([[3]])
tile(A, reps)
- 位于python模块 numpy.lib.shape_base中
- 功能:将数组A,根据数组reps沿各个维度重复多次,构成一个新的数组。reps的数字从后往前分别对应A的第N个维度的重复次数。
>>> a = array([0, 1, 2])
>>> tile(a, 2)
array([0, 1, 2, 0, 1, 2])
>>> tile(a, (2, 2))
array([[0, 1, 2, 0, 1, 2],
       [0, 1, 2, 0, 1, 2]])
>>> tile(a, (4, 3, 2))
array([[[0, 1, 2, 0, 1, 2],
        [0, 1, 2, 0, 1, 2],
        [0, 1, 2, 0, 1, 2]],

       [[0, 1, 2, 0, 1, 2],
        [0, 1, 2, 0, 1, 2],
        [0, 1, 2, 0, 1, 2]],

       [[0, 1, 2, 0, 1, 2],
        [0, 1, 2, 0, 1, 2],
        [0, 1, 2, 0, 1, 2]],

       [[0, 1, 2, 0, 1, 2],
        [0, 1, 2, 0, 1, 2],
        [0, 1, 2, 0, 1, 2]]])
>>> b = array([[1, 2], [3, 4]])
>>> tile(b, 2)
array([[1, 2, 1, 2],
       [3, 4, 3, 4]])


 2297
2297

 被折叠的 条评论
为什么被折叠?


