python读取txt文档坐标绘制二维轨迹图
```python
import matplotlib.pyplot as plt
import numpy as np

filename1 = '/home/sr/Desktop/no4.txt'
filename2 = '/home/sr/Desktop/have4.txt'
X1, Y1, X2, Y2 = [], [], [], []
with open(filename1, 'r') as f:  # 1
    lines = f.readlines()  # 2
    for line in lines:  # 3
        value = [float(s) for s in line.split()]  # 4
        X1.append(value[0]/100)  # 5
        Y1.append(value[1]/100)

with open(filename2, 'r') as f:  # 1
    lines = f.readlines()  # 2
    for line in lines:  # 3
        value = [float(s) for s in line.split()]  # 4
        X2.append(value[0]/100)  # 5
        Y2.append(value[1]/100)
plt.xlim((-5, 5))
plt.ylim((-2, 2))
#设置坐标轴名称
plt.xlabel('x')
plt.ylabel('y')

plt.xticks(np.arange(-0.5, 6, 0.5))
plt.yticks(np.arange(-0.5, 8, 0.5))
plt.plot(X1, Y1, color='blue', label='no odom')
plt.plot(X2, Y2, color='red', label='have odom')

plt.legend()
plt.savefig('/home/sr/Desktop/1.png', bbox_inches='tight')

plt.show()
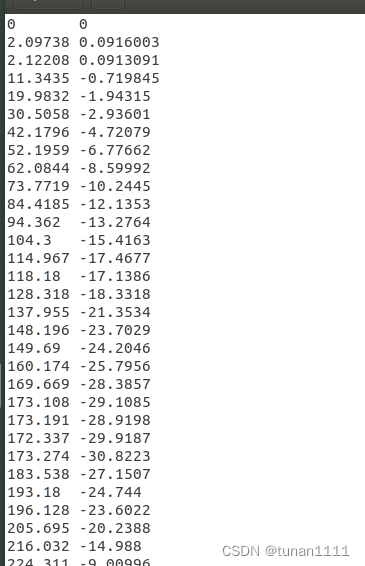
txt文档数据如图所示:
绘制结果如图所示


 1061
1061


 被折叠的 条评论
为什么被折叠?
被折叠的 条评论
为什么被折叠?
 到【灌水乐园】发言


