Ctrl+f搜关键词,搜不到找其他博客,下面肯定没有
plt.xlim(-1,10)
plt.ylim(0,10)
from matplotlib import font_manager
x = np.linspace(0,2 * np.pi,100)
y = np.sin(x)
plt.figure(figsize=(19,6))
plt.plot(x,y,color = '#FF00EE',
ls = '--',
lw = 2,
alpha = 0.6,
marker = 'o',
markerfacecolor = 'red',
markersize = 10,
markeredgecolor = 'green',
markeredgewidth = 3)
plt.rcParams['font.family'] = 'KaiTi'
plt.rcParams['font.size'] = 28
ax = plt.gca()
ax = plt.subplot(2,1,1)
ax.plot(x,np.sin(x))
fig,axes = plt.subplots(2,2)
axes[0,0].plot(x,np.sin(x),color = 'red')
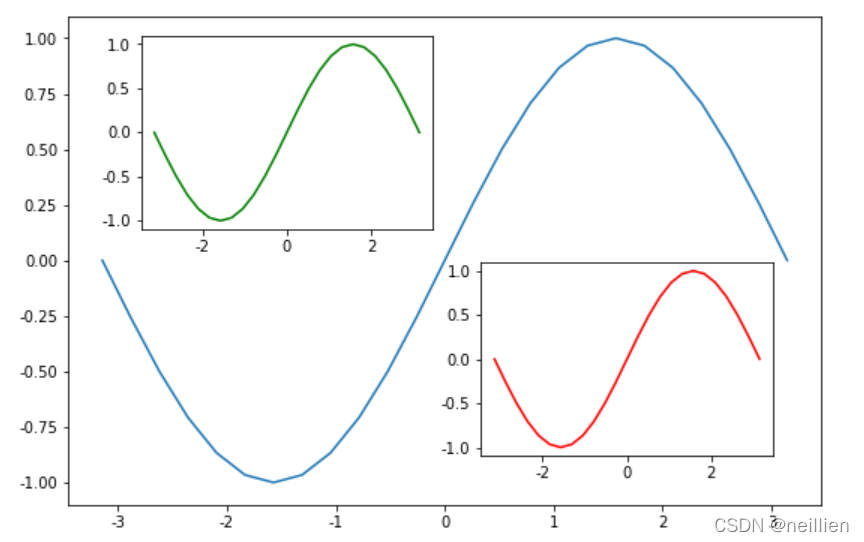
ax = plt.axes([0.2,0.55,0.3,0.3])
ax.plot(x,y,color = 'g')
ax = fig.add_axes([0.55,0.2,0.3,0.3])
ax.plot(x,y,color = 'r')
fig, ((ax11,ax12,ax13), (ax21,ax22,ax23),(ax31,ax32,ax33)) = plt.subplots(3, 3)
fig.set_figwidth(9)
fig.set_figheight(6)
ax11.plot(x,np.sin(x))
。。。。。。
plt.tight_layout()
plt.show()
ax2 = ax.twinx()
ax.set_facecolor('green')
ax.spines['right'].set_alpha(0)
ax.spines['top'].set_color('#FFFFFF')
plt.rcParams['axes.unicode_minus'] = False
plt.title('正弦波',fontsize = 18,color = 'red',pad = 20)
font = {'fontsize': 20,
'family': 'STKaiti',
'color': 'red',
'weight': 'bold'}
plt.title('指数级衰减',fontdict=font,pad = 20)
plt.suptitle('指数衰减',y = 1.05,fontdict = font,fontsize = 30)
plt.xlabel('X')
plt.ylabel('f(x) = sin(x)',rotation = 0,horizontalalignment = 'right')
y_ = plt.yticks([-1,0,1])
x_ = plt.xticks([0,np.pi/2,np.pi,1.5*np.pi,2*np.pi],
[0,r'$\frac{\pi}{2}$',r'$\pi$',r'$\frac{3\pi}{2}$',r'$2\pi$'],color = 'red')
plt.grid(color = 'green',alpha = 0.5,linestyle = '--',linewidth = 1)
plt.legend(['Sin','Cos','Sin + Cos'],fontsize = 18,
loc = 'center',
ncol = 3,
bbox_to_anchor = (0,1,1,0.2))
plt.savefig('./2.pdf',dpi = 300)
df1 = pd.DataFrame(data = np.random.randn(1000,4),
index = pd.date_range(start = '27/6/2021',periods=1000),
columns=list('ABCD'))
df1.cumsum().plot()
df2 = pd.DataFrame(data = np.random.rand(10,4),
columns = list('ABCD'))
df2.plot.bar(stacked = True)
df2
df3 = pd.DataFrame(data = np.random.rand(4,2),
index = list('ABCD'),
columns=['One','Two'])
df3.plot.pie(subplots = True,figsize = (8,8),colors = np.random.random(size = (4,3)))
df4 = pd.DataFrame(np.random.randint(0,50, size = (50,4)), columns=list('ABCD'))
df4.plot.scatter(x='A', y='B')
ax = df4.plot.scatter(x='A', y='C', color='DarkBlue', label='Group 1');
df4.plot.scatter(x='B', y='D', color='DarkGreen', label='Group 2', ax=ax)
df4.plot.scatter(x='A',y='B',s = df4['C']*200)
df5 = pd.DataFrame(data = np.random.rand(10, 4),
columns=list('ABCD'))
df5.plot.area(stacked = True,color = np.random.rand(4,3));


 26万+
26万+

 被折叠的 条评论
为什么被折叠?


