


在 MATLAB 中使用此函数根据需要进行缩放和查看特定区域的数据细节。
% Method 1: Zoom by selecting axis limits
function zoomin1(init_data)
% ZOOMIN Zooms into a selected region of data using two methods.
%
% init_data: Original data matrix
x = get(gca, 'xtick'); % Get current x-axis limits
y = get(gca, 'ytick'); % Get current y-axis limits
xmax = max(x); xmin = min(x);
ymax = max(y); ymin = min(y);
init_x = init_data(:, 2); % Example: Replace with appropriate column from init_data
ind = find(xmin <=init_x &init_x<= xmax);
if isempty(ind)
msgbox('Selected axis limits are incorrect or no data found.', 'Warning', 'warn');
data2 = [];
return
end
data11 = init_data(ind, :);
init_y = data11(:, 3); % Example: Replace with appropriate column from init_data
ind2 = find(ymin <= init_y & init_y <= ymax);
if isempty(ind2)
msgbox('Selected axis limits are incorrect or no data found.', 'Warning', 'warn');
data2 = [];
return
end
data2 = data11(ind2, :);
figure;
plot(data2);
end
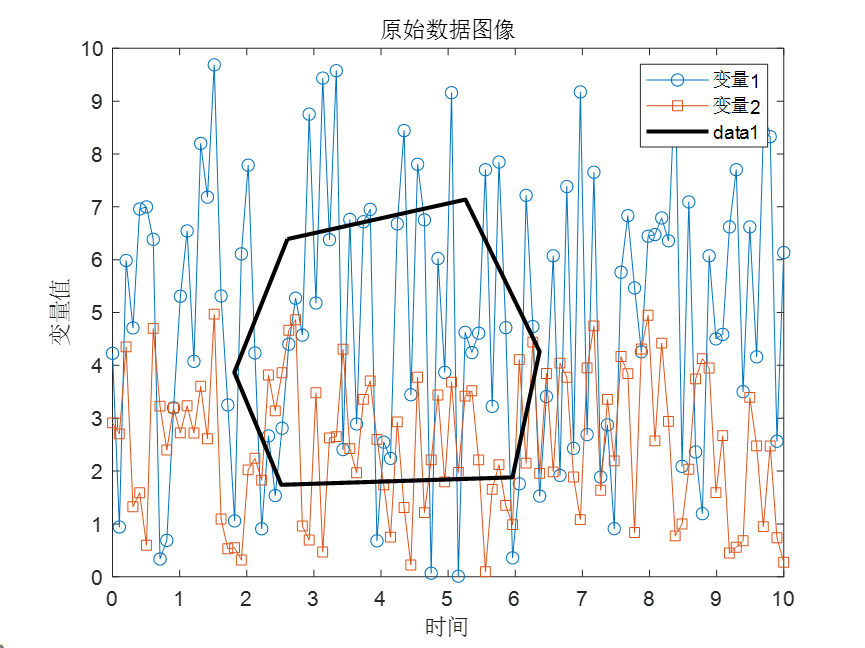
% Method 2: Zoom by selecting a polygonal region
function zoomin2(init_data)
[x, y] = ginput;
if ~isempty(x)
xv = [x' x(1)]; yv = [y' y(1)];
hold(gca, 'on');
plot(gca, xv, yv);
% Assuming init_x and init_y are defined somewhere in your context
% Replace with actual initialization of init_x and init_y based on your data
init_x = init_data(:, 2); % Example: Replace with appropriate column from init_data
init_y = init_data(:, 3); % Example: Replace with appropriate column from init_data
in1 = inpolygon(init_x, init_y, xv, yv);
data2 = init_data(in1, :);
figure;
plot(data2);
end
end
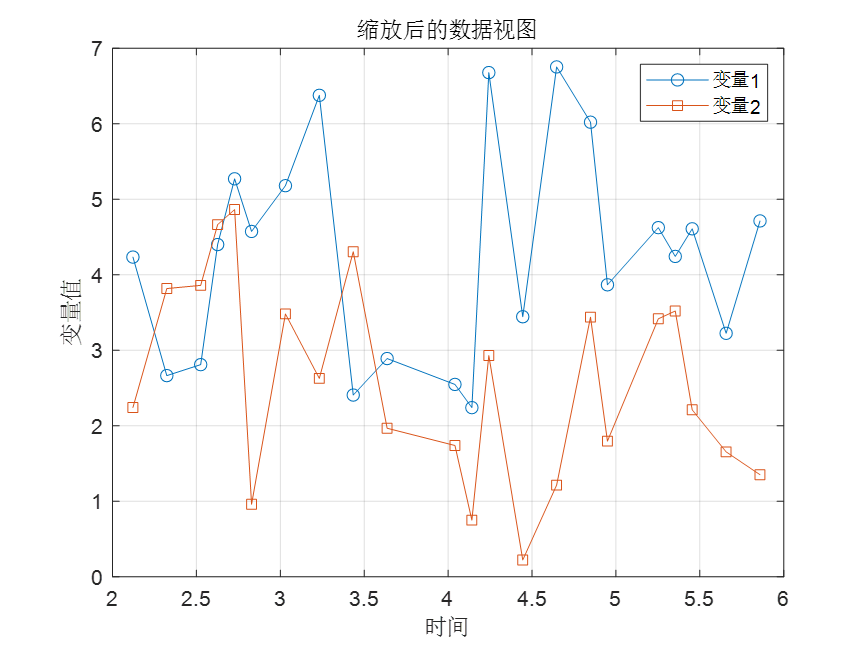
方法1:通过缩放坐标轴显示范围
- 根据当前坐标轴的范围 (
xmin,xmax,ymin,ymax) 来筛选数据。 - 如果选择的范围内无数据,将弹出警告框。
- 在新的图形窗口中绘制选定范围的数据。


方法2:通过框选数据
- 使用
ginput函数获取用户通过框选选择的点(x, y)。 - 根据这些点构成的多边形区域
(xv, yv),使用inpolygon函数筛选数据。 - 在新的图形窗口中绘制选择的数据。
多子图情况:
function zoomin(init_data, corarea)
    % ZOOMIN Zooms into a selected region of data using two methods.
    %
    % init_data: Original data matrix
    % init_cgdata: Additional data (not used in current example)
    % corarea: Coordinate area ('T-Z', 'X-Y', 'X-Z', or 'Z-Y')

    if isempty(corarea)
        corarea = 'T-Z';
    end

    x = get(gca, 'xtick'); % Get current x-axis limits
    y = get(gca, 'ytick'); % Get current y-axis limits

    xmax = max(x); xmin = min(x);
    ymax = max(y); ymin = min(y);

    switch corarea
        case 'T-Z'
            t = init_data(:, 1);
            ind = find(xmin <= t & t <= xmax);
            if isempty(ind)
                msgbox('Selected axis limits are incorrect or no data found.', 'Warning', 'warn');
                return
            end
            data11 = init_data(ind, :);

            ind2 = find(ymin <= data11(:, 4) & data11(:, 4) <= ymax);
            if isempty(ind2)
                msgbox('Selected axis limits are incorrect or no data found.', 'Warning', 'warn');
                return
            end
            data2 = data11(ind2, :);

        case 'X-Y'
            ind = find(xmin <= init_data(:, 2) & init_data(:, 2) <= xmax);
            if isempty(ind)
                msgbox('Selected axis limits are incorrect or no data found.', 'Warning', 'warn');
                return
            end
            data11 = init_data(ind, :);
            ind2 = find(ymin <= data11(:, 3) & data11(:, 3) <= ymax);
            if isempty(ind2)
                msgbox('Selected axis limits are incorrect or no data found.', 'Warning', 'warn');
                return
            end
            data2 = data11(ind2, :);

        case 'X-Z'
            ind = find(xmin <= init_data(:, 2) & init_data(:, 2) <= xmax);
            if isempty(ind)
                msgbox('Selected axis limits are incorrect or no data found.', 'Warning', 'warn');
                return
            end
            data11 = init_data(ind, :);
            ind2 = find(ymin <= data11(:, 4) & data11(:, 4) <= ymax);
            if isempty(ind2)
                msgbox('Selected axis limits are incorrect or no data found.', 'Warning', 'warn');
                return
            end
            data2 = data11(ind2, :);

        case 'Z-Y'
            ind = find(xmin <= init_data(:, 4) & init_data(:, 4) <= xmax);
            if isempty(ind)
                msgbox('Selected axis limits are incorrect or no data found.', 'Warning', 'warn');
                return
            end
            data11 = init_data(ind, :);
            ind2 = find(ymin <= data11(:, 3) & data11(:, 3) <= ymax);
            if isempty(ind2)
                msgbox('Selected axis limits are incorrect or no data found.', 'Warning', 'warn');
                return
            end
            data2 = data11(ind2, :);

    end

    % Plot the zoomed-in data using a custom plotting function (plot_lma_ghmlls_wave)
    figure;
    plot(data2);
%
%
%
%
%
%======================Method 2=================================================

%     % Method 2: Zoom by selecting a polygonal region (only for 'T-Z' case)
%
%     if strcmp(corarea, 'T-Z')
%         [x, y] = ginput;
%         if ~isempty(x)
%             xv = [x' x(1)]; yv = [y' y(1)];
%             hold(gca, 'on');
%             plot(gca, xv, yv, 'k-', 'LineWidth', 2);
%
%             in1 = inpolygon(init_data(:, 1), init_data(:, 4), xv, yv);
%             data2 = init_data(in1, :);
%
%             figure;
%             plot(data2);
%         end
%     end
%  %===========================================================================
end


 被折叠的 条评论
为什么被折叠?
被折叠的 条评论
为什么被折叠?
 到【灌水乐园】发言


