


本文使用anaconda进行环境和安装包管理,感兴趣的读者可以参考其他帖子安装matplotlib库
学习简单的plt使用
# -*- coding: utf-8 -*-
# 导入plt库
import matplotlib.pyplot as plt
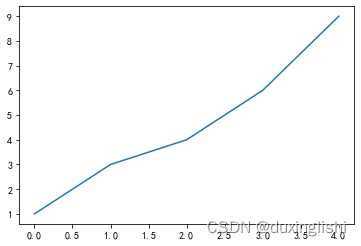
# 生成最简单的折线图
square = [1, 3, 4, 6, 9]
plt.plot(square)
plt.show()
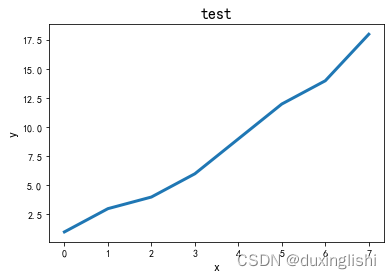
修改标签文字和线条样式
# -*- coding: utf-8 -*-

import matplotlib.pyplot as plt

square = [1, 3, 4, 6, 9, 12, 14, 18]

plt.plot(square, linewidth = 3)		# 这里可以直接指定square为数据,然后该函数会认为横坐标默认为12345...
plt.title("test", fontsize = 16)    # 标题字号大小
plt.xlabel("x", fontsize = 12)      # fontsize指的是x这个坐标轴标题的字号大小
plt.ylabel("y", fontsize = 12)
plt.tick_params(axis = 'both', labelsize = 10)    # 刻度字体大小
plt.show()
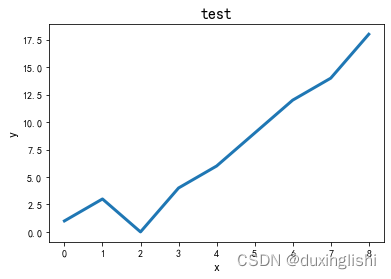
指定数据内容
# -*- coding: utf-8 -*-

import matplotlib.pyplot as plt
input = [0, 1, 2, 3, 4, 5, 6, 7, 8]
square = [1, 3, 0, 4, 6, 9, 12, 14, 18]

plt.plot(input, square, linewidth = 3)  # 设置input为x轴, square为y轴
plt.title("test", fontsize = 16)        # 标题字号大小
plt.xlabel("x", fontsize = 12)          # fontsize指的是x这个坐标轴标题的字号大小
plt.ylabel("y", fontsize = 12)
plt.tick_params(axis = 'both', labelsize = 10)    # 刻度字体大小
plt.show()
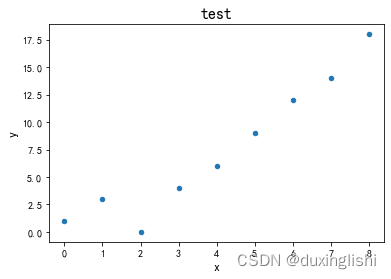
散点图
# -*- coding: utf-8 -*-

import matplotlib.pyplot as plt
input = [0, 1, 2, 3, 4, 5, 6, 7, 8]
square = [1, 3, 0, 4, 6, 9, 12, 14, 18]

plt.scatter(input, square, s = 20)          # 绘制散点图,s是散点的直径/大小
# plt.plot(input, square, linewidth = 3)  # 设置input为x轴, square为y轴
plt.title("test", fontsize = 16)        # 标题字号大小
plt.xlabel("x", fontsize = 12)          # fontsize指的是x这个坐标轴标题的字号大小
plt.ylabel("y", fontsize = 12)
plt.tick_params(axis = 'both', labelsize = 10)    # 刻度字体大小
plt.show()
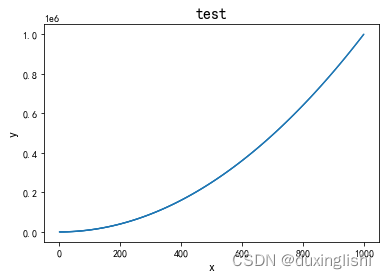
批量数据生成
# -*- coding: utf-8 -*-

import matplotlib.pyplot as plt

x_values = list(range(1, 1001)) # 这里借助list这个数据结构实现的
y_values = [x**2 for x in x_values]

# 绘制散点图,edgecolor默认是黑色轮廓填充蓝色,s是散点的直径/大小
plt.scatter(x_values, y_values, edgecolor = 'none', s = 2)
# plt.plot(input, square, linewidth = 3)  # 设置input为x轴, square为y轴
plt.title("test", fontsize = 16)        # 标题字号大小
plt.xlabel("x", fontsize = 12)          # fontsize指的是x这个坐标轴标题的字号大小
plt.ylabel("y", fontsize = 12)
plt.tick_params(axis = 'both', labelsize = 10)    # 刻度字体大小
# plt.show()
plt.savefig('test.png', bbox_inches = 'tight')  #保存图表,其中bbox_inches可忽略,作用是删除图表空域边缘


 被折叠的 条评论
为什么被折叠?
被折叠的 条评论
为什么被折叠?
 到【灌水乐园】发言


