


CSIT-540 Spring 2007 - Project 4 - Benchmarking Graphics Hardware
The purpose of this assignment is to explore the performance characteristics of graphics hardware.
Part IExplore the crossover point between geometry and rasterization. (5 points)
Modern graphics hardware can be generalized into two major components: geometry subsystem and rasterization subsystem. The performance of the graphics system is determined by the slower of these two. For small triangles, the rasterization per triangle is small so the system is limited by the rate at which vertices (geometry) can be processed. On the contrary, for large triangles, the fragment operations (rasterization) dominate the rendering pipeline.
Provided for this assignment is a sample benchmarking application called GfxBench (updated on 4/15 Sun). It measures the fill rate and triangle rate using OpenGL. Modify the GfxBench application to examine the crossover point between geometry limited rendering and rasterization limited rendering. Graph the triangle rate as a function of triangle size for regular smooth-shaded triangles.
Graph your results in a two page (including graphs) and point out what is the crossover point? Be sure to present related information: PC system, graphics hardware, display settings, and window resolution, etc., you used in doing this project.
Part II
Crossover points for 1) textured triangles, 2) lit triangles, and 3) textured+lit triangles. (5 points)
More than just using smooth-shaded triangles, here you need to modify the program to determine the triangle rate, fill rate, and crossover point for the following three cases: textured triangles, lit triangles, and textured+lit triangles.
Again, graph and explain your results in no more than a two-page (including graphs) write up. Compare your results (four cases altogether including the case in Part I) and explain why they may exist. Be sure to discuss any interesting details you might find.
Part III
Rasterization: Scanline independence? (5 points)
What is the effect of triangle shape on rasterization performance? Is there a difference in long, thin vertical triangles verses long, thin horizontal triangles? Modify the GfxBench application to test a variety of triangle shapes. Also graph fill rate as a function of triangle size. Present your results and discuss what this tells you about how the rasterizer works.
Likewise, graph your results in a one page (including graphs) write out and point out your findings.
CSIT 540 Spring 2007 – Project 4
Benchmarking Graphics Hardware
Track 8
| Member | Student No. |
| Chen Yi | 06769098 |
Part I – Explore the crossover point between geometry and rasterization:
| CPU | Intel Pentium M 1.85GHz |
| Memory | DDR533 1.5G |
| PC System | Windows XP Pro sp2 |
| Graphic Card | ATI Mobility Radeon X300 |
| Screen Resolution | 1400 x 1050 |
| Display color | 32 bit |
We have to modify the supplied gfxBench program so that we are able to benchmark the Triangle and Fill Rates under various conditions. The following graph shows our result information. And the fill rate for regular smooth-shaded triangle is 753.83 MPix/second.
| Vendor: Renderer: Version: Visual: Geometry: Screen: | ATI Technologies Inc. MOBILITY RADEON X300 x86/SSE2 2.0.5285 WinXP Release RGBA=<8,8,8,8> Z=<24> double=1 1024x1024+4+23 1400x1050 |
Because the windows size is 1024x1024 and 50x50 mesh, so we can let the triangle size from 1 up to 14. The figure1 shows the triangle rate as a function of triangle size for regular smooth-shaded triangles.
The computer achieved 40.5 Million triangles per second as the maximum. We record the triangle rates for 14 pixels. The curve we can see in the figure1 almost is falling down. But the falling rate for each pixel is different. We have known, for small triangles, the rasterization per triangle is small so the system is limited by the rate at which vertices (geometry) can be processed. On the contrary, for large triangles, the fragment operations (rasterization) dominate the rendering pipeline. As we expected, the triangle rate does not change sharply until triangle size increases up to a point. This point should be the crossover point between geometry and rasterization, that is, the bottleneck shifting geometry system to rasterization system and vice versa. We take the crossover point between geometry limited rendering and rasterization limited rendering is at triangle size of 5 pixels.
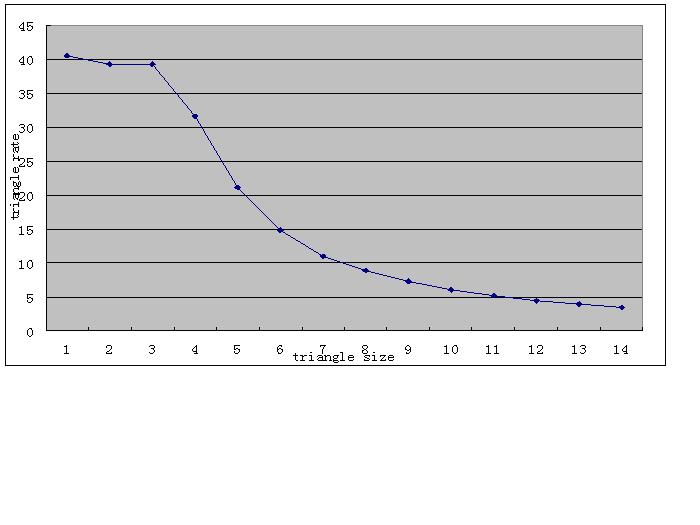
Figure 1 50x50
I also try to change 50x50 mesh to 30x30 mesh. I can let the triangle size from 1 up to 24. Then I get the new graph figure 2.
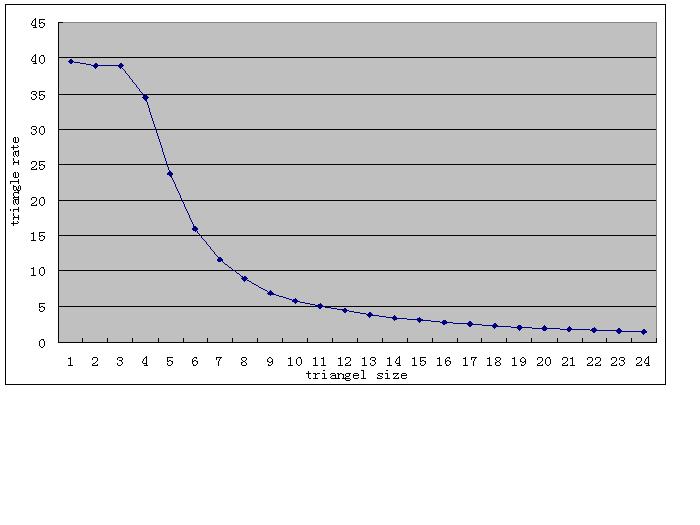
Figure 2 30x30
In this graph we still can take 3 to be the crossover point between geometry limited rendering and rasterization limited rendering.
Part II – Crossover points for textured triangles, lit triangles, and textured+lit triangles
To do the part II, we proceeded to modify the gfxbench program. The original gfxbench program was designed only for smooth shaded benchmarking. We modified the code to allow for lighting and texture mapping facilities. Texture mapping was accomplished by providing a pair of texture coordinates to each vertex instead of a random RGB color value. And the texture size is 64x64. We also used a lighting model, using 5 light sources to confirm we can see the lighting effect.
Now we get the figure 3
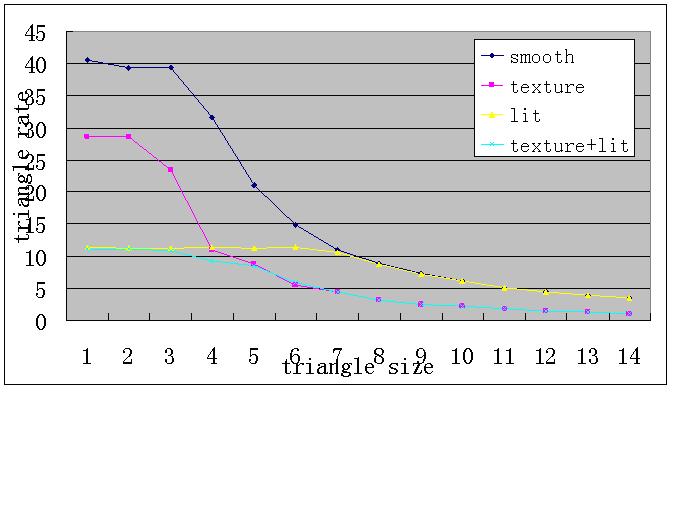
Figure 3
From the above graph, we can get crossover point under different conditions in the following table
| Condition | Approximate crossover point (edgelength in pixel) |
| Smooth shaded | 3 |
| Lit | 3 |
| Texture | 2 |
| Texture+lit | 2 |
Ø Triangle rate for small triangles between smooth shaded and textured and for lit and textured lit are higher than the large triangle size.
Ø We note that under textured conditions, the crossover point occurs at triangle size 2 as opposed to triangle size 3. Furthermore the corresponding rate of change in triangle rate is more severe than smooth shaded. This observation verifies that textured conditions increased rasterization processing. It requires the system to spend significantly more time per triangle as the triangle size increases, thus causing the crossover point to occur earlier.
Ø We observe a marked increase in performance degradation between smooth shaded and textured and for lit and textured lit. Texture mapping lightens the geometry processing workload since vertices do not have colors assigned. Thus for small triangles, we observe a marked improvement in triangle rates. Since texturing is a per-pixel operation, thus for large triangles, where there are more pixels to fill-in, rasterization performance drops significantly.
Ø We find at the beginning of triangle rate for texture+lit approximates the triangle rate for lit. This situation is changed till the triangle rate for lit intersects the triangle rate for texture. After this intersection point, the triangle rate for texture+lit approximates the triangle rate for texture. Because at beginning, the bottleneck of triangle rate for texture+lit is triangle rate for lit. But after the intersection point, the triangle rate for texture becomes the bottleneck.
Ø Lower triangle rates for small triangle sizes with lighting. Following the crossover point, the triangle rates become similar between lit and unlit conditions. This confirms that lighting is a per-vertex operation and done largely by the geometry engine. Geometry calculations are simply taking longer because of the additional overhead of including a light source.
Part III – Rasterization
We define the ratio of a triangle by the following expression, ratio = height / width. We modify the gfxbench program to divide a square into several long thin vertical rectangle and long thin horizontal rectangle. This way can get the fill rate for long thin vertical triangle and long thin horizontal triangle. Then we divide a square into n^2 squares and do the previous step. This way we can get the different triangle size. Now we draw the figure 4.
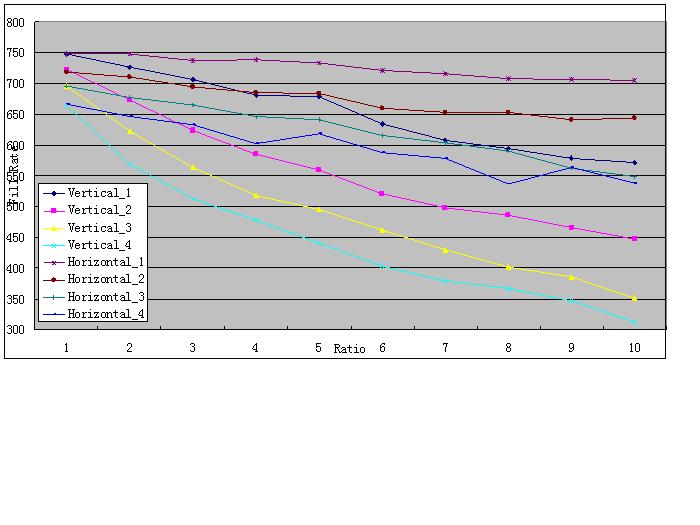
Figure 4
In figure 4 the number after vertical and horizontal means we divide a square into n^2 squares.
Now, we are able to observe the following:
Ø The long thin horizontal triangle with large ratios have better fill rate than long thin vertical triangles. But for small ratios their fill rate are approximate. This confirms that the order for scanline conversion affects rasterization performance in large triangles having similar areas but different shapes.
Ø The fill rate of long thin horizontal triangle is better than the fill rate of long thin vertical triangle with the same triangle size. Because the comparatively more horizontal scanlines compared to vertical scanlines used in rasterizing a large thin horizontal triangle. We can therefore draw a conclusion that long and thin horizontal triangles mitigate rendering complexity for graphics card.


 199
199

 被折叠的 条评论
为什么被折叠?
被折叠的 条评论
为什么被折叠?
 到【灌水乐园】发言


