


先引入echarts,npm下载,或者cdn引入即可
<div id="capability-Attribute" style="width: 20rem;height: 35rem;" class="top-echrts"></div>
capabilityAttribute (){
// 基于准备好的dom,初始化echarts实例
var myChart = echarts.init(
document.getElementById('capability-Attribute')
)
var option = {
tooltip: {
// show: false,
},
color: ['#00FDBB', '#00FDBB', '#00FDBB'],
legend: {
show:false
},
series: [
{
name: '一般',
type: 'pie',
//起始刻度的角度,默认为 90 度,即圆心的正上方。0 度为圆心的正右方。
startAngle: -55,
hoverAnimation: false,
tooltip: {},
radius: ["30%", "47%"],
center: ['50%', '80%'],
label: {
normal: {
show: false,
position: 'center',
color: '#fff',
formatter: function (params) {
return params.value
},
},
},
labelLine: {
normal: {
show: false
}
},
data: [{
value: 100,
itemStyle: {
normal: {
color: "rgba(80,150,224,0)"
}
}
},
{
value: 270,
itemStyle: {
normal: {
color: "rgba(80,150,224,1)"
}
}
},
{
value: 100,
itemStyle: {
normal: {
color: "rgba(80,150,224,0.1)"
}
}
},
]
},
{
name: '严重',
type: 'pie',
startAngle: -55,
radius: ['50%', '67%'],
center: ['50%', '80%'],
legendHoverLink: false,
hoverAnimation: false,
avoidLabelOverlap: false,
label: {
normal: {
show: false,
position: 'center'
},
emphasis: {
show: true,
textStyle: {
fontSize: '30',
fontWeight: 'bold'
}
}
},
labelLine: {
normal: {
show: false
}
},
data: [{
value: 75,
itemStyle: {
normal: {
color: "rgba(35,206,167,0)"
}
}
},
{
value: 210,
itemStyle: {
normal: {
color: "rgba(35,206,167,1)"
}
}
},
{
value: 75,
itemStyle: {
normal: {
color: "rgba(35,206,167,0.1)"
}
}
},
]
},
{
name: '危急',
type: 'pie',
startAngle: -55,
hoverAnimation: false,
radius: ["70%", "87%"],
center: ['50%', '80%'],
label: {
normal: {
show: false,
position: 'center'
},
emphasis: {
show: true,
textStyle: {
fontSize: '10',
fontWeight: 'bold'
}
}
},
labelLine: {
normal: {
show: false
}
},
data: [{
value: 85,
itemStyle: {
normal: {
color: "rgba(1,218,220,0)"
}
}
},
{
value: 240,
itemStyle: {
normal: {
color: "rgba(1,218,220,1)"
}
}
},
{
value: 85,
itemStyle: {
normal: {
color: "rgba(1,218,220,0.1)"
}
}
},
]
}
]
};
myChart.setOption(option);
},
效果图
带尺寸的图片:

根据series里data的两个value值来进行调节: 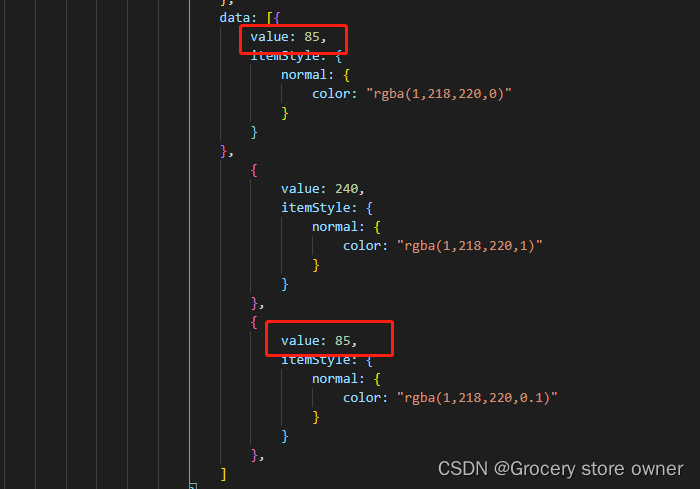


 790
790


 被折叠的 条评论
为什么被折叠?
被折叠的 条评论
为什么被折叠?
 到【灌水乐园】发言


