


目录
在Prometheus节点上修改配置信息,来抓取node节点上的信息
一、Prometheus静态服务发现部署
| prometheus | 192.168.68.10 | prometheus-2.27.1.linux-amd64.tar.gz |
|---|---|---|
| node1 | 192.168.68.30 | node_exporter-1.1.2.linux-amd64.tar.gz |
| node2 | 192.168.68.105 | node_exporter-1.1.2.linux-amd64.tar.gz |
| node3 | 192.168.68.40 | node_exporter-1.1.2.linux-amd64.tar.gz |
1.准备工作
关闭防火墙及安全机制,修改主机名
prometheus(192.168.68.10)
[root@localhost ~]# systemctl stop firewalld
[root@localhost ~]# setenforce 0
[root@localhost ~]# hostnamectl set-hostname prometheus
[root@localhost ~]# su
[root@prometheus ~]# ntpdate ntp1.aliyun.com  ##时间同步
node
[root@localhost ~]# systemctl stop firewalld
[root@localhost ~]# setenforce 0
[root@localhost ~]# hostnamectl set-hostname node1/2/3
[root@localhost ~]# su
[root@node1 ~]# ntpdate ntp1.aliyun.com
2.部署prometheus
[root@prometheus /opt]# ls
prometheus-2.27.1.linux-amd64.tar.gz
[root@prometheus /opt]# tar zxf prometheus-2.27.1.linux-amd64.tar.gz -C /usr/local/
[root@prometheus /opt]# cd /usr/local/prometheus-2.27.1.linux-amd64/
[root@prometheus /usr/local/prometheus-2.27.1.linux-amd64]# ./prometheus ##启动Prometheus
[root@prometheus /usr/local/prometheus-2.27.1.linux-amd64]# netstat -natp |grep 9090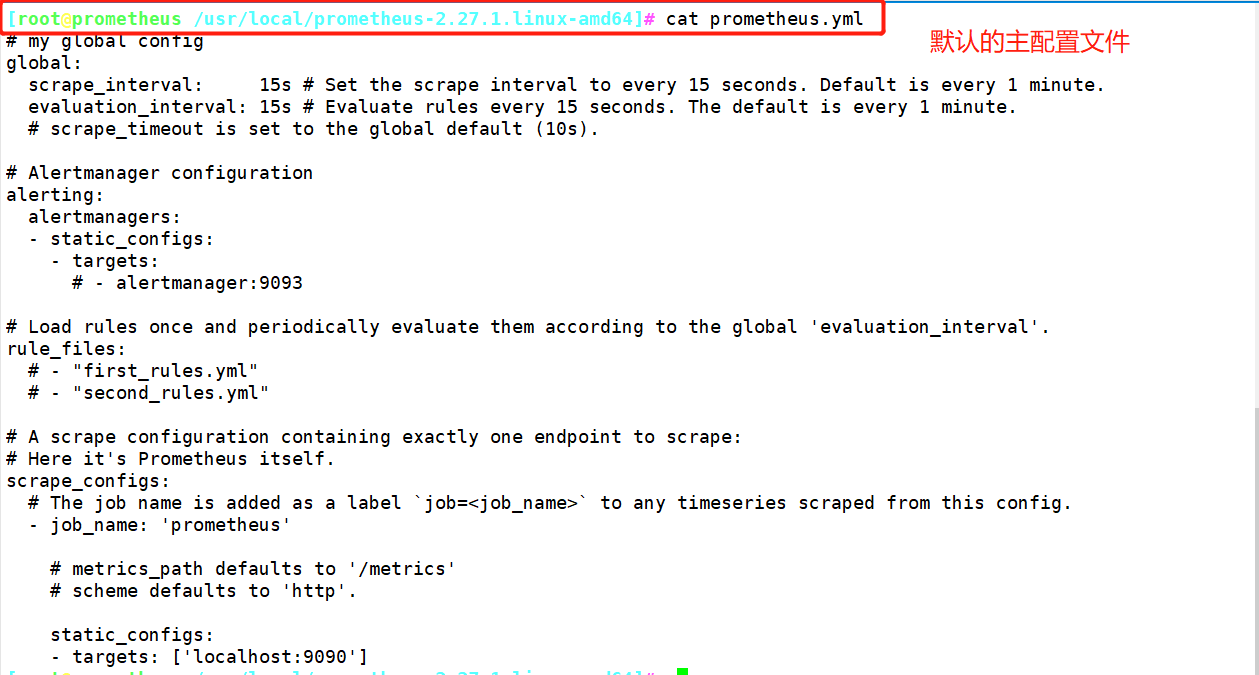

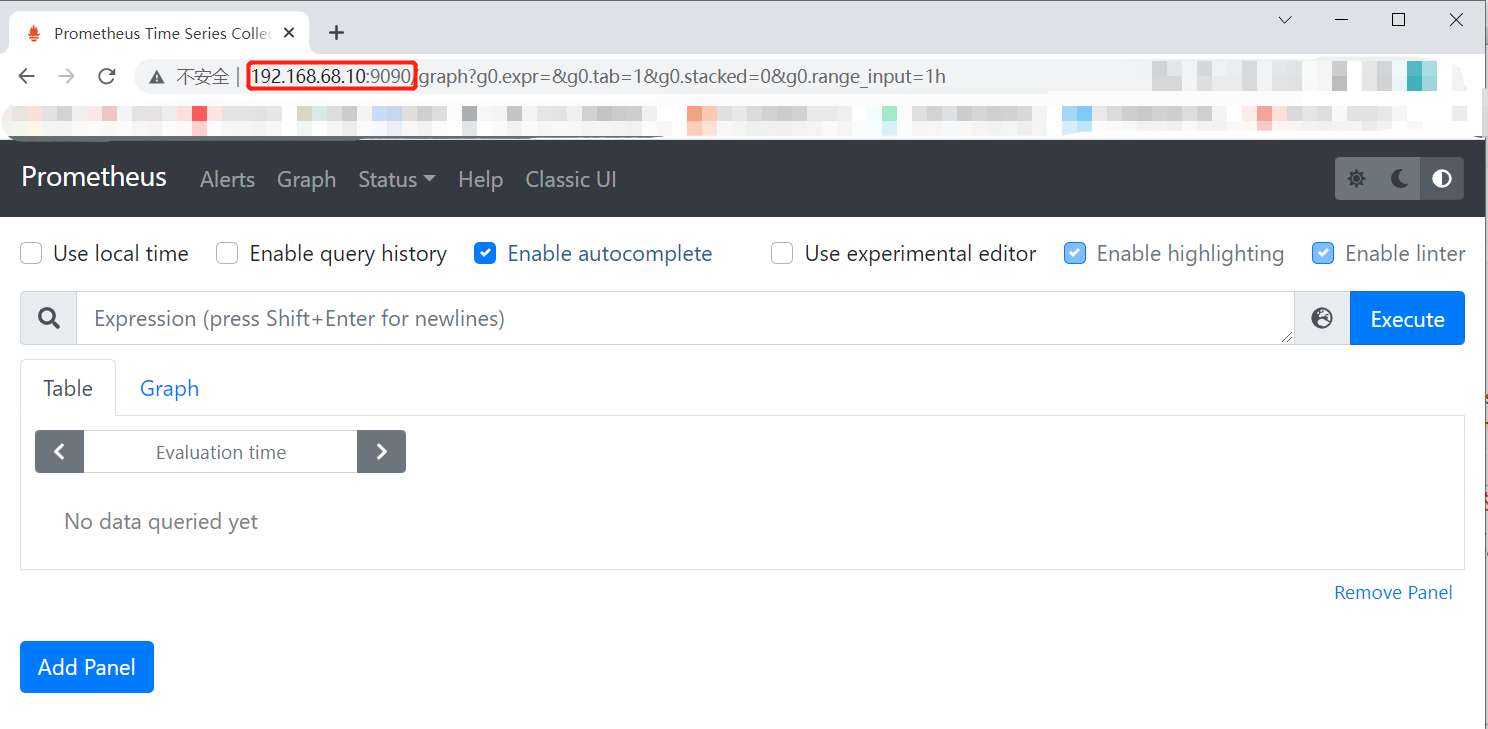
访问web页面(表达式浏览器)
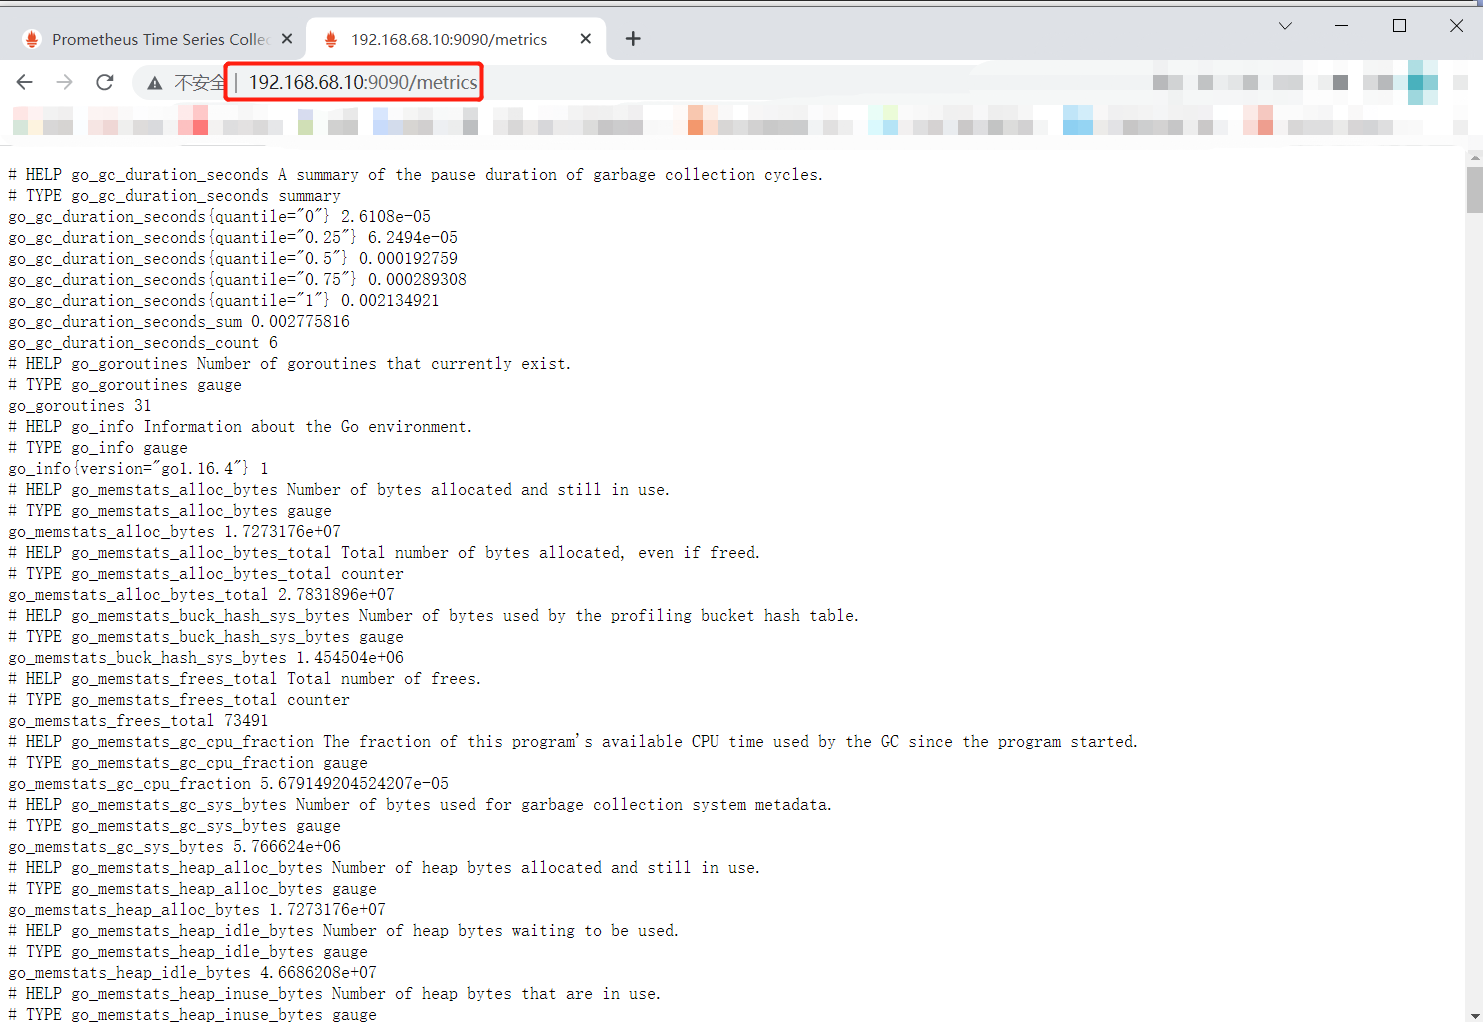
查看采集数据
http://192.168.68.10:9090/metrics
3.部署监控其他节点
192.168.68.30node1/2/3
##将node_exporter-1.1.2.linux-amd64.tar.gz压缩包传入/opt目录下
[root@node1 /opt]# ls
john-1.8.0  john-1.8.0.tar.gz  node_exporter-1.1.2.linux-amd64.tar.gz  shadow.txt
[root@node1 /opt]# tar zxf node_exporter-1.1.2.linux-amd64.tar.gz
[root@node1 /opt]# cd node_exporter-1.1.2.linux-amd64/
[root@node1 /opt/node_exporter-1.1.2.linux-amd64]# cp node_exporter /usr/local/bin/  ##加入全局
[root@node1 /opt/node_exporter-1.1.2.linux-amd64]# ./node_exporter 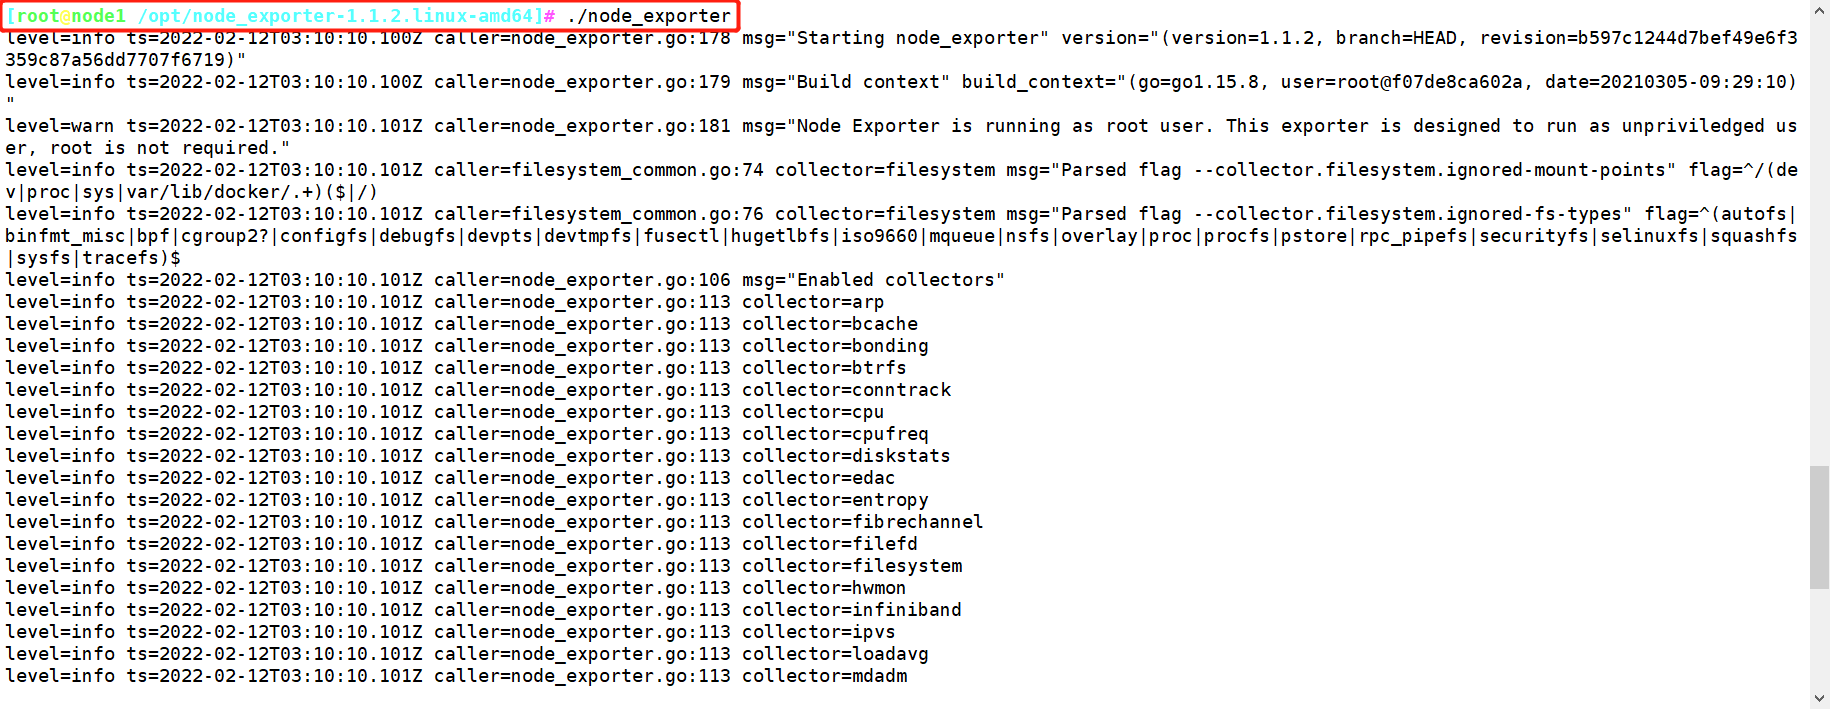

在Prometheus节点上修改配置信息,来抓取node节点上的信息
[root@prometheus /usr/local/prometheus-2.27.1.linux-amd64]# vim prometheus.yml
 30   - job_name: 'nodes'
 31     static_configs:
 32     - targets:
 33       - 192.168.68.30:9100
 34       - 192.168.68.105:9100
 35       - 192.168.68.40:9100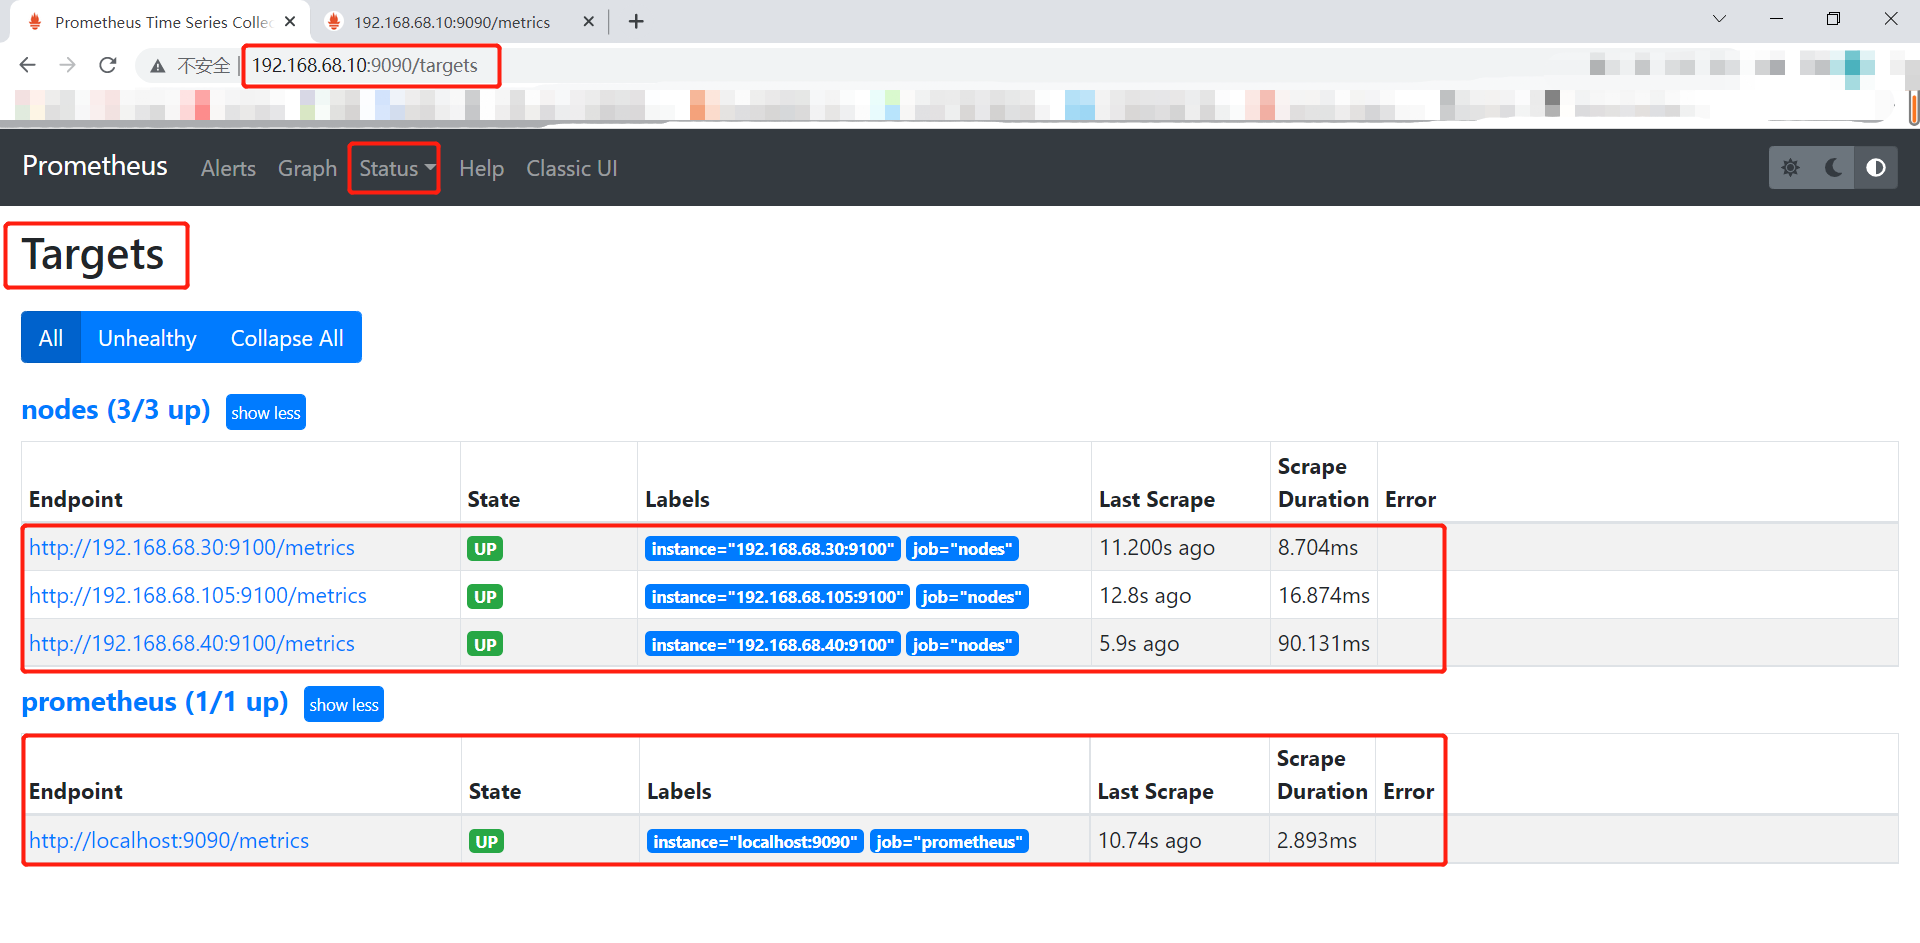
[root@prometheus /usr/local/prometheus-2.27.1.linux-amd64]# ./prometheus 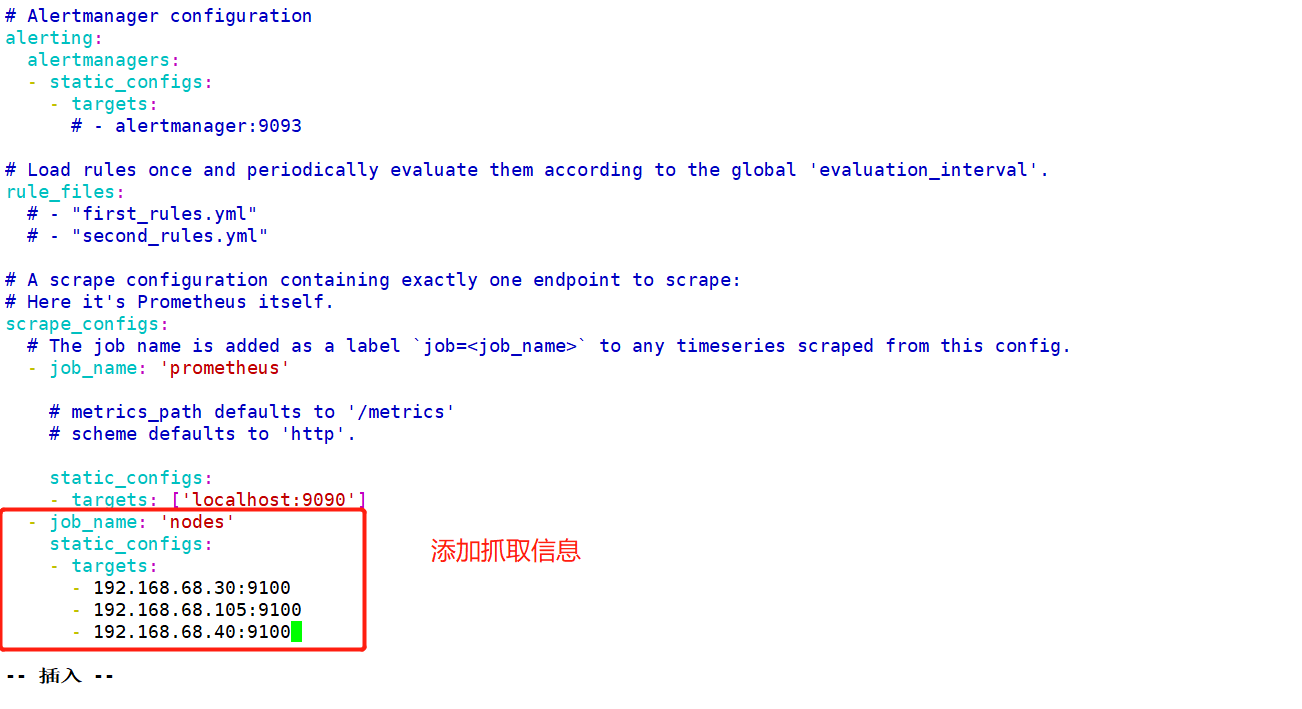
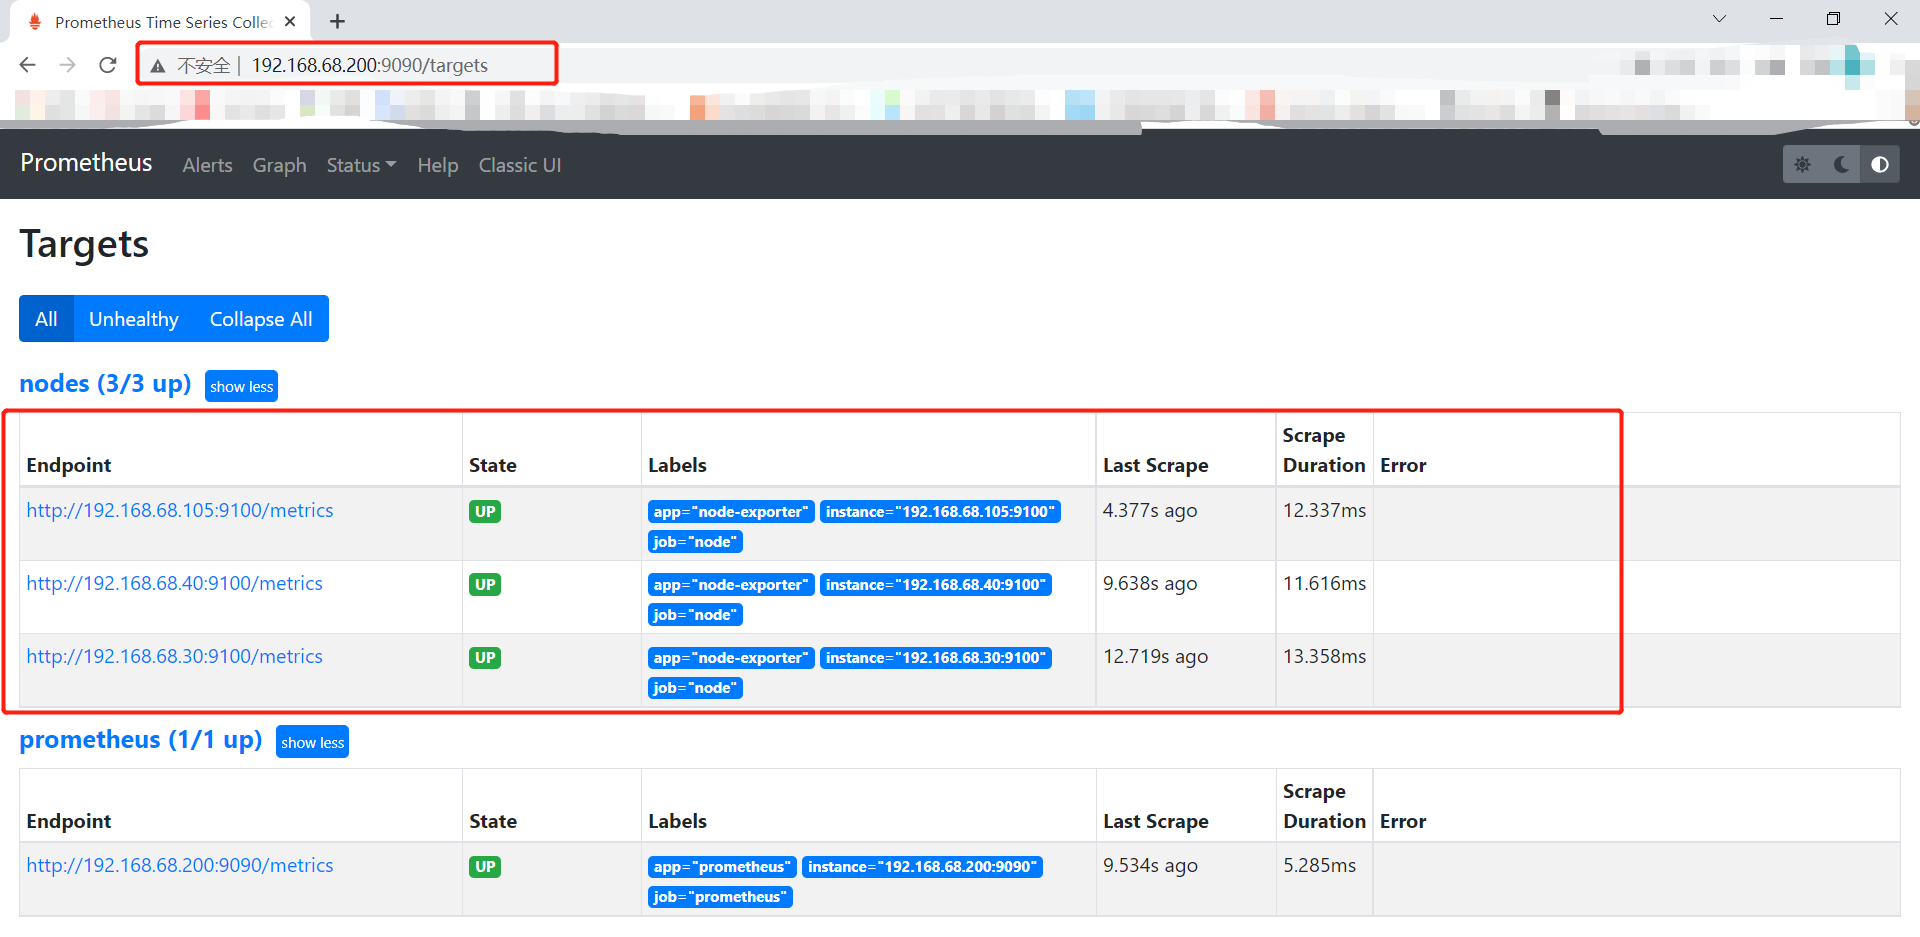
此时访问web页面就可以查看到node节点的信息
二、基于文件的服务发现部署
比基于静态形式好一点点
只需要更改node_centos.yml和Prometheus_server.yml文件内容,不需要停止服务
1.部署prometheus
[root@prometheus /usr/local/prometheus-2.27.1.linux-amd64]# mkdir files_sd
[root@prometheus /usr/local/prometheus-2.27.1.linux-amd64/files_sd]# vim prometheus.yml
# my global config
# Repo: http://gitlab.magedu.com/MageEdu/prometheus-configs/
global:
scrape_interval: 15s # Set the scrape interval to every 15 seconds. Default is every 1 minute.
evaluation_interval: 15s # Evaluate rules every 15 seconds. The default is every 1 minute.
# scrape_timeout is set to the global default (10s).
# Alertmanager configuration
alerting:
# my global config
# Author: MageEdu <mage@magedu.com>
# Repo: http://gitlab.magedu.com/MageEdu/prometheus-configs/
global:
scrape_interval: 15s # Set the scrape interval to every 15 seconds. Default is every 1 minute.
evaluation_interval: 15s # Evaluate rules every 15 seconds. The default is every 1 minute.
# scrape_timeout is set to the global default (10s).
# Alertmanager configuration
alerting:
scrape_interval: 15s # Set the scrape interval to every 15 seconds. Default is every 1 minute.
evaluation_interval: 15s # Evaluate rules every 15 seconds. The default is every 1 minute.
# scrape_timeout is set to the global default (10s).
# Alertmanager configuration
alerting:
alertmanagers:
- static_configs:
- targets:
# - alertmanager:9093
# Load rules once and periodically evaluate them according to the global 'evaluation_interval'.
rule_files:
# - "first_rules.yml"
# - "second_rules.yml"
# A scrape configuration containing exactly one endpoint to scrape:
# Here it's Prometheus itself.
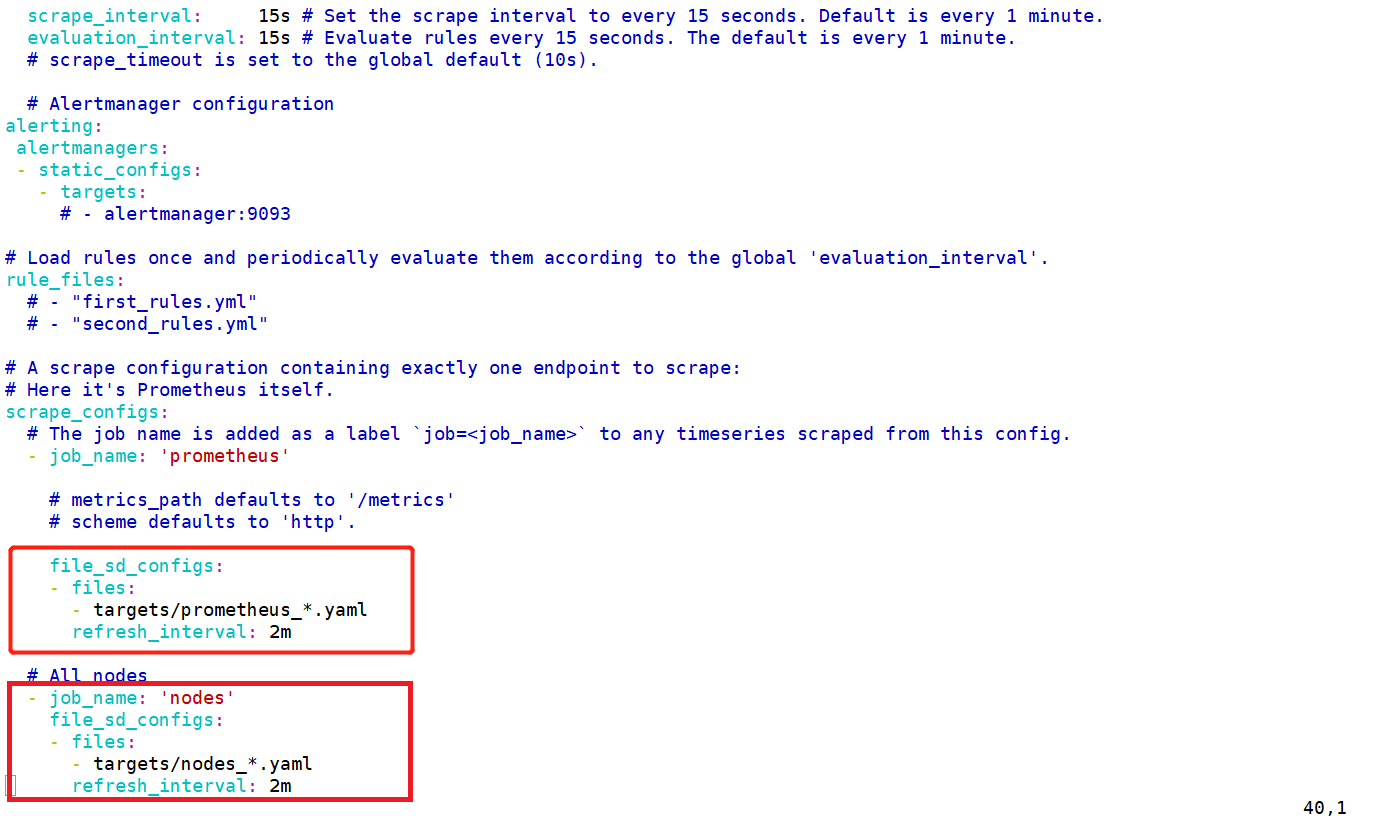
scrape_configs:
# The job name is added as a label `job=<job_name>` to any timeseries scraped from this config.
- job_name: 'prometheus'
# metrics_path defaults to '/metrics'
# scheme defaults to 'http'.
file_sd_configs:
- files:
- targets/prometheus_*.yaml
refresh_interval: 2m
# All nodes
- job_name: 'nodes'
file_sd_configs:
- files:
- targets/nodes_*.yaml
refresh_interval: 2m
[root@prometheus /usr/local/prometheus-2.27.1.linux-amd64/files_sd]# mkdir targets
[root@prometheus /usr/local/prometheus-2.27.1.linux-amd64/files_sd/targets]# vim nodes_centos.yaml
- targets:
  - 192.168.68.30:9100
  - 192.168.68.105:9100
  - 192.168.68.40:9100
  labels:
    app: node-exporter
    job: node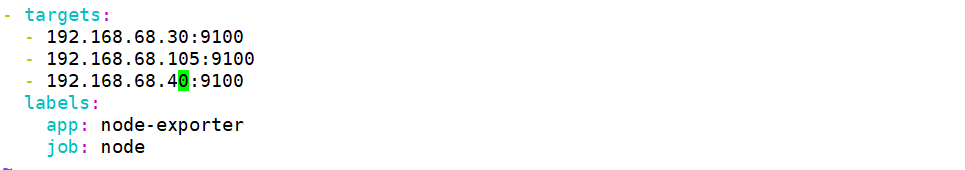
[root@prometheus /usr/local/prometheus-2.27.1.linux-amd64/files_sd/targets]# vim prometheus_server.yaml
- targets:
  - 192.168.68.10:9090
  labels:
    app: prometheus
    job:  prometheus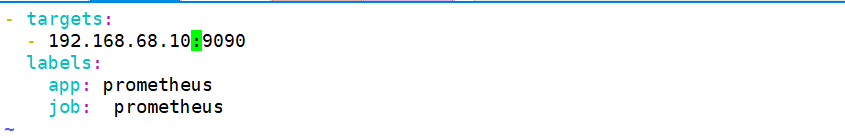
[root@prometheus /usr/local/prometheus-2.27.1.linux-amd64]# ./prometheus --config.file=./files_sd/prometheus.yml
##指定yml文件启动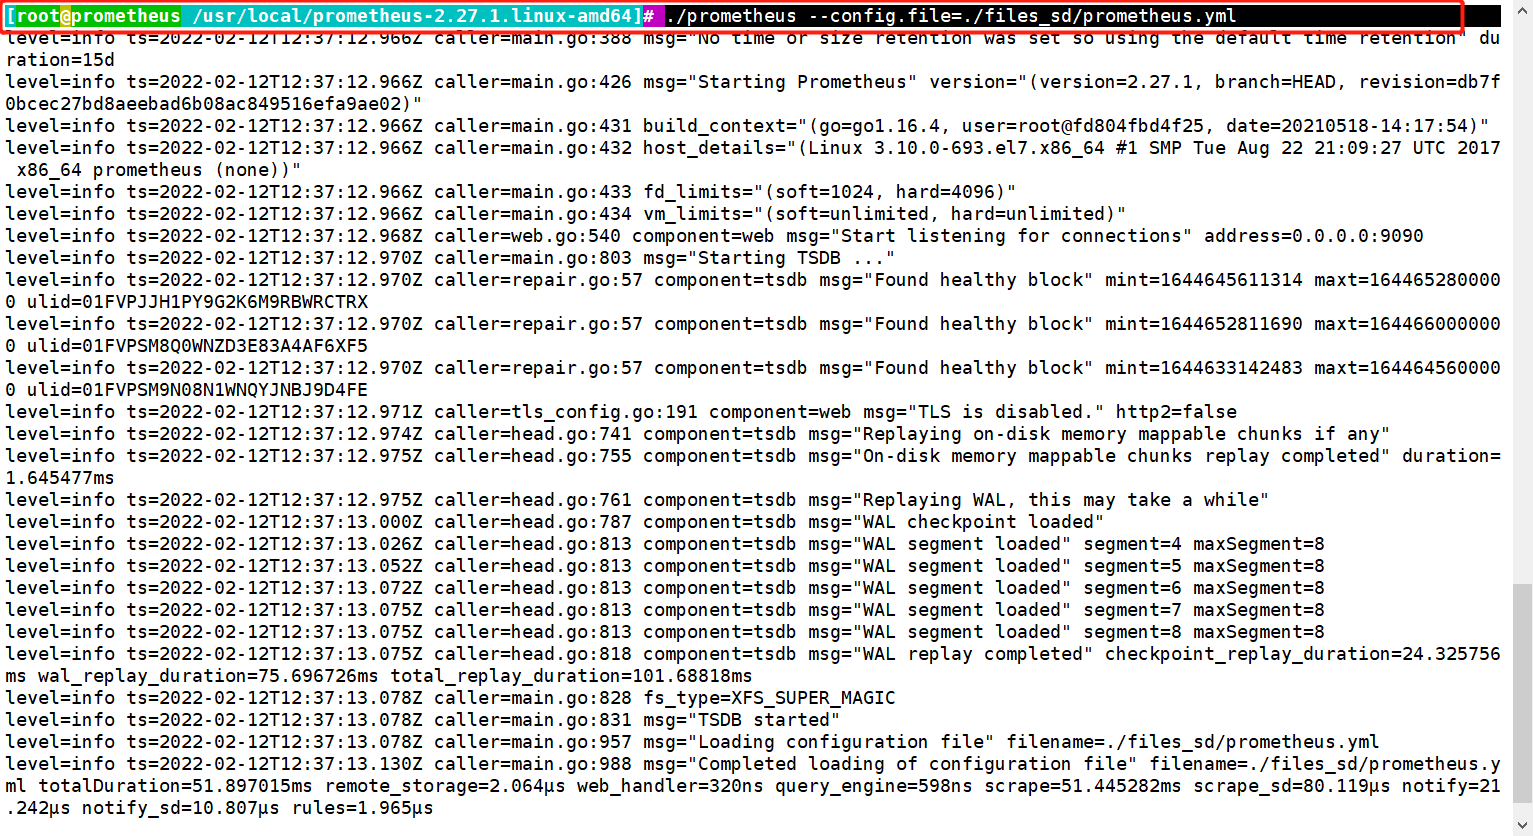
三、DNS
基于DNS的服务发现针对一组DNS域名进行定期查询,以发现待监控的目标查询时使用的DNS服务器由/etc/resolv.conf文件指定; 该发现机制依赖于A、AAAA和SRv资源记录,且仅支持该类方法
www.example.com -实际提供服务的主机名。同时SRV可以指定在端口上对应哪个service prometheus 基于Dws的服务中的SRV记录,让prometheus发现指定target上对应的端口对应的是exporter或instrumentation。
四、consul
一款基于Golang开发的开源工具,主要面向分布式,服务化的系统提供服务注册、服务发现和配置管理的功能提供服务注册/发现、健康检查、Key/Value存储、多数据中心和分布式一致性保证等功能
#将consul压缩包传到/usr/local/bin下
[root@prometheus /usr/local]# rz -E
rz waiting to receive.
[root@prometheus /usr/local]# unzip consul_1.9.0_linux_amd64.zip -d /usr/local/bin
##启动开发者模式
##consul开发者模式,可以快速开启单节点的consul服务,具有完整功能,方便开发测试
[root@prometheus /usr/local]# mkdir -pv /consul/data
[root@prometheus /usr/local]# mkdir /etc/consul
[root@prometheus /usr/local]# cd /etc/consul/
[root@prometheus /etc/consul]# consul agent -dev -ui -data-dir=/consul/data/ \
-config-dir=/etc/consul/ -client=0.0.0.0
agent -dev:运行开发模式
agent -server:运行server模式
-ui:ui界面
-data-dir:数据位置
/etc/consul:可以以文件形式定义各个services的配置,也可以基于api接口直接配置
-client:监听地址
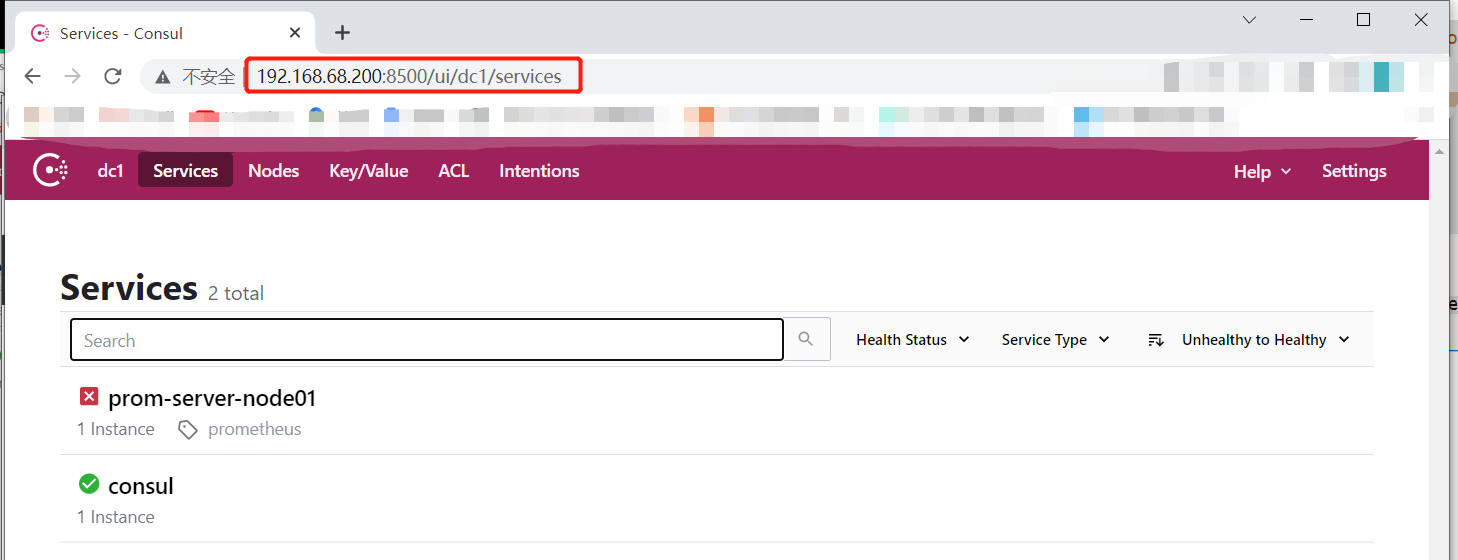
##编辑/etc/consul目录下的prometheus-servers.json配置文件
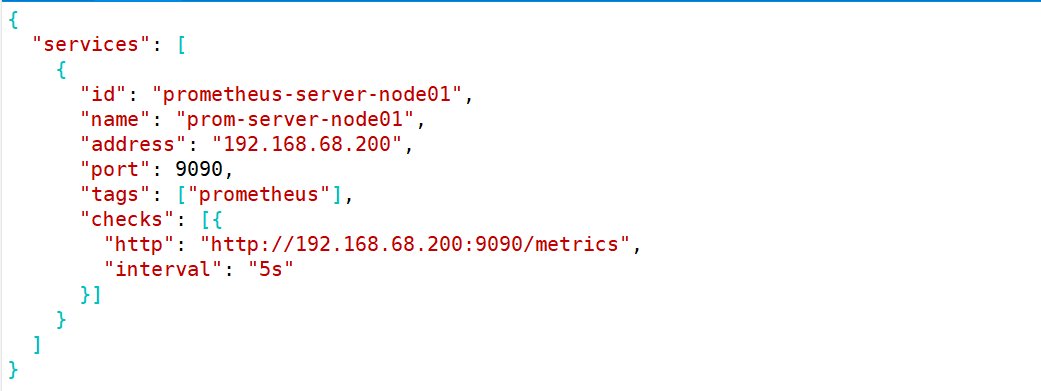
[root@prometheus /etc/consul]# vim prometheus-server.json
{
"services": [
{
"id": "prometheus-server-node01",
"name": "prom-server-node01",
"address": "192.168.68.200",
"port": 9090,
"tags": ["prometheus"],
"checks": [{
"http": "http://192.168.68.200:9090/metrics",
"interval": "5s"
}]
}
]
}
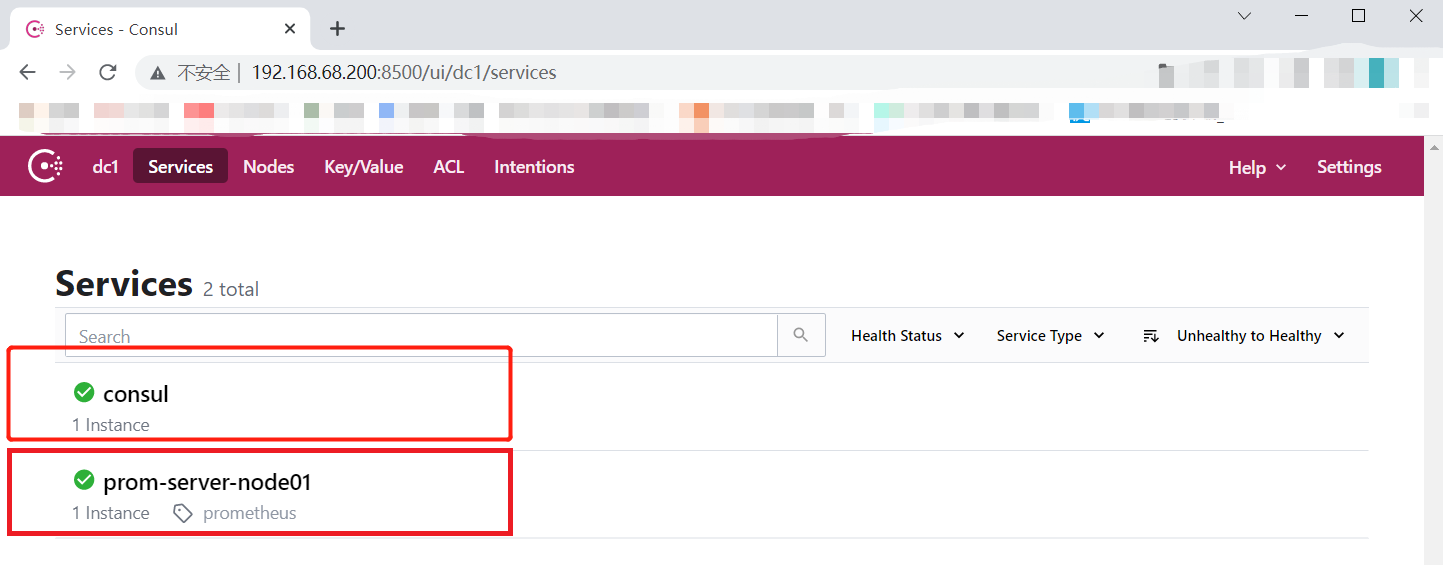
##重载配置文件
[root@prometheus /etc/consul]# consul reload
Configuration reload triggered
[root@prometheus /etc/consul]# netstat -natp |grep 8500
tcp 0 0 127.0.0.1:48508 127.0.0.1:8500 TIME_WAIT -
tcp6 0 0 :::8500 :::* LISTEN 5343/consul
[root@prometheus /etc/consul]# vim prometheus-server.json
[root@prometheus /usr/local/prometheus-2.27.1.linux-amd64]# mkdir consul_sd
[root@prometheus /usr/local/prometheus-2.27.1.linux-amd64]# cd consul_sd/
[root@prometheus /usr/local/prometheus-2.27.1.linux-amd64/consul_sd]# vim prometheus.yml
# my global config
# Author: MageEdu <mage@magedu.com>
# Repo: http://gitlab.magedu.com/MageEdu/prometheus-configs/
global:
scrape_interval: 15s # Set the scrape interval to every 15 seconds. Default is every 1 minute.
evaluation_interval: 15s # Evaluate rules every 15 seconds. The default is every 1 minute.
# scrape_timeout is set to the global default (10s).
# Alertmanager configuration
alerting:
alertmanagers:
- static_configs:
- targets:
# - alertmanager:9093
# Load rules once and periodically evaluate them according to the global 'evaluation_interval'.
rule_files:
# - "first_rules.yml"
# - "second_rules.yml"
# A scrape configuration containing exactly one endpoint to scrape:
# Here it's Prometheus itself.
scrape_configs:
# The job name is added as a label `job=<job_name>` to any timeseries scraped from this config.
- job_name: 'prometheus'
# metrics_path defaults to '/metrics'
# scheme defaults to 'http'.
consul_sd_configs:
- server: "192.168.68.200:8500"
tags:
- "prometheus"
refresh_interval: 2m
# All nodes
- job_name: 'nodes'
consul_sd_configs:
- server: "192.168.68.200:8500"
tags:
- "nodes"
refresh_interval: 2m
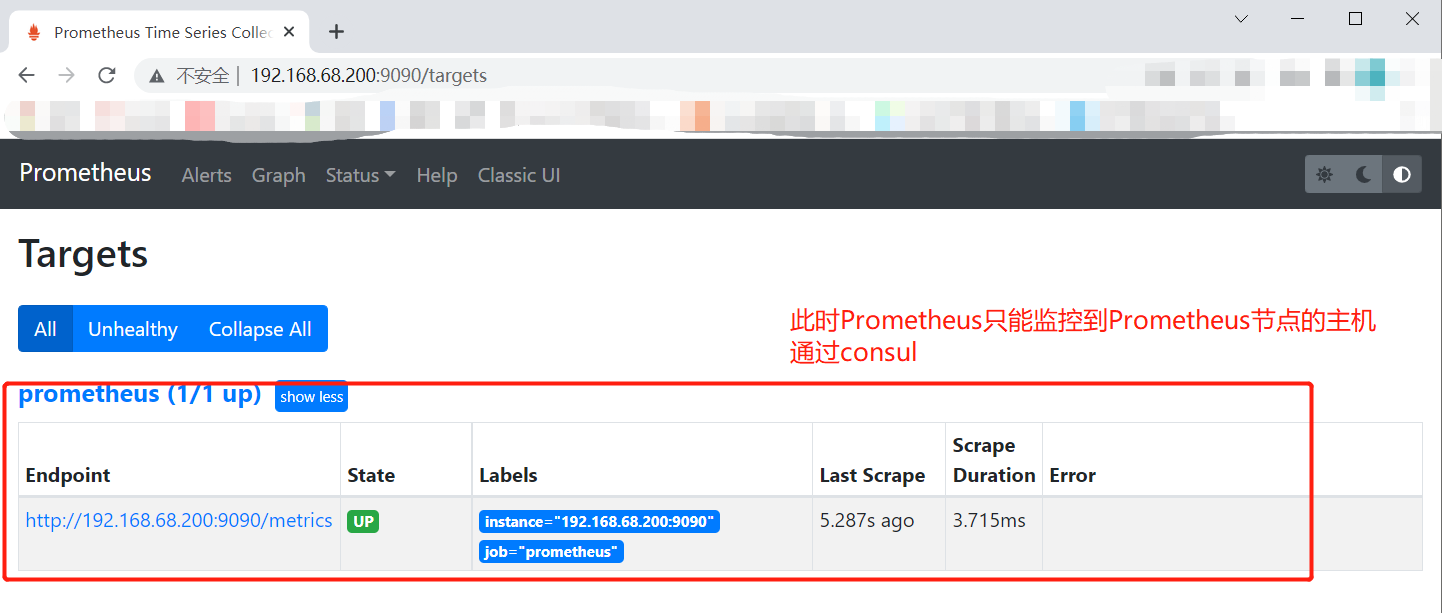
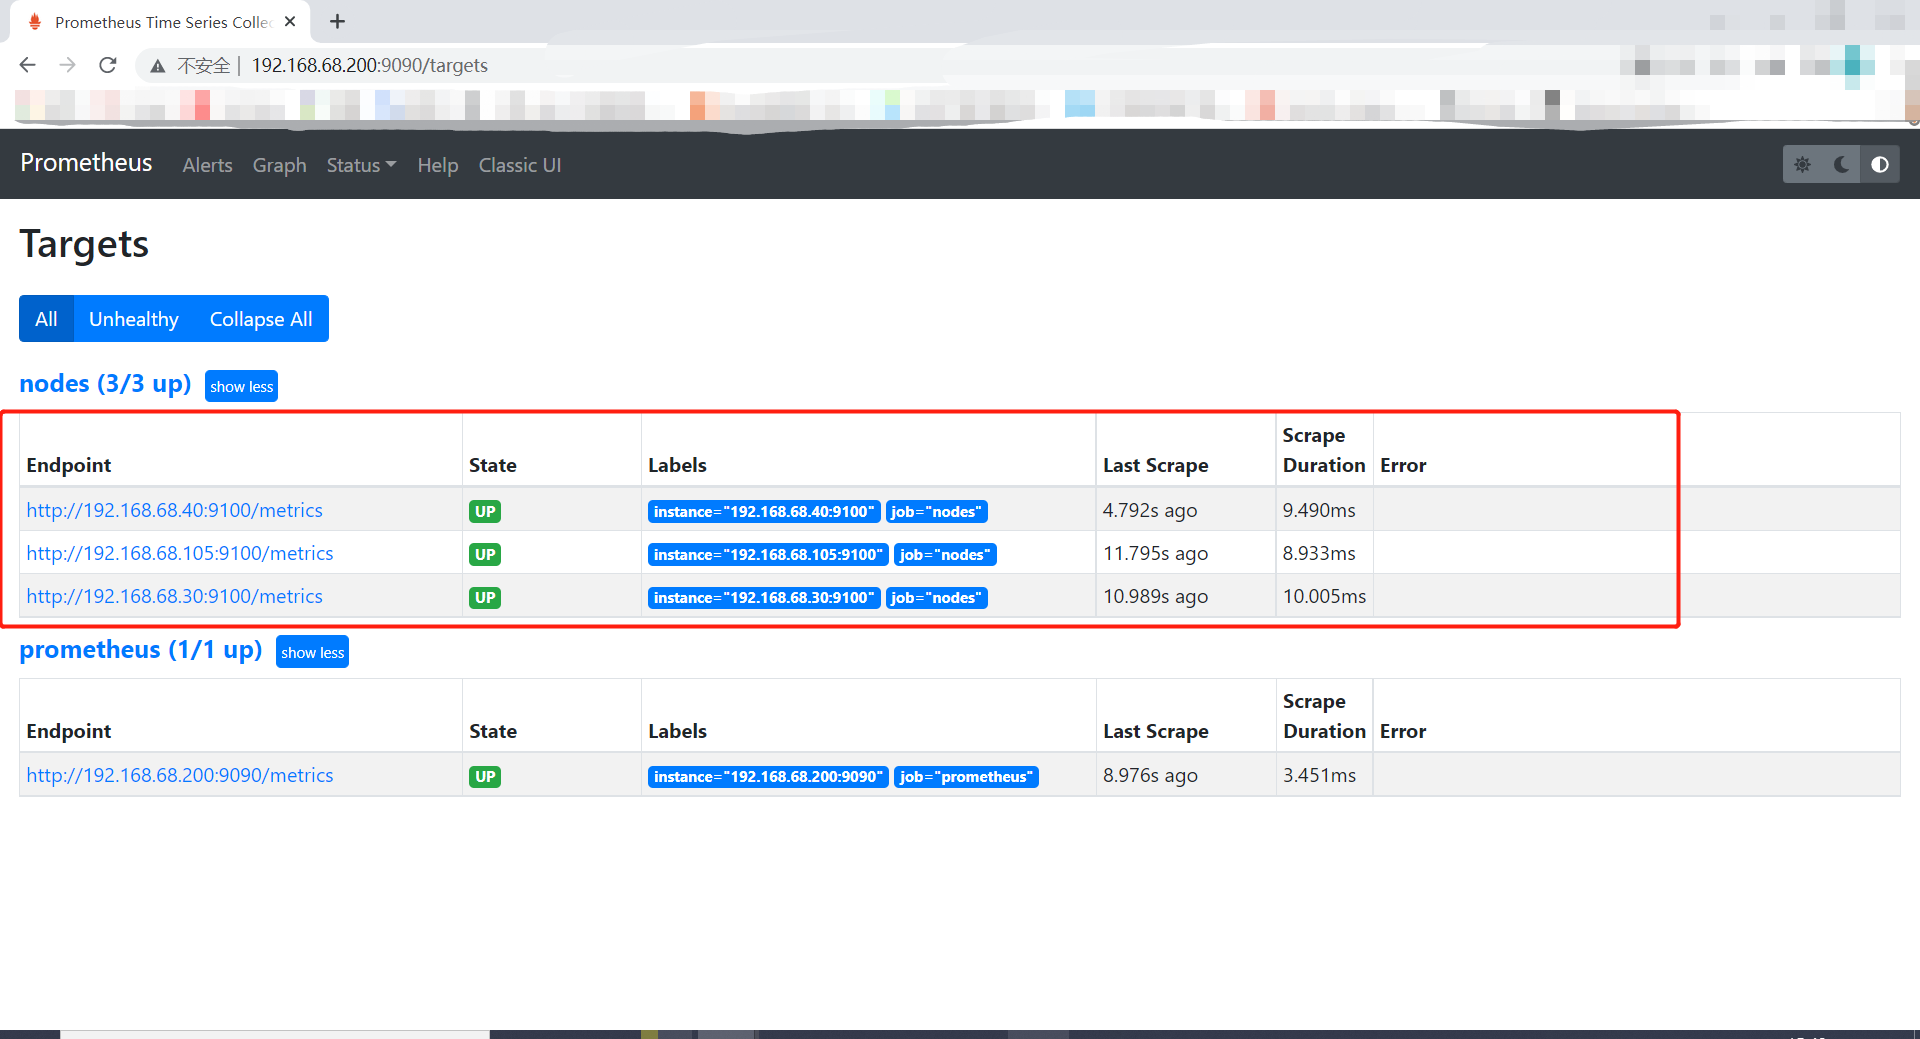
[root@prometheus /usr/local/prometheus-2.27.1.linux-amd64]# ./prometheus --config.file=./consul_sd/prometheus.yml开启了Prometheus之后节点就起来了
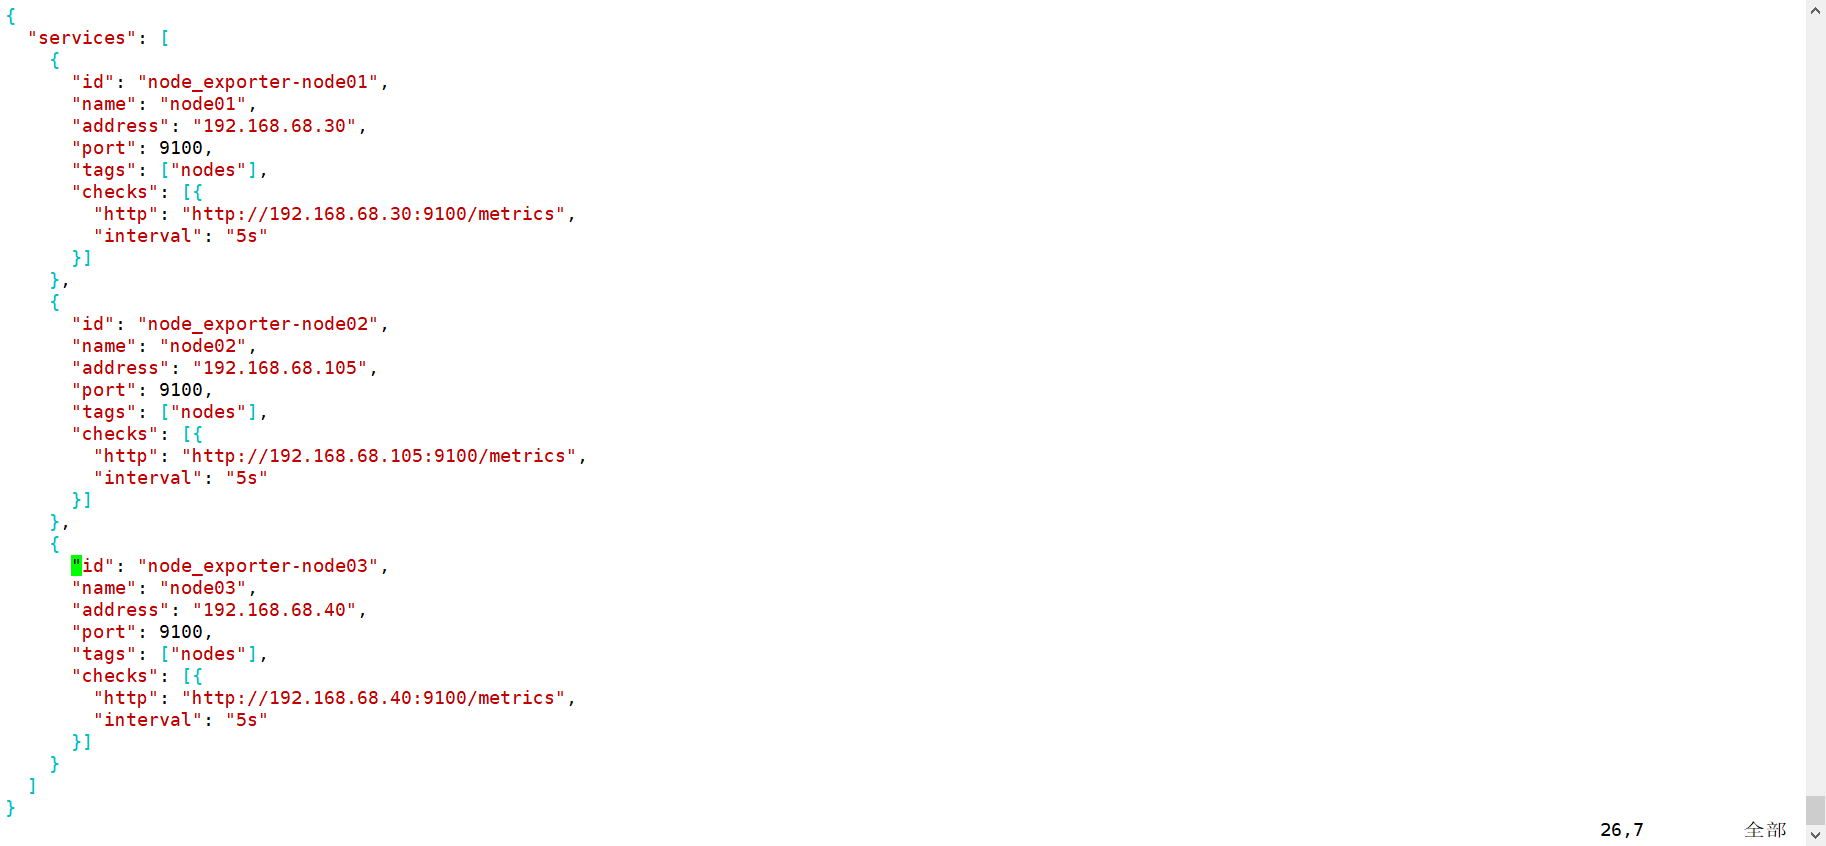
添加node节点
[root@prometheus /etc/consul]# vim nodes.json
{
  "services": [
    {
      "id": "node_exporter-node01",
      "name": "node01",
      "address": "192.168.68.30",
      "port": 9100,
      "tags": ["nodes"],
      "checks": [{
        "http": "http://192.168.68.30:9100/metrics",
        "interval": "5s"
      }]
    },
    {
      "id": "node_exporter-node02",
      "name": "node02",
      "address": "192.168.68.105",
      "port": 9100,
      "tags": ["nodes"],
      "checks": [{
        "http": "http://192.168.68.105:9100/metrics",
        "interval": "5s"
      }]
    },
    {
      "id": "node_exporter-node03",
      "name": "node03",
      "address": "192.168.68.40",
      "port": 9100,
      "tags": ["nodes"],
      "checks": [{
        "http": "http://192.168.68.40:9100/metrics",
        "interval": "5s"
      }]
    }
  ]
}
[root@prometheus /etc/consul]# consul reload
Configuration reload triggered
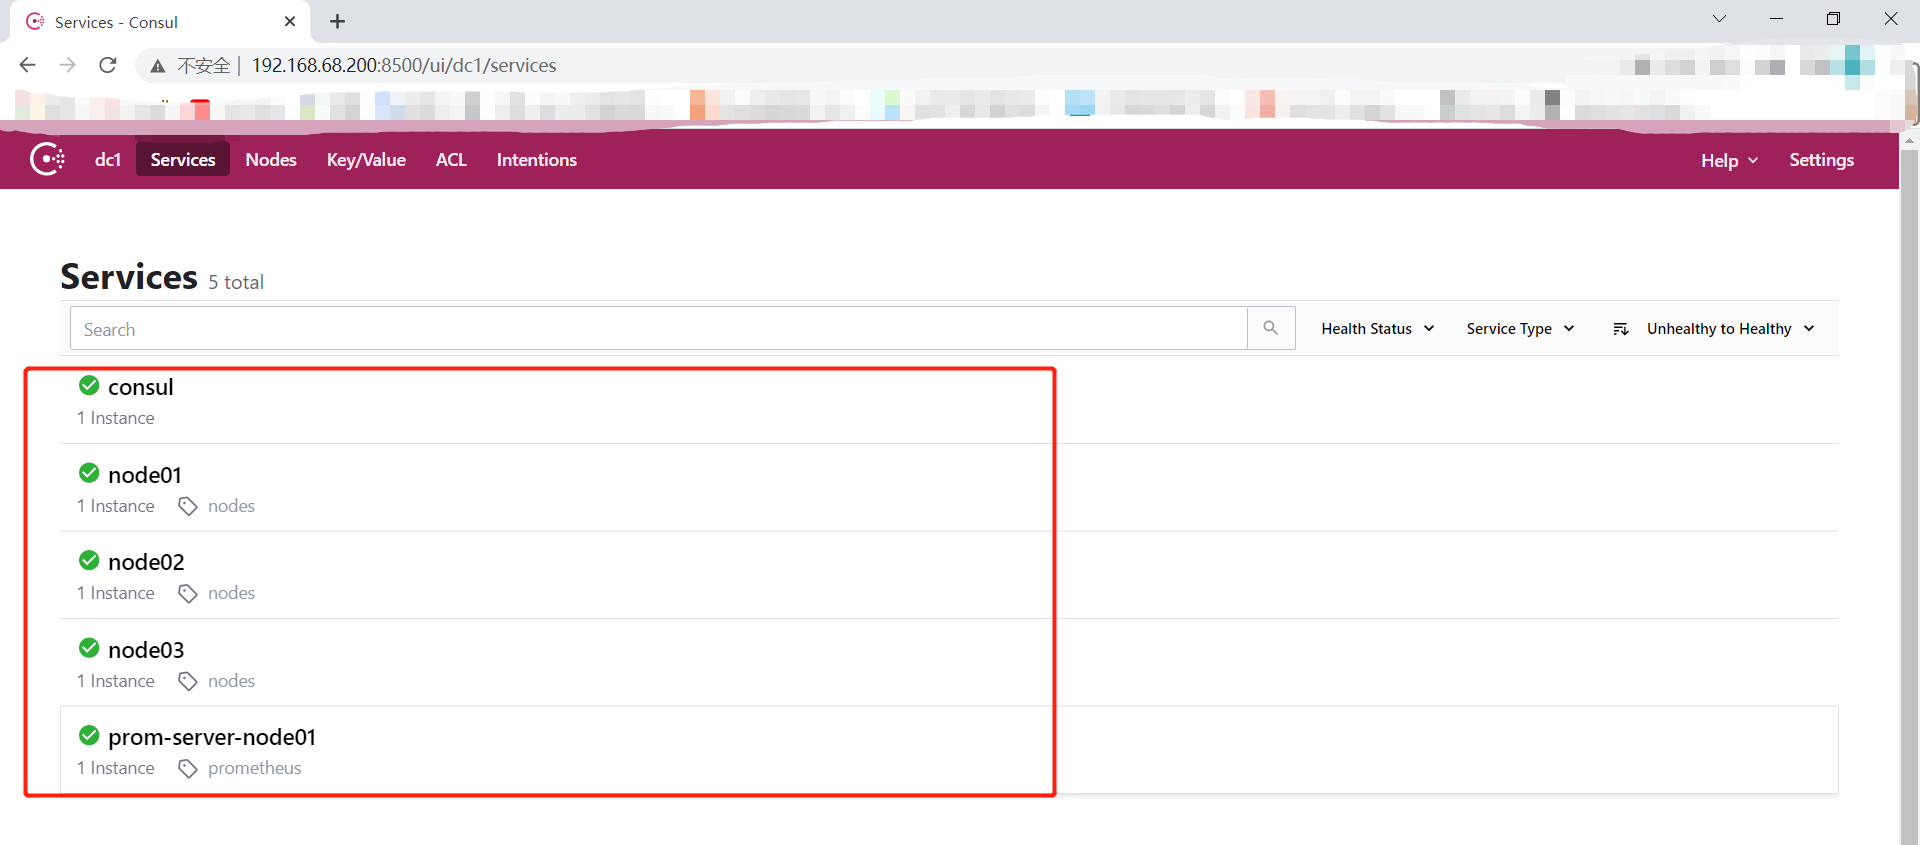
五、基于k8s服务发现
六、小结
服务发现
-
①文件定义形式(静态发现高端了一丢丢)
-
②DNS服务发现——>基于SRV记录
-
③consul服务发现——>利用nodes节点注册到consul,consul暴露出8500端口,给与prometheus进行采集targets(监控端),再到监控端(node_exporter : 9100的端口)来pull抓取数据
-
④K8S


 1227
1227


 被折叠的 条评论
为什么被折叠?
被折叠的 条评论
为什么被折叠?
 到【灌水乐园】发言


