


导入包:
import seaborn as sns
import numpy as np
import matplotlib.pyplot as plt
import pandas as pd

np.random.seed(sum(map(ord, 'seaborn-usecase')))
sns.set_theme()
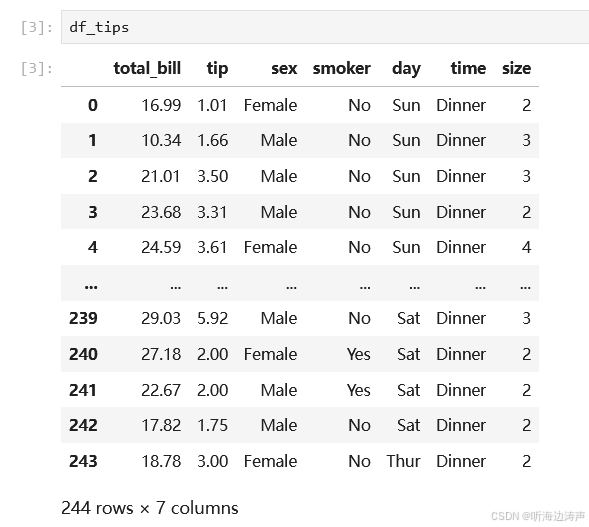
以小费数据集作为示例
加载数据集
df_tips = sns.load_dataset(name='tips', data_home='D:/temp/数据集临时备份下/seaborn')
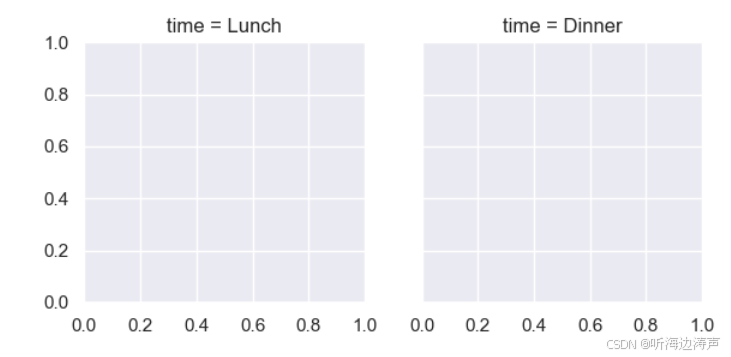
指定列,画直方图
如果只是创建FacetGrid:
g = sns.FacetGrid(data=df_tips, col='time')
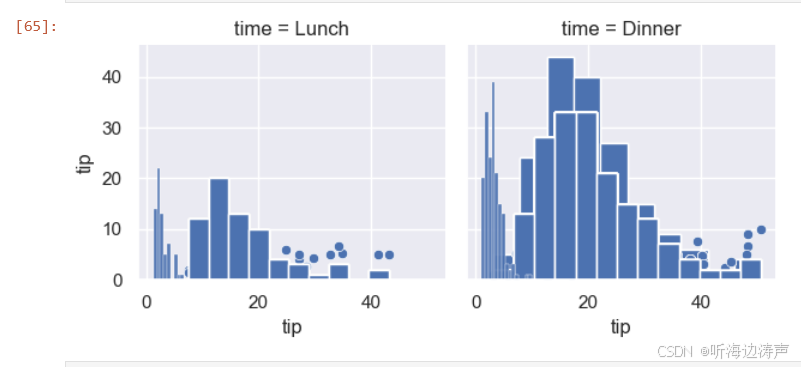
画直方图:
g.map(sns.histplot, "tip").figure
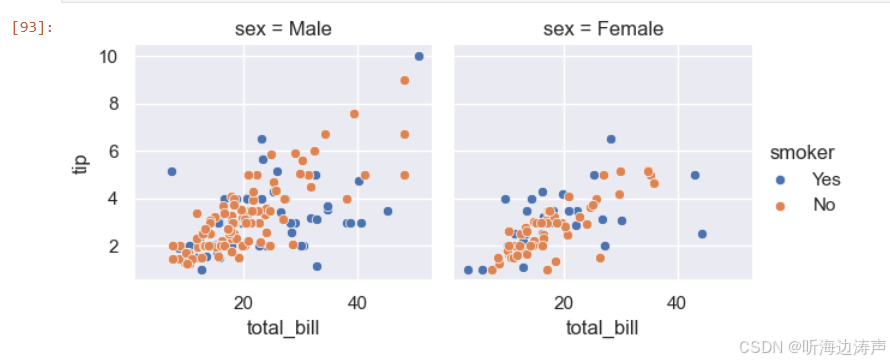
指定列、颜色区分,画散点图
g2 = sns.FacetGrid(data=df_tips, col='sex', hue='smoker')
g2.map(sns.scatterplot, 'total_bill', 'tip')
g2.add_legend().figure
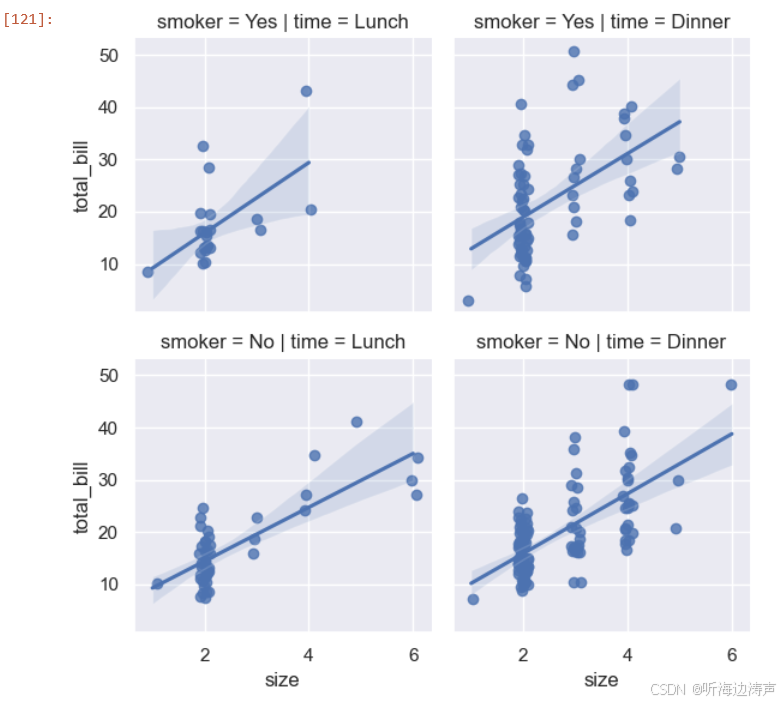
指定行、列,画回归图
g3 = sns.FacetGrid(data=df_tips, col='time', row='smoker')
g3.map(sns.regplot, 'size', 'total_bill', x_jitter=.1).figure
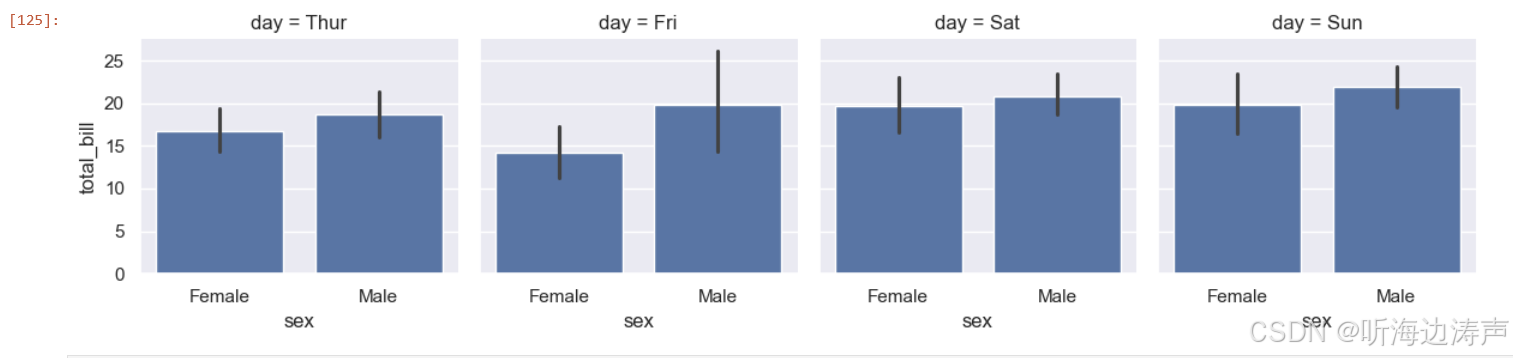
指定列,画条形图
g4 = sns.FacetGrid(data=df_tips, col='day')
g4.map(sns.barplot, 'sex', 'total_bill', order=['Female', 'Male']).figure
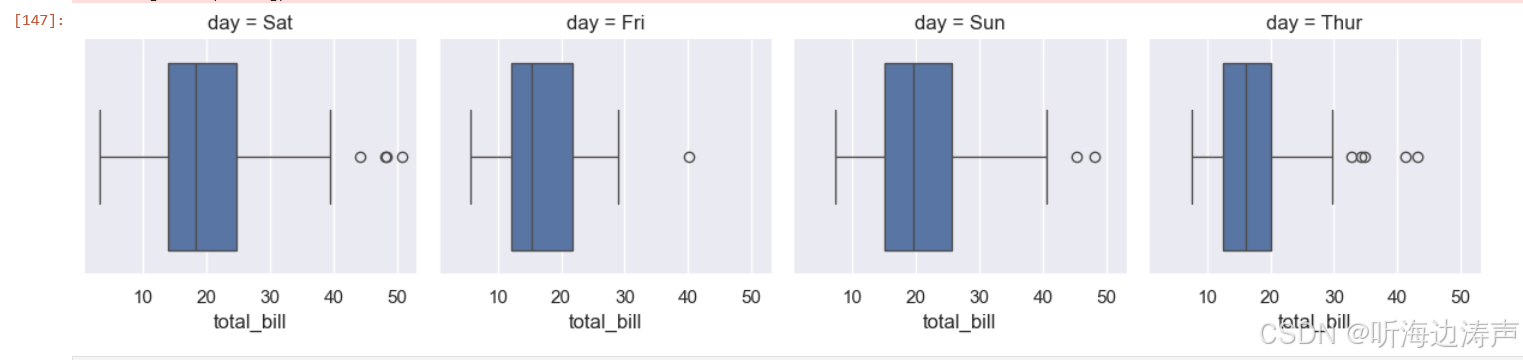
画箱线图,并且指定列的顺序
g5 = sns.FacetGrid(data=df_tips, col='day', col_order=['Sat', 'Fri', 'Sun', 'Thur'])
g5.map(sns.boxplot, 'total_bill').figure
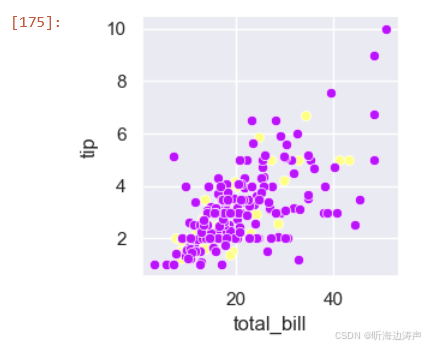
画散点图,指定调色版
g6 = sns.FacetGrid(data=df_tips, hue='time', palette={'Dinner': 'xkcd:neon purple', 'Lunch': 'xkcd:pale yellow'})
g6.map(sns.scatterplot, 'total_bill', 'tip').figure
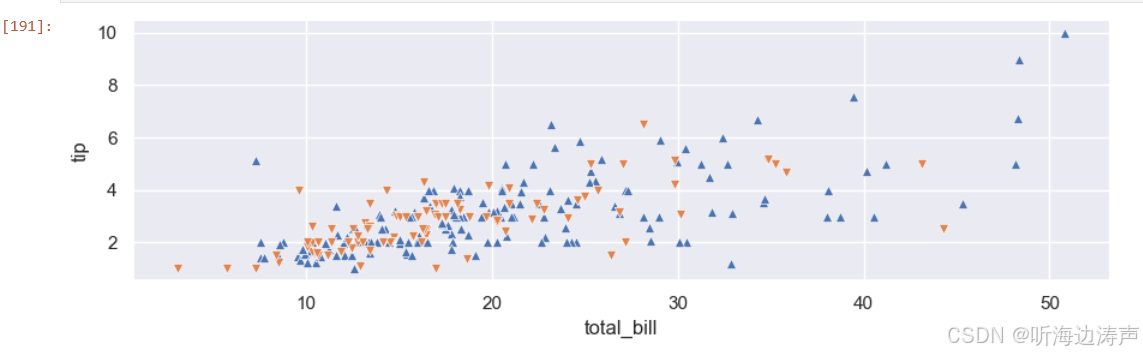
画散点图,指定点的形状
g7 = sns.FacetGrid(data=df_tips, hue='sex', height=3, aspect=3, hue_kws={'marker': ['^', 'v']})
g7.map(sns.scatterplot, 'total_bill', 'tip').figure
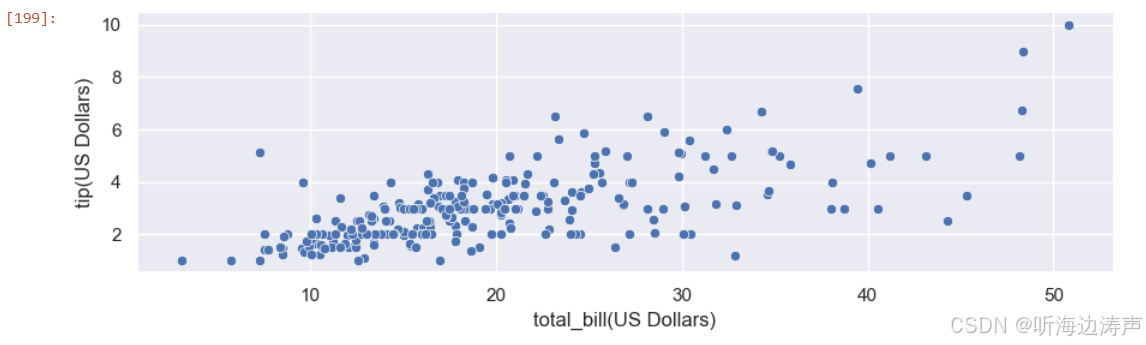
指定x轴和y轴的名字
g8 = sns.FacetGrid(data=df_tips, height=3, aspect=3)
g8.map(sns.scatterplot, 'total_bill', 'tip')
g8.set_axis_labels('total_bill(US Dollars)', 'tip(US Dollars)').figure


 被折叠的 条评论
为什么被折叠?
被折叠的 条评论
为什么被折叠?
 到【灌水乐园】发言


