


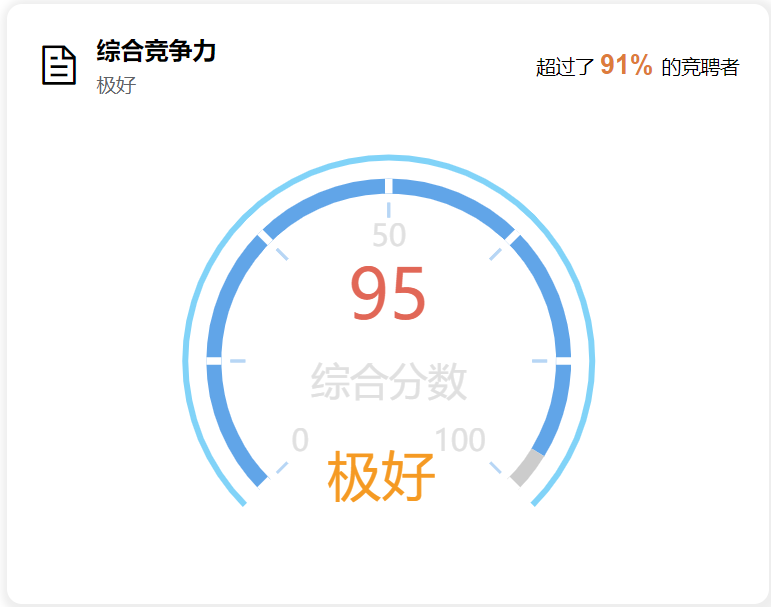
ECharts 实现仪表盘图表
eaharts版本用的是:5.4.3
完整示例代码
this.competitivenessChart = this.$echarts.init(document.getElementById('competitivenessChart'));
let self = this
let option = {
tooltip: {
show:false,
trigger: "item",
},
angleAxis: {
show: false,
max: (100 * 360) / 270,
type: "value",
startAngle: 225,
splitLine: {
show: false,
},
},
//圆环宽度
barMaxWidth: 8,
radiusAxis: {
show: false,
type: "category",
z: 10,
},
polar: {
//圆环大小
radius: "130%",
},
series: [
// 外圈
{
type: 'gauge',
name: '外层辅助',
radius: '86%',
center: ["50%", "55%"],
startAngle: 225,
endAngle: -45,
min: 0,
max: 100,
silent: false,
pointer: {
show: false
},
axisTick: {
show: false
},
axisLine: {
show: true,
lineStyle: {
color: [[1, '#81d3f8']],
width: 4,
opacity: 1
}
},
detail: {
show: false
},
splitLine: {
show: false,
},
axisLabel: {
show: false
}
},
//内圈分隔
{
name: '',
type: 'gauge',
startAngle: 225,
endAngle: -45,
min: 0,
max: 100,
radius: "76%", //图表尺寸
center: ["50%", "55%"],
splitNumber: 6, // 刻度数量
axisLine: {
show: true, // 带颜色的仪表盘
lineStyle: {
color: [[Number(self.RadarChartData.ScoreValue)/100, '#61a5e8'], [1, '#ccc']],
width: 10,
opacity: 1
}
},
title: {
show: false
},
detail: {
show: true,
offsetCenter: [0, -40],
formatter: function (value) {
return '{score|' + self.RadarChartData.ScoreValue + '}'
},
rich: {
score: {
fontSize: 46,
fontWeight: 500,
color: '#e16757'
},
},
},
splitLine: { // 分割线
show: true,
distance: -10, //分割线位置
length: 10, //分割线长度
lineStyle: {
color: '#fff',
width:5,
}
},
axisTick: { // 刻度线
show: false,
}, // 刻度样式
axisLabel: { // 刻度值
show: false,
},
// 指针
pointer: {
show: false,
},
data: [{
value: this.RadarChartData.ScoreValue,
name: '综合分数'
}]
},
// 刻度线
{
name: '刻度线',
type: 'gauge',
startAngle: 225,
endAngle: -45,
min: 0,
max: 100,
radius: "66%", //图表尺寸
center: ["50%", "55%"],
splitNumber: 6, // 刻度数量
axisLine: {
show: true, // 带颜色的仪表盘,设置颜色和背景色一致,就是不显示
lineStyle: {
color: [[0, '#fff'], [1, '#fff']],
width: 0,
opacity: 1
}
},
title: {
show: true,
offsetCenter: [0, 16], // x, y,单位px
textStyle: {
color: '#e0e0e0',
fontSize: 26,
},
},
detail: {
show: true,
offsetCenter: [-5, 80], //x,y
formatter: function (value) {
let val = '极好'
return '{text|' + val + '}'
},
rich: {
// verticalAlign: 'bottom', // 控制value对齐方式
text: {
fontSize: 36,
fontWeight: 500,
color: '#f59a23'
},
},
},
splitLine: { // 分割线
show: false,
},
axisTick: { // 刻度线
show: true,
splitNumber: 1,
lineStyle: {
color: '#b7d6f5', // 用颜色渐变函数不起作用
width: 2
},
length: 10,
}, // 刻度样式
// 刻度值数字
axisLabel: {
show: true,
splitNumber: 6,
formatter: function (value, index) {
const arr = [0, 50, 100]
if (arr.includes(value)) { return value }
},
fontSize: 20,
distance: -16,//刻度位置
color: '#e0e0e0'
},
pointer: {
show: false,
},
data: [{
value: this.RadarChartData.ScoreValue,
name: '综合分数'
}]
},
],
}
this.competitivenessChart.setOption(option)


 544
544

 被折叠的 条评论
为什么被折叠?
被折叠的 条评论
为什么被折叠?
 到【灌水乐园】发言


