


你和别人同时写出了一个导出订单的功能,你的导出一次用了30分钟,别人用了1分钟,那么这里就很明显的区分出来了你们代码的效率。代码的优劣是问题的根源。如果你想找出是什么原因导致代码执行这么慢,那么你就要学会怎么分析代码性能,找到代码瓶颈。
除了之前我们所说的可以使用xdebug分析PHP性能之外还可以使用xhprof分析。
Xhprof是facebook开源出来的一个php轻量级的性能分析工具,跟Xdebug类似,但性能开销更低,还可以用在生产环境中,也可以由程序开关来控制是否进行profile。
下载安装
sudo wget https://codeload.github.com/phacility/xhprof/zip/master -O xhprof.zip
你也可以从 http://pecl.php.net/package/xhprof 这里下载。
注意:
php5.4及以上版本不能在pecl中下载,不支持。需要在github上下载https://github.com/facebook/xhprof。
另外xhprof已经很久没有更新过了,截至目前还不支持php7。
cd xhprof-master/
cd extension/
sudo /usr/local/webserver/php-5.6.21/bin/phpize
sudo ./configure --with-php-config=/usr/local/webserver/php/bin/php-config --enable-xhprof
sudo make && make install
修改php.ini
[xhprof]
extension=xhprof.so
xhprof.output_dir=/home/xhprof  定义输出文件的存放位置
性能测试
关于xhprof的使用,请参照手册 http://php.net/xhprof
$XHPROF_ROOT = realpath(dirname(__FILE__) .'/..');
include_once $XHPROF_ROOT . "/xhprof_lib/utils/xhprof_lib.php";
include_once $XHPROF_ROOT . "/xhprof_lib/utils/xhprof_runs.php";
//开启xhprof
xhprof_enable(XHPROF_FLAGS_CPU + XHPROF_FLAGS_MEMORY);

//注册一个函数,当程序执行结束的时候去执行它。
register_shutdown_function(function() {
    //stop profiler
    $xhprof_data = xhprof_disable();

    //冲刷(flush)所有响应的数据给客户端
    if (function_exists('fastcgi_finish_request')) {
        fastcgi_finish_request();
    }

    $xhprof_runs = new XHProfRuns_Default();

    //save the run under a namespace "xhprof_foo"
    $run_id = $xhprof_runs->save_run($xhprof_data, "xhprof_foo");
});
//你也可以手动结束执行,保存分析结果
$xhprof_data = xhprof_disable();
$xhprof_runs = new XHProfRuns_Default();
$run_id = $xhprof_runs->save_run($xhprof_data, "xhprof_foo");
echo '<a href="http://' . $_SERVER['HTTP_HOST'] . '/xhprof/xhprof_html/index.php?run=' . $run_id . '&source=xhprof_foo" target="_blank">性能分析</a>';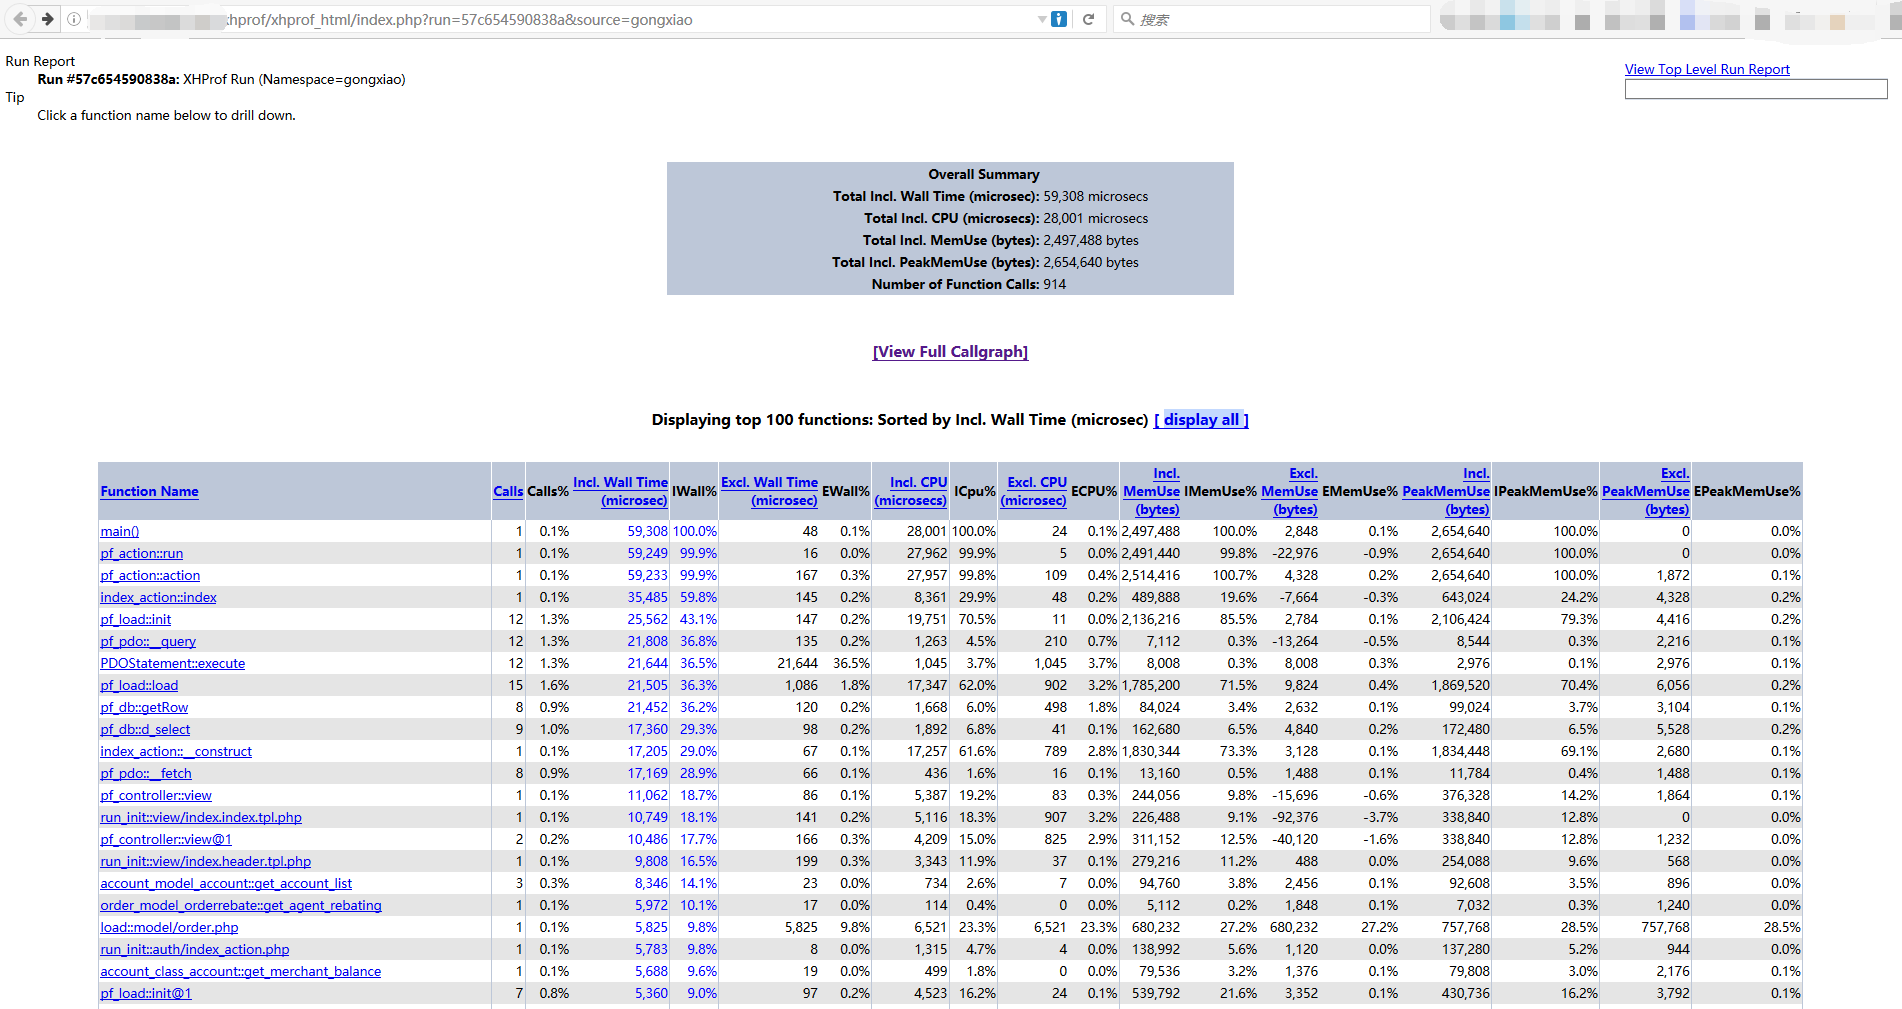
graphviz
graphviz是一个绘制图形的工具,可以更为直观的让你查看性能的瓶颈。
wget http://www.graphviz.org/pub/graphviz/stable/SOURCES/graphviz-2.24.0.tar.gz
cd graphviz-2.24.0
./configure
make && make install
或者直接使用yum安装
yum install libpng
yum install graphviz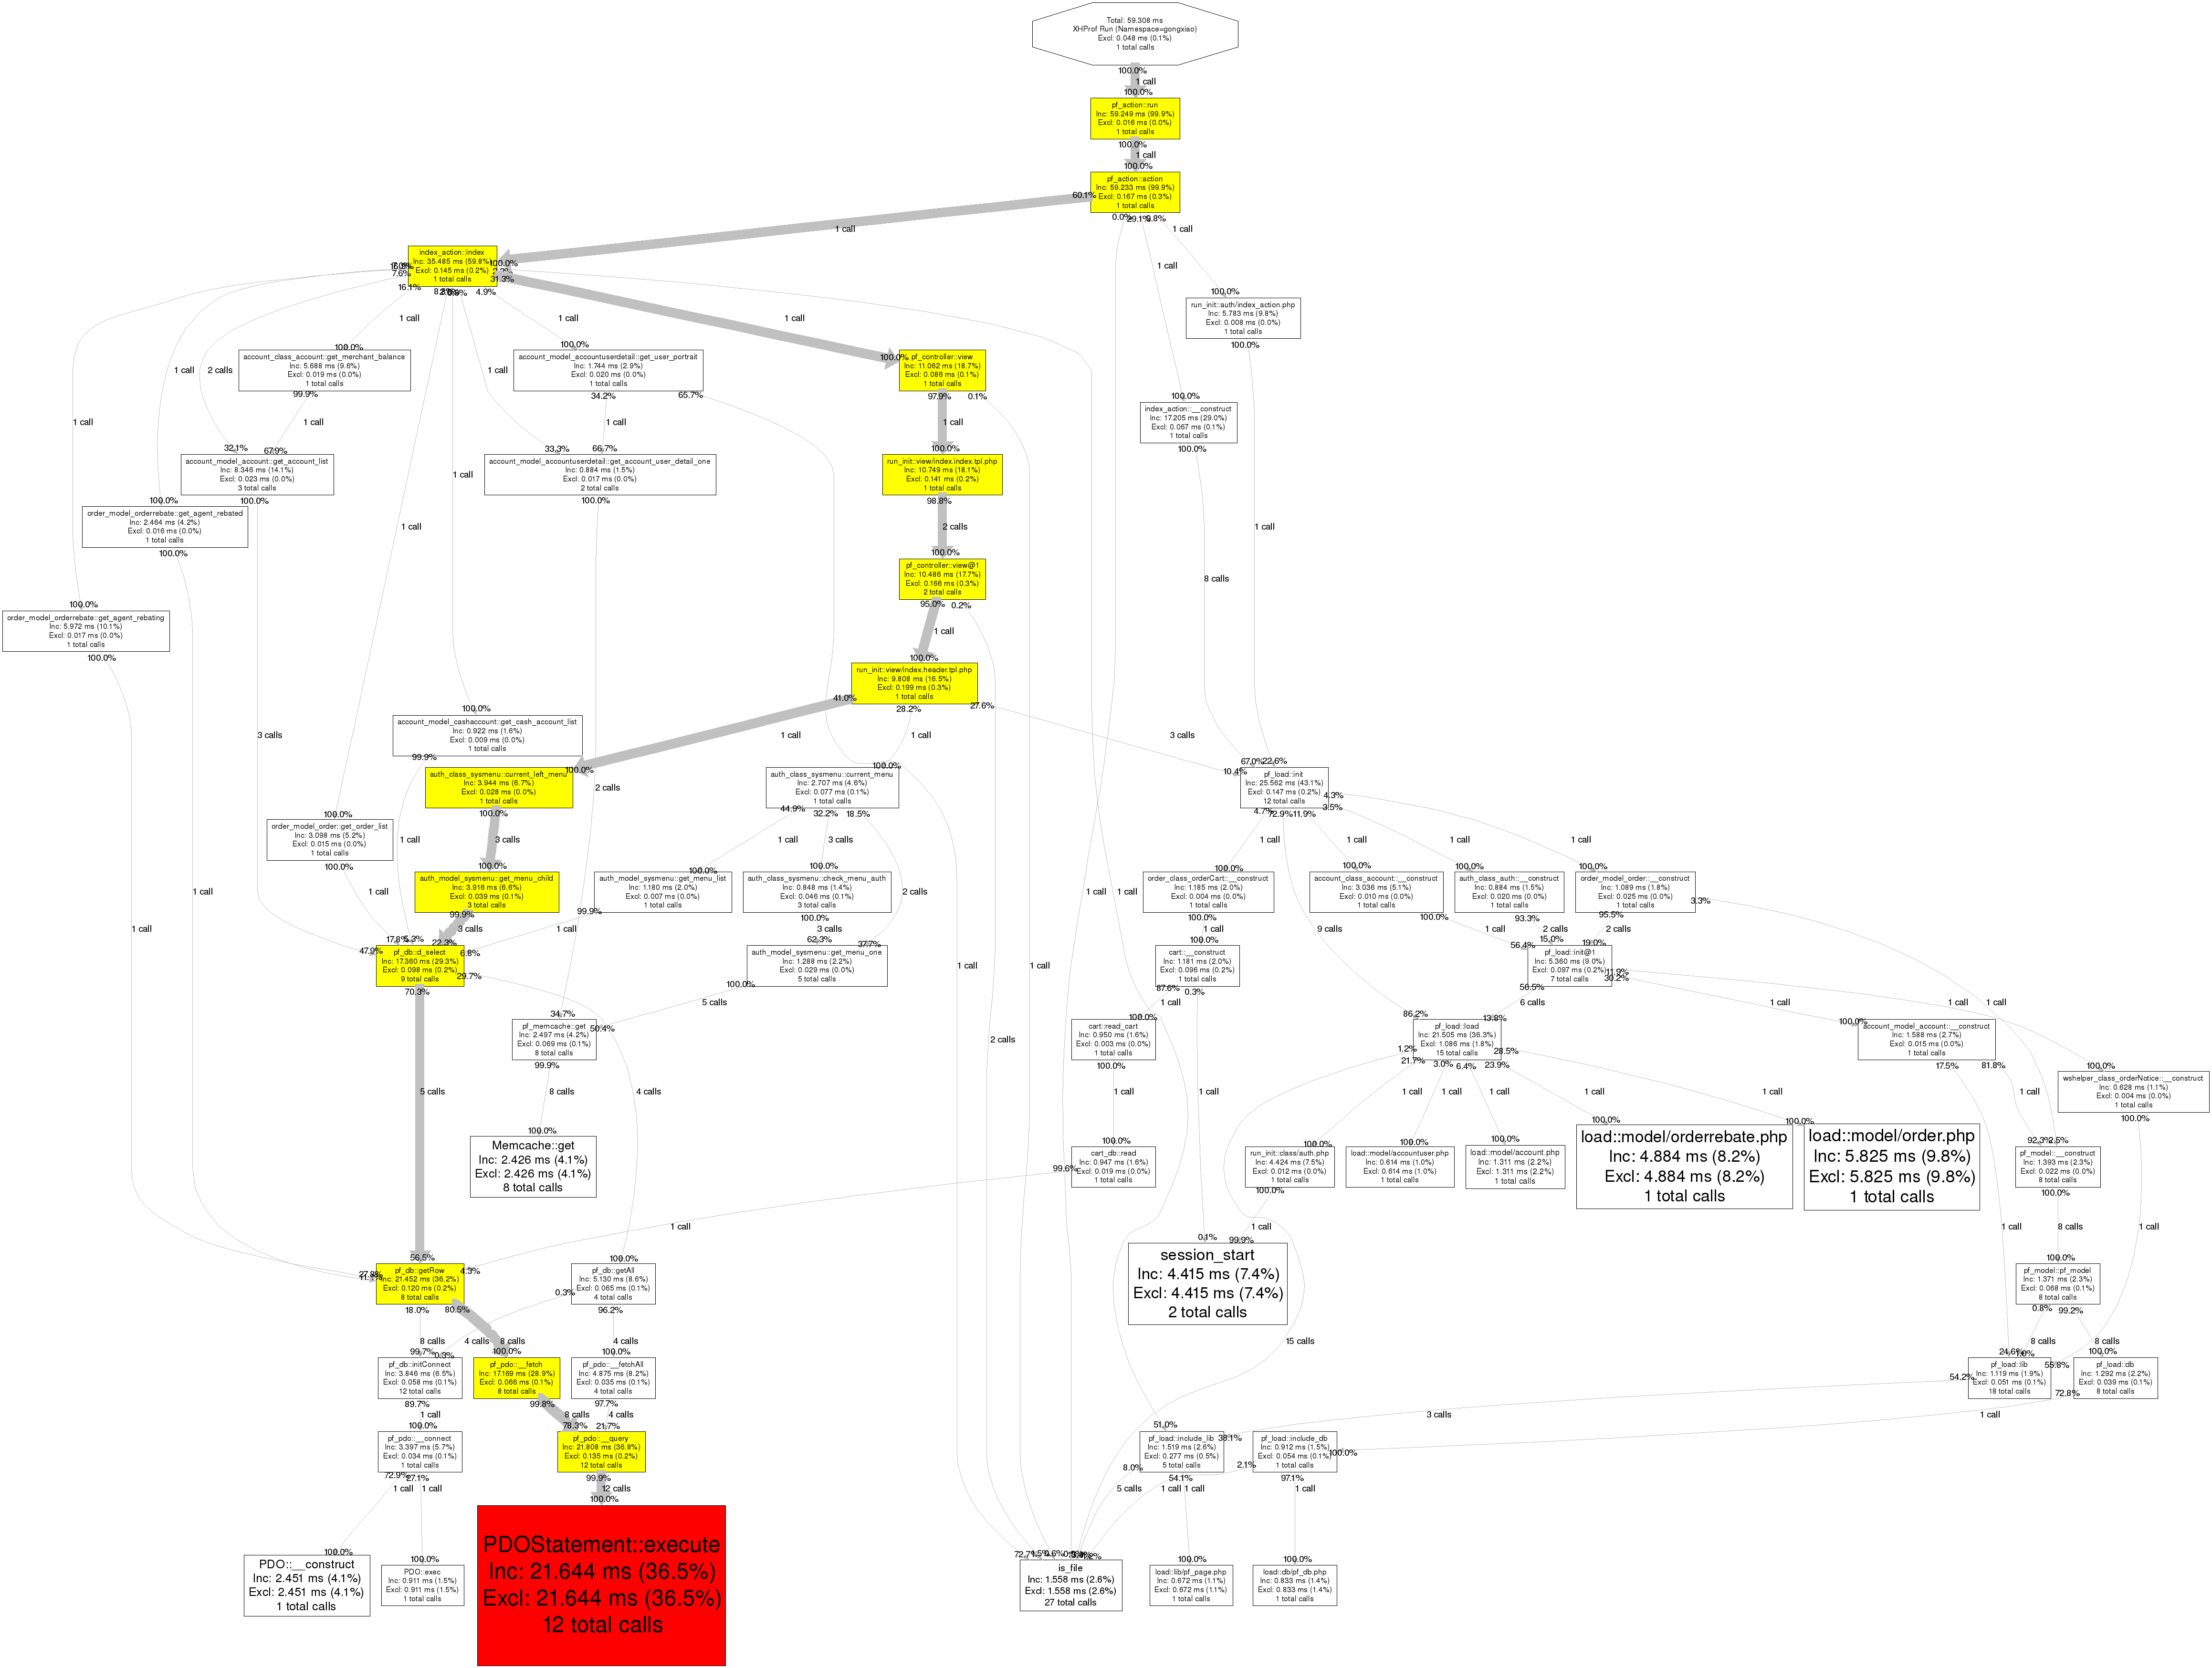
根据图片中的颜色度和箭头你能很方便的看出是哪一处比较占用时间。
其他
你也可以使用xhprof.io或者xhgui工具来分析你的xhprof结果。
下边是PHP性能分析和PHP性能调优的三篇文章
中文翻译版:
PHP 性能分析第一篇: Xhprof & Xhgui 介绍
PHP 性能分析第二篇: Xhgui In-Depth
PHP 性能分析第三篇: 性能调优实战
英文原版:
Profiling PHP Part 1: Intro to Xhprof & Xhgui
Profiling PHP Part 2: Xhgui In-Depth
Profiling PHP Part 3: Practical Performance Tuning
参考资料
xhprof地址 https://github.com/facebook/xhprof
xhprof手册 http://php.net/xhprof
使用xhprof进行线上PHP性能追踪及分析 http://avnpc.com/pages/profiler-php-performance-online-by-xhprof?utm_source=tuicool&utm_medium=referral
xhprof.io https://github.com/gajus/xhprof.io
xhgui https://github.com/perftools/xhgui
oneapm http://www.oneapm.com/


 980
980

 被折叠的 条评论
为什么被折叠?
被折叠的 条评论
为什么被折叠?
 到【灌水乐园】发言


