


下载ec-canvas,将ec-canvas.js里面的initByOldWay和initByNewWay方法完全替换
initByOldWay(callback) {
// 1.9.91 <= version < 2.9.0:原来的方式初始化
ctx = wx.createCanvasContext(this.data.canvasId, this);
const canvas = new WxCanvas(ctx, this.data.canvasId, false);
echarts.setCanvasCreator(() => {
return canvas;
});
// const canvasDpr = wx.getSystemInfoSync().pixelRatio // 微信旧的canvas不能传入dpr
const canvasDpr = 1
var query = wx.createSelectorQuery().in(this);
query.select('.ec-canvas').boundingClientRect(res => {
if (typeof callback === 'function') {
this.chart = callback(canvas, res.width, res.height, canvasDpr);
} else if (this.data.ec && typeof this.data.ec.onInit === 'function') {
// 在调用onInit方法中传入数据
this.chart = this.data.ec.onInit(canvas, res.width, res.height, this.data.tuData);
} else {
this.triggerEvent('init', {
canvas: canvas,
width: res.width,
height: res.height,
canvasDpr: canvasDpr // 增加了dpr,可方便外面echarts.init
});
}
}).exec();
},
initByNewWay(callback) {
// version >= 2.9.0:使用新的方式初始化
const query = wx.createSelectorQuery().in(this)
query
.select('.ec-canvas')
.fields({
node: true,
size: true
})
.exec(res => {
const canvasNode = res[0].node
this.canvasNode = canvasNode
const canvasDpr = wx.getSystemInfoSync().pixelRatio
const canvasWidth = res[0].width
const canvasHeight = res[0].height
const ctx = canvasNode.getContext('2d')
const canvas = new WxCanvas(ctx, this.data.canvasId, true, canvasNode)
echarts.setCanvasCreator(() => {
return canvas
})
if (typeof callback === 'function') {
this.chart = callback(canvas, canvasWidth, canvasHeight, canvasDpr)
} else if (this.data.ec && typeof this.data.ec.onInit === 'function') {
// 在调用onInit方法中传入数据
this.chart = this.data.ec.onInit(canvas, canvasWidth, canvasHeight, this.data.tuData)
} else {
this.triggerEvent('init', {
canvas: canvas,
width: canvasWidth,
height: canvasHeight,
dpr: canvasDpr
})
}
})
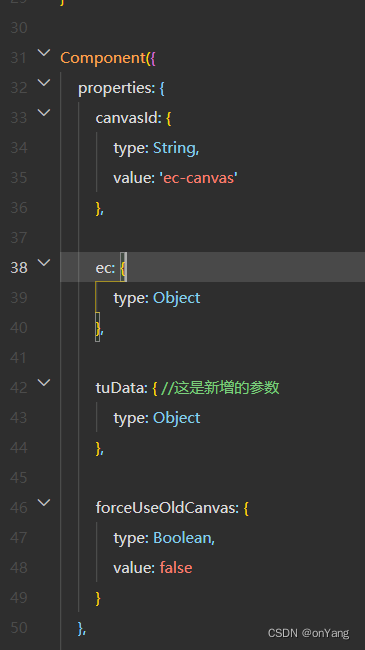
},在ec-canvas.js的Component的properties里面添加
 tuData: { //这是新增的参数
     type: Object
}, 
WXML文件绑定tuData数据,在page对象里面处理好之后绑定
<view class="bor" wx:for="{{covisitReportList}}">
     <ec-canvas id="mychart-dom-bar" canvas-id="mychart-bar" tuData="{{item}}" ec="{{ ec }}"></ec-canvas>
</view>
js文件在echarts的方法里面直接获取数据
function initRadar(canvas, width, height,echartsData) {

    console.log(canvas, width, height,echartsData)
    chart = echarts.init(canvas, null, {
        width: width,
        height: height,
        devicePixelRatio: dpr
    });
    canvas.setChart(chart);
    let option = {
        //图标提示框组件
        tooltip: {
            //触发方式  axis坐标轴触发
            trigger: 'axis'
        },
        //图例组件
        legend: {
            data: ['协访目标次数', '协访完成次数']
        },
        //网格配置 grid可以控制线性图 柱状图 图表大小
        grid: {
            //设置 上下左右距离dom容器距离 控制图标大小
            left: '3%',
            right: '4%',
            bottom: '3%',
            //是否显示刻度标签 true显示
            containLabel: true
        },
        //直角坐标系配置
            //设置x轴配置
        xAxis: {
            //type: category显示类目
            type: 'category',
            //x轴显示的相关数据
            data: echartsData.list.monthtList
        },
            //设置y轴配置
        yAxis: {
            type: 'value', //数值
            axisLabel: {
                show: true,
                interval: 'auto',
                formatter: '{value} %'
            },
            show: true
        },
        // 图表系列配置,决定图表数据怎样显示(柱状、折线、、、等)
        series: [
            {
                //数据线条名称
                //小技巧:series中有name值==> legend的data可以删掉
                name: '协访目标次数',
                //数据线条类型 此处line折线
                type: 'line',
                //设置数据堆叠,一般应用不需要
                stack: '总量',
                //线条数据
                data: echartsData.list.visitTargetList,
                itemStyle: {
                    borderWidth: 3,
                    borderColor: 'rgb(0,52,82)',
                    color: 'rgb(0,52,82)'
                },
            },
            {
                name: '协访完成次数',
                type: 'line',
                stack: '总量',
                //因为数据堆叠 此处数组第一个的  真实数据值应该是120+220=340;
                data: echartsData.list.visitList,
                lineStyle: {
                    color: 'rgb(254,195,146)',
                    type: 'dashed'
                },
                itemStyle: {
                    borderWidth: 3,
                    borderColor: 'rgb(254,195,146) ',
                    color: 'rgb(254,195,146)'
                }
            }
        ],
        //设置数据线条颜色
       color:[ 'green','red','pink','black','blue'],
    };

    chart.setOption(option);
    return chart;
}


 665
665


 被折叠的 条评论
为什么被折叠?
被折叠的 条评论
为什么被折叠?
 到【灌水乐园】发言


