


文章目录
clc
clear
close all
%位移,力,时间
data=readtable('3-1.xlsx');
data=table2array(data);
%由于是压缩实验,所以要取相反数
data(:,1)=-data(:,1);
data(:,2)=-data(:,2);
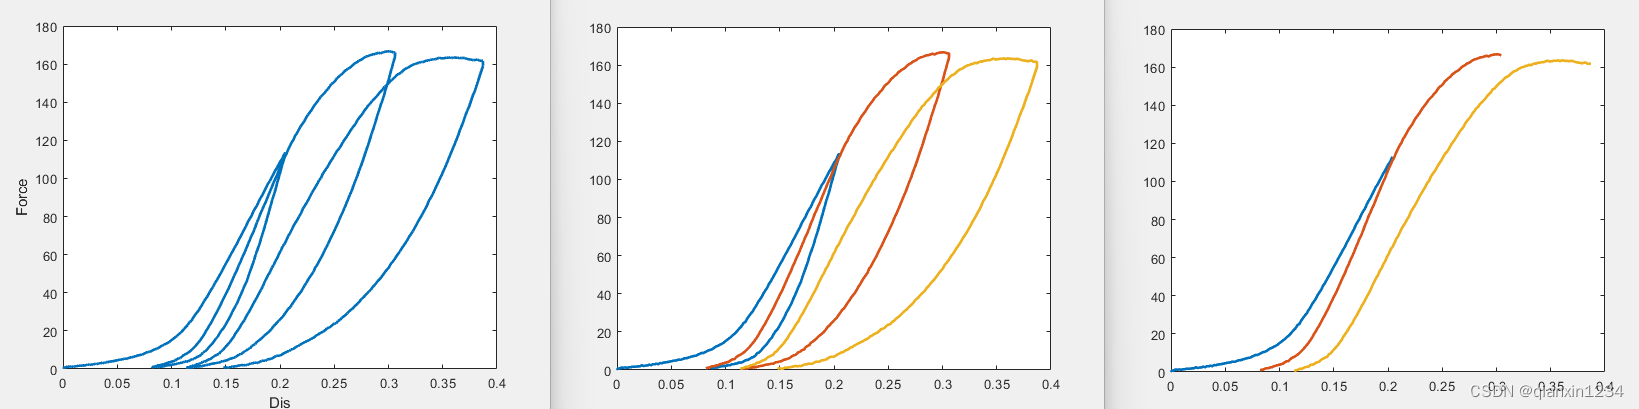
figure%原始曲线
plot(data(:,1),data(:,2),'linewidth',2)
xlabel('Dis')
ylabel('Force')
%需要被移除的卸载点是1,加载点是0
index_to_remove = (diff(data(:, 3)) > 0) & (diff(data(:, 1)) < 0);
% % 将符合条件的数据点删除
% %经过差分后,数据点会减少1,因而增加一个false使行数补齐
% result_matrix = data(~[false; index_to_remove], :);
% % figure
% % scatter(result_matrix(:,1),result_matrix(:,2))
figure%完整的单圈循环
% 找到连续的零值片段的索引
zero_segments = bwconncomp(index_to_remove == 0);
for i = 1:zero_segments.NumObjects-1
startid=zero_segments.PixelIdxList{i}(1);
endid=zero_segments.PixelIdxList{i+1}(1)-1;
plot(data(startid:endid,1),data(startid:endid,2),'linewidth',2)
hold on
end
startid=zero_segments.PixelIdxList{end}(1);
plot(data(startid:end,1),data(startid:end,2),'linewidth',2)
figure%仅保留加载
% 找到连续的零值片段的索引
zero_segments = bwconncomp(index_to_remove == 0);
for i = 1:zero_segments.NumObjects
startid=zero_segments.PixelIdxList{i}(1);
endid=zero_segments.PixelIdxList{i}(end);
plot(data(startid:endid,1),data(startid:endid,2),'linewidth',2)
hold on
end
手动提取各循环的模量
clc
clear
close all
spid=5;
comdir=2;%压缩方向,1为z方向,2为x方向
picpath='.\pic'
curvepath='.\curvesxls';
%位移,力,时间
filename=[num2str(spid),'-',num2str(comdir),'.xlsx'];
data=readtable(fullfile(curvepath,filename));
data=table2array(data);
%由于是压缩实验,所以要取相反数
data(:,1)=-data(:,1);
data(:,2)=-data(:,2);
chicun=readtable(fullfile(curvepath,'chicun.xlsx'));
chicun=table2array(chicun);
xlength=chicun(spid,2);
ylength=chicun(spid,2);
zlength=chicun(spid,2);
area=xlength*ylength;
height=zlength;
if comdir==2
area=(xlength*zlength+ylength*zlength)/2;
height=(xlength+ylength)/2;
end
%需要被移除的卸载点是1,加载点是0
index_to_remove = (diff(data(:, 3)) > 0) & (diff(data(:, 1)) < 0);

figure%原始曲线
plot(data(:,1),data(:,2),'linewidth',2)
xlabel('Dis')
ylabel('Force')

a=figure%完整的单圈循环
% 找到连续的零值片段的索引
zero_segments = bwconncomp(index_to_remove == 0);
for i = 1:zero_segments.NumObjects-1
    startid=zero_segments.PixelIdxList{i}(1);
    endid=zero_segments.PixelIdxList{i+1}(1)-1;
    plot(data(startid:endid,1),data(startid:endid,2),'linewidth',2)
    hold on
end
startid=zero_segments.PixelIdxList{end}(1);
plot(data(startid:end,1),data(startid:end,2),'linewidth',2)
xlabel('Dis')
ylabel('Force')
mkdir(fullfile(picpath,[num2str(spid),'-',num2str(comdir)]));
saveas(a, fullfile(picpath,[num2str(spid),'-',num2str(comdir)],'cycle.png'));
%前面的图像是用于观察对不对,在图上随便点一个点,然后关掉
[gx,gy]=ginput(1);
close all


figure%仅保留加载
% 找到连续的零值片段的索引
zero_segments = bwconncomp(index_to_remove == 0);
for id = 1:zero_segments.NumObjects
    startid=zero_segments.PixelIdxList{id}(1);
    endid=zero_segments.PixelIdxList{id}(end);
    strain=data(startid:endid,1);
    stress=data(startid:endid,2);
    plot(strain,stress,'linewidth',2)
    hold on
    [gx,gy]=ginput(2);
    n=size(strain,1);
    num_down=1;%拟合数据起始点编号
    num_up=1;%拟合数据终止点编号
    for i=1:n
        if strain(i)<=gx(1)
            num_down=i;
        else
            num_down=num_down;
        end
        if strain(i)<=gx(2)
            num_up=i;
        else
            num_up=num_up;
        end
    end
    p=polyfit(strain(num_down:num_up),stress(num_down:num_up),1);
    % x1=strain(num_down:num_up);
    % y1 = polyval(p,x1);
    plot([strain(num_down),strain(num_up)],[stress(num_down),stress(num_up)],'--o')
    disp('杨氏模量MPa')
    disp(p(1)*height/area)
    saveas(gca,fullfile(picpath,[num2str(spid),'-',num2str(comdir)],['cycle',num2str(id),'.png']));
    close
end


 969
969


 被折叠的 条评论
为什么被折叠?
被折叠的 条评论
为什么被折叠?
 到【灌水乐园】发言


