


2023.10.16学习-集成学习2
随机森林
from sklearn.ensemble import RandomForestClassifier
用随机森林算法获取数据各个特征的重要性(在树模型中,离根节点越远,重要性越低)
import matplotlib
import matplotlib.pyplot as plt
from sklearn.ensemble import RandomForestClassifier
from sklearn.datasets import load_iris
from sklearn.datasets import fetch_openml

# 引入鸢尾花数据集
iris = load_iris()
rf_clf = RandomForestClassifier(n_estimators=500, n_jobs=-1)
rf_clf.fit(iris['data'], iris['target'])

# 打印特征重要性
for name, score in zip(iris['feature_names'], rf_clf.feature_importances_):
    print(name, score)
'''
sepal length (cm) 0.0910199847388846
sepal width (cm) 0.02505991962373024
petal length (cm) 0.4320564200432981
petal width (cm) 0.4518636755940869
'''
# 但是在控制台直接输出数字不直观


# 引入mnist数据集
mnist = fetch_openml('mnist_784')

rf_clf = RandomForestClassifier(n_estimators=500, n_jobs=-1)
rf_clf.fit(mnist['data'], mnist['target'])

print(rf_clf.feature_importances_.shape)  # (784,)

# 热度图展示重要特征所在位置
def plot_digit(data):
    fig1 = plt.figure()
    image = data.reshape(28, 28)
    plt.imshow(image, cmap=matplotlib.cm.hot)
    plt.axis('off')
    char = plt.colorbar(ticks=[rf_clf.feature_importances_.min(), rf_clf.feature_importances_.max()])  # 添加热度轴
    char.ax.set_yticklabels(['Not important', 'Very important'])
    plt.show()

plot_digit(rf_clf.feature_importances_)
# 越接近中心(根),特征重要性越大;越边缘,特征重要性越小

Boosting:模型提升策略
Adaboost:
串联结构,每次调节样本权重,对模型不断更新

以SVM分类器为例,用Adaboost进行集成
import numpy as np
from matplotlib import pyplot as plt
from sklearn.model_selection import train_test_split
from sklearn.datasets import make_moons
from sklearn.svm import SVC
from matplotlib.colors import ListedColormap
from sklearn.tree import DecisionTreeClassifier

X, y = make_moons(n_samples=500, noise=0.3, random_state=42)
X_train, X_test, y_train, y_test = train_test_split(X, y, random_state=42)

fig1 = plt.figure()
plt.plot(X[:, 0][y == 0], X[:, 1][y == 0], 'yo', alpha=0.6)
plt.plot(X[:, 0][y == 1], X[:, 1][y == 1], 'bs', alpha=0.6)
plt.show()

# 绘制决策边界
def plot_decision_boundary(clf, X, y, axes=[-1.5, 2.5, -1, 1.5], alpha=0.5, contour=True):
    x1s = np.linspace(axes[0], axes[1], 100)
    x2s = np.linspace(axes[2], axes[3], 100)
    x1, x2 = np.meshgrid(x1s, x2s)
    X_new = np.c_[x1.ravel(), x2.ravel()]
    y_predict = clf.predict(X_new).reshape(x1.shape)
    custom_cmap = ListedColormap(['#fafab0', '#9898ff', '#a0faa0'])
    plt.contourf(x1, x2, y_predict, cmap=custom_cmap, alpha=0.3)
    if contour:  # 绘制等高线
        custom_cmap2 = ListedColormap(['#7d7d58', '#4c4c7f', '#507d50'])
        plt.contour(x1, x2, y_predict, cmap=custom_cmap2, alpha=0.8)
    plt.plot(X[:, 0][y == 0], X[:, 1][y == 0], 'yo', alpha=0.6)
    plt.plot(X[:, 0][y == 1], X[:, 1][y == 1], 'bs', alpha=0.6)
    plt.axis(axes)
    plt.xlabel('x1')
    plt.ylabel('x2')

m = len(X_train)  # 训练数据个数

# Adaboost集成
fig2 = plt.figure(figsize=(14, 5))
for subplot, learning_rate in ((121, 1), (122, 0.5)):
    sample_weight = np.ones(m)
    plt.subplot(subplot)
    for i in range(5):  # 迭代5次
        svm_clf = SVC(kernel='rbf', C=0.05, random_state=42)  # 支持向量机分类器
        svm_clf.fit(X_train, y_train, sample_weight=sample_weight)  # 样本权重项
        y_predict = svm_clf.predict(X_train)
        sample_weight[y_predict != y_train] *= (1+learning_rate)  # 更新权重参数
        plot_decision_boundary(svm_clf, X, y, alpha=0.2)
        plt.title('learning_rate = {}'.format(learning_rate))
    if subplot == 121:  # 标记迭代次数
        plt.text(-0.7, -0.65, "1", fontsize=14)
        plt.text(-0.6, -0.10, "2", fontsize=14)
        plt.text(-0.5, 0.10, "3", fontsize=14)
        plt.text(-0.4, 0.55, "4", fontsize=14)
        plt.text(-0.3, 0.90, "5", fontsize=14)

plt.show()

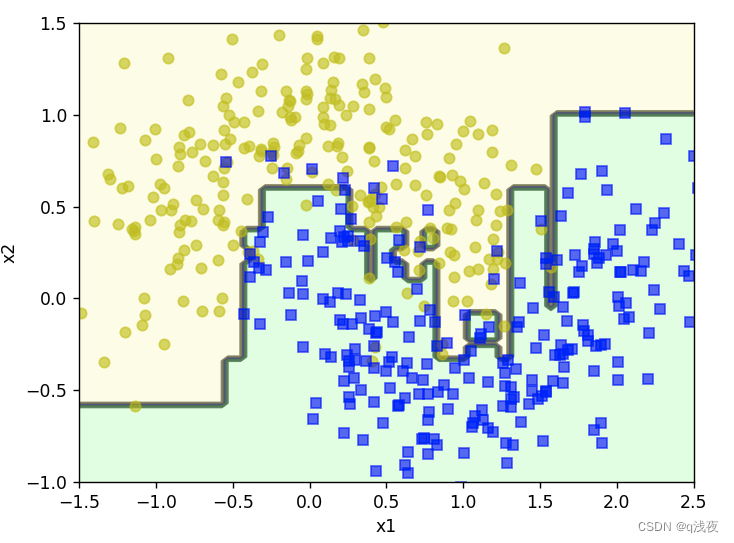
实际上有现成的Api可以直接调用AdaBoost模型
from sklearn.ensemble import AdaBoostClassifier

ada_clf = AdaBoostClassifier(DecisionTreeClassifier(max_depth=1),
                   n_estimators=200,  # 迭代200次
                   learning_rate=0.5,
                   random_state=42)
ada_clf.fit(X_train, y_train)
plot_decision_boundary(ada_clf, X, y)
plt.show()
learning_rate=0.5,
random_state=42)
ada_clf.fit(X_train, y_train)
plot_decision_boundary(ada_clf, X, y)
plt.show()


 583
583

 被折叠的 条评论
为什么被折叠?
被折叠的 条评论
为什么被折叠?
 到【灌水乐园】发言


