


非常喜欢Webstorm的debug功能,可以在编辑区直接打断点,查看运行时数据,但是最近debug时Webstorm无法连接浏览器了,下面是解决办法。
操作流程:
Run项目,然后Ctrl+Shift+单击 Local地址打开Debug
异常表现:
- Google浏览器窗口地址栏显示:about:blank;
- webstorm Event Log显示:
Waiting for connection to localhost:58705.
Please ensure that the browser was started successfully with remote debugging port opened.
Port cannot be opened if Chrome having the same User Data Directory is already launched.
原因:
新版本谷歌浏览器 rejects the requests unless started with --remote-allow-origins=*;
加解决方法
1.打开Webstorm配置编辑窗口:Settings | Tools | Web Browsers
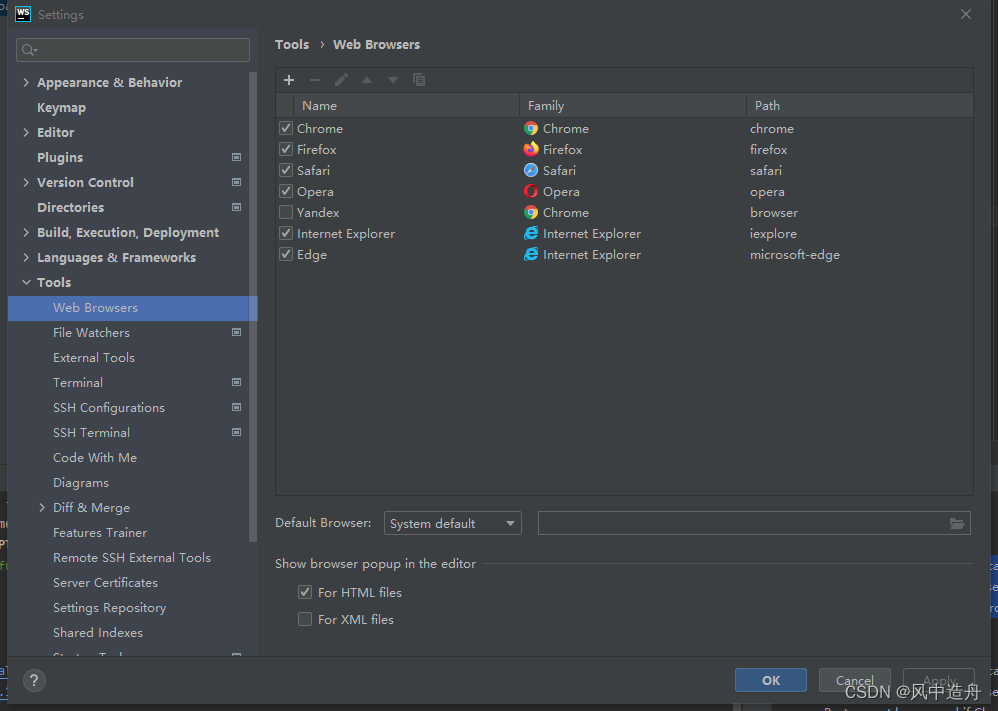
2.选中Chrome并点击编辑按钮打开Chrome Setting
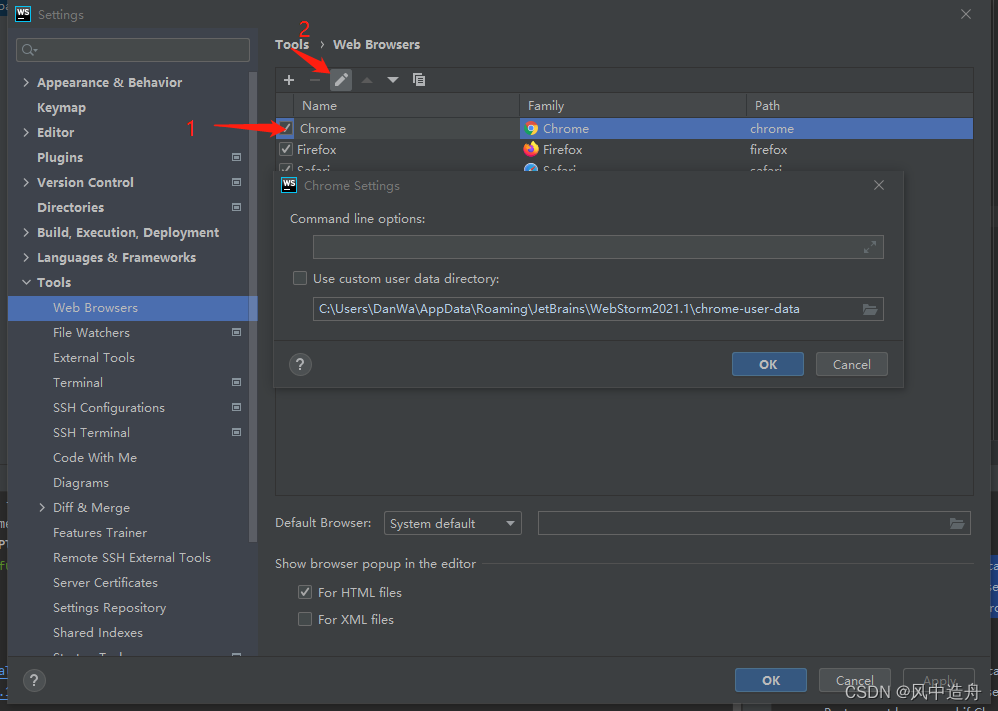
3.在Command line options输入框中输入:–remote-allow-origins=*,然后保存配置。


 3万+
3万+


 被折叠的 条评论
为什么被折叠?
被折叠的 条评论
为什么被折叠?
 到【灌水乐园】发言


