


Apache 压力测试工具ab 是针对apache的性能测试工具,可以只安装ab工具。通常自带此工具 ,如果没有的话也可以自行下载编译,网上教程很多很简单。。。
使用场景:由于之前公司买的天翼云服务器又卡又贵,现在把整站迁移到了阿里云,顺便做了好多速度上面的优化,感觉快了好多,想简单测试一下网站现在的负载能力
服务器配置:阿里云,双核,4g内存,8m带宽
服务器环境:lnmpa一键安装包,版本都是默认的版本,使用了redis缓存
1. 最基本的两个选项 -c -n
例:
./ab -c 100 -n 1000 http://127.0.0.1/
-c 100 即:每次并发100个
-n 10000 即: 共发送1000个请求
2.测试结果
This is ApacheBench, Version 2.3 <$Revision: 655654 $>
Copyright 1996 Adam Twiss, Zeus Technology Ltd, http://www.zeustech.net/
Licensed to The Apache Software Foundation, http://www.apache.org/

Benchmarking 127.0.0.1 (be patient).....done


Server Software:        nginx
Server Hostname:        127.0.0.1
Server Port:            80

Document Path:          /
Document Length:        293054 bytes

Concurrency Level:      100
Time taken for tests:   1.700 seconds
Complete requests:      100
Failed requests:        10
   (Connect: 0, Receive: 0, Length: 10, Exceptions: 0)
Write errors:           0
Total transferred:      29325607 bytes
HTML transferred:       29301907 bytes
Requests per second:    58.81 [#/sec] (mean)
Time per request:       1700.374 [ms] (mean)
Time per request:       17.004 [ms] (mean, across all concurrent requests)
Transfer rate:          16842.35 [Kbytes/sec] received

Connection Times (ms)
              min  mean[+/-sd] median   max
Connect:        1    1   0.4      1       2
Processing:   235  982 459.6    982    1697
Waiting:      207  963 461.5    955    1695
Total:        237  983 459.1    984    1698

Percentage of the requests served within a certain time (ms)
  50%    984
  66%   1273
  75%   1425
  80%   1443
  90%   1624
  95%   1690
  98%   1694
  99%   1698
 100%   1698 (longest request)
在做压力测试的同时打开另一个ssh窗口,用top命令查看cpu等实时负载:
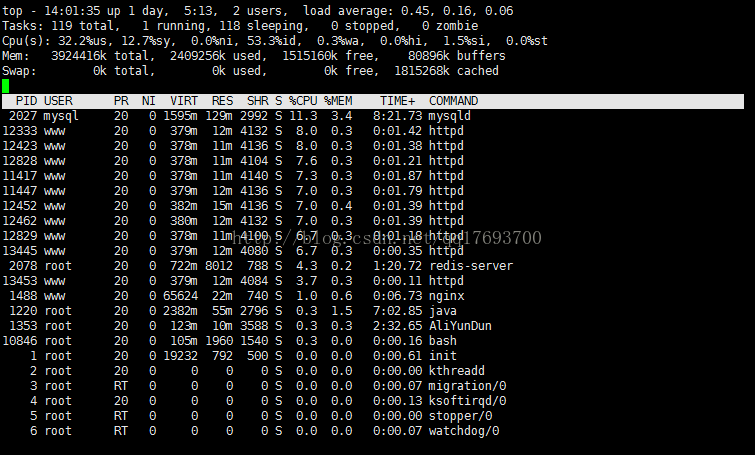
如图可见,cpu最高到了32.2%,性能还挺足,free命令查看一下内存:
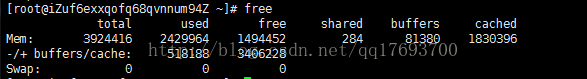
同样还有很多剩余,那么再加大请求数和并发量,看看服务器负载情况:
This is ApacheBench, Version 2.3 <$Revision: 655654 $> Copyright 1996 Adam Twiss, Zeus Technology Ltd, http://www.zeustech.net/ Licensed to The Apache Software Foundation, http://www.apache.org/ Benchmarking 127.0.0.1 (be patient) Completed 100 requests Completed 200 requests Completed 300 requests Completed 400 requests Completed 500 requests Completed 600 requests Completed 700 requests Completed 800 requests Completed 900 requests Completed 1000 requests Finished 1000 requests Server Software: nginx Server Hostname: 127.0.0.1 Server Port: 80 Document Path: / Document Length: 293054 bytes Concurrency Level: 1000 Time taken for tests: 62.259 seconds Complete requests: 1000 Failed requests: 997 (Connect: 0, Receive: 0, Length: 997, Exceptions: 0) Write errors: 0 Non-2xx responses: 83 Total transferred: 267931924 bytes HTML transferred: 267702560 bytes Requests per second: 16.06 [#/sec] (mean) Time per request: 62259.062 [ms] (mean) Time per request: 62.259 [ms] (mean, across all concurrent requests) Transfer rate: 4202.64 [Kbytes/sec] received Connection Times (ms) min mean[+/-sd] median max Connect: 22 26 2.0 26 30 Processing: 1109 22967 19092.3 18212 62228 Waiting: 1077 22838 19114.4 18128 62214 Total: 1135 22992 19093.1 18240 62254 Percentage of the requests served within a certain time (ms) 50% 18240 66% 24737 75% 27880 80% 27889 90% 62032 95% 62222 98% 62236 99% 62244 100% 62254 (longest request)
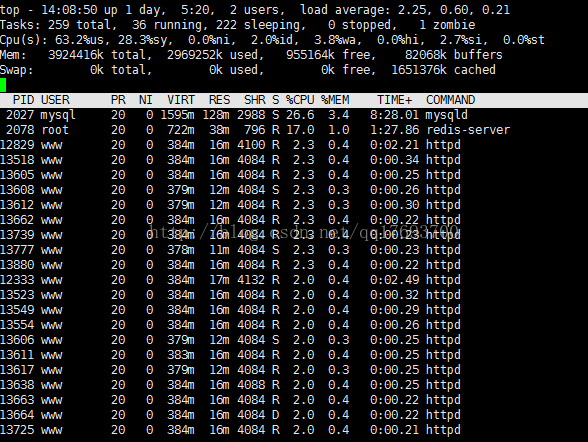
cpu最大负载时截图:
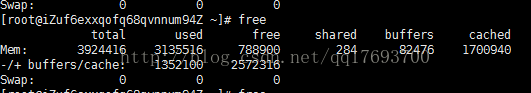
内存最大占用:
个人总结:当并发量100请求数100的时候,网站速度略微下降,提升到1000的时候,等待时间访问的时候会很卡,电脑端实际访问,大概七,八秒才打开首页
首页的很多数据都缓存到了redis,分担了mysql的很大压力,如果没有redis的话服务器估计早就卡爆了
同样的配置,阿里云简直比天翼云强太多,非广告 =。=
简单测试,不足之处请指正。


 618
618

 被折叠的 条评论
为什么被折叠?
被折叠的 条评论
为什么被折叠?
 到【灌水乐园】发言


