


 本文提供了一个详细的D3.js绘制柱状图的教程,包括创建HTML文件、导入d3库、设置SVG画布、插入数据以及添加坐标轴的步骤。通过实例代码解析了d3.scaleBand()和d3.scaleLinear()的比例尺应用,以及如何使用d3.data()、d3.join()等方法将数据映射到SVG元素上。最后,教程展示了如何插入坐标轴以完善图表。
d3.js画柱状图超详细教程
完整代码下载链接:https://mbd.pub/o/bread/ZZWUmJ5q,直接用这个文件夹内打开即可。
下面是完整教程。
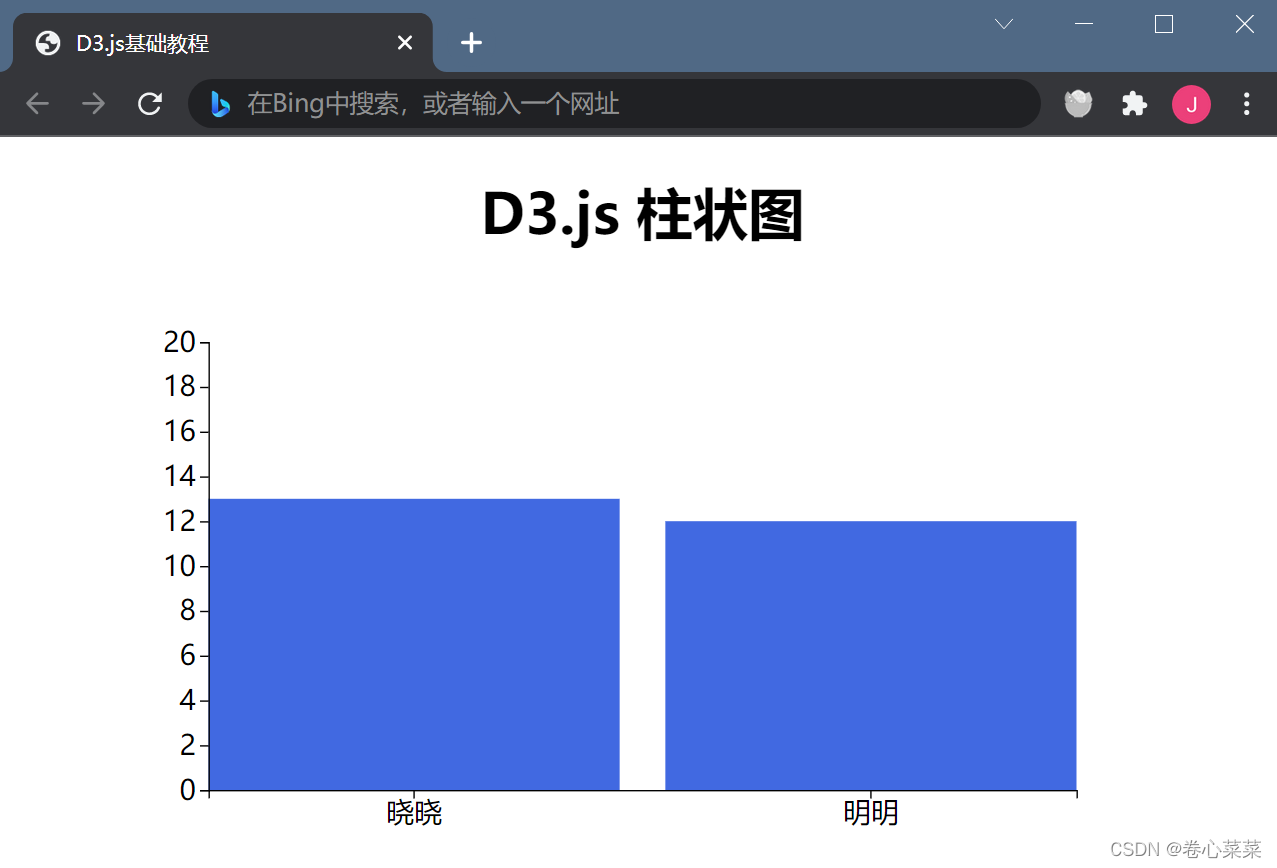
先看效果图
1. 本地创建一个文件夹,名字随便
2. 如何创建一个用于画d3的空白html?
- 在文件夹中新建文本文件,将后缀改为.html
<!doctype html>
<html>
<head>
    <title>D3.js基础教程</title>
    <script src="https://d3js.org/d3.v5.min.js" charset="utf-8"></script>
    <!-- 注1 -->
</head>

<body>
	<div style="text-align: center;">
        <h1>D3.js 柱状图</h1>
        <div id="d3-container"/> <!-- 注3 -->
    </div>
	<script src="index.js"></script> <!-- 注2 -->

</body>
</html>
注1:在线导入官方d3库,注意不同版本之间可能会有差异
注2:引入了同文件夹的index.js文件,我们等下会创建
注3:再次创建一个id为"d3-container"的div,将在index.js中在此部分内容中添加
svg模块
将该文件在浏览器中打开,应当展示如下界面:

3. 如何在空白html中加入一个svg画图区域?
- 在文件中新建文本文件,重命名为index.js
const data = [
{name:'晓晓', age: 13},
{name:'明明', age: 12},
];

const width = 700;
const height = 400;
const margin = {top:40, bottom: 40, left: 40, right: 40};

const svg = d3.select('#d3-container')
	.append('svg')  //注1
    .attr('height', height - margin.top - margin.bottom)
    .attr('width', width - margin.left - margin.right)
    .attr('viewBox', [0, 0, width, height]); //注2
注1:可见我们在html中之前指定id的地方添加了
svg模块注2:viewBox定义了svg的可显示区域,这里把所有svg分区都用于显示。
在svg中有一个类似的概念叫做viewPort,关于他们区别的一个比喻:“viewPort是屏幕,而viewBox截取了屏幕的一部分”
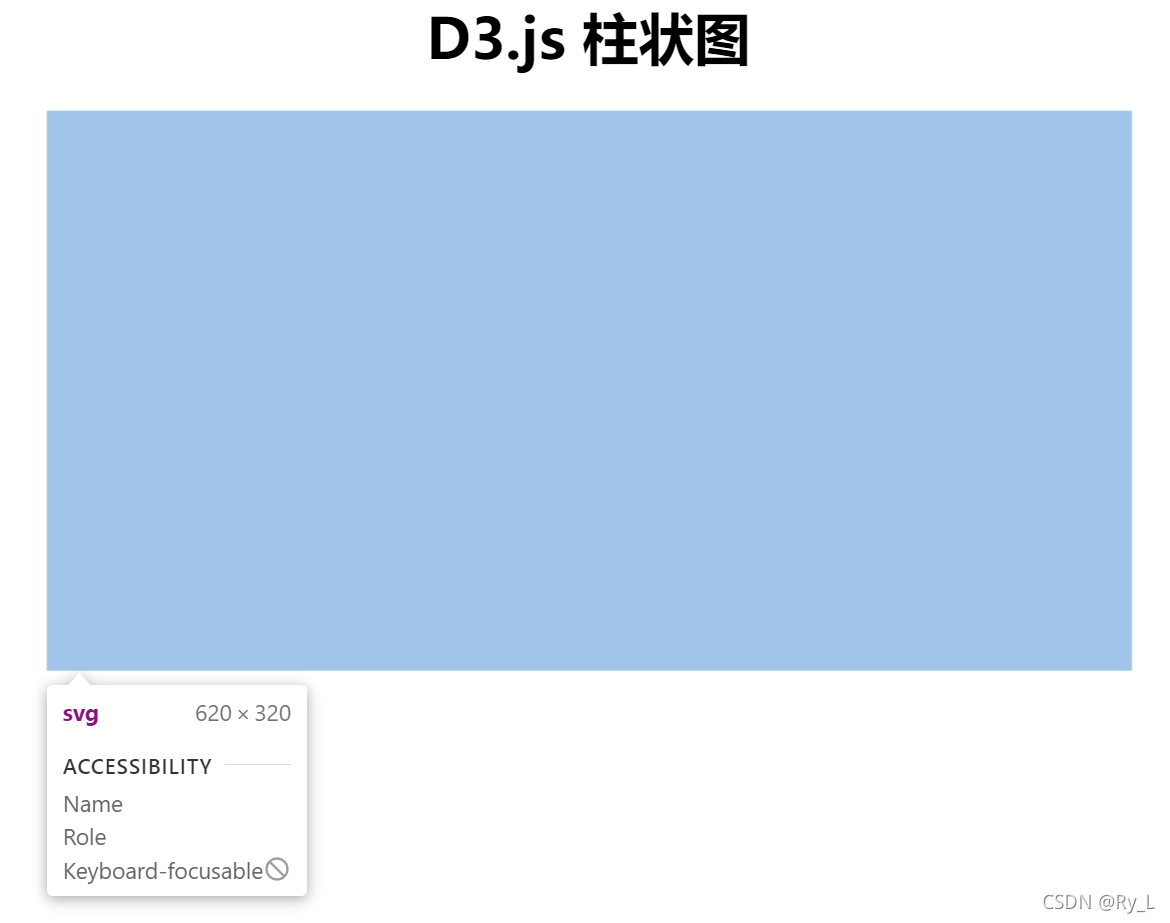
刷新浏览器,F12按下ctrl+shift+c可以看到创建了一个空白svg画布
4. 如何将数据插入到svg中(在index.js中添加代码)
const x = d3.scaleBand() //注1
	.domain(d3.range(data.length)) //注4
	.range([margin.left, width - margin.right]) //注5
	.paddingInner(0.1); //注3

const y = d3.scaleLinear() //注2
	.domain([0, 20]) //注4
	.range([height - margin.bottom, margin.top]) //注5
注1和注2
scaleLinear()和scaleBand()是两种比例尺,作用是将我们data变量中的数据指定一种方式存放到svg里面去,实现输入具体数据,返回具体坐标/长度。
scaleBand()是离散的映射比例尺,本例是将data.length=2的数据映射到了[margin.left, width - margin.right]=[40,700-40]=[40,660]的区间,区间的中点在(660+40)/2=350的位置。
- 有耐心的童鞋可以自己输出
x(0)试试,雀食返回了40,但x(1)却返回了366.3157894,也就是说默认第二条数据会在中点靠右大概16个坐标的位置处继续画。**猜猜为什么是16呢?没错就是注3的paddingInner!
scaleLinear()是连续的映射,与x中只存储了x(0)和x(1)两个数据不同,我们的y需要连续进行映射注4和注5(注3哪去了?)
- domain表示定义域,range表示值域,即按照比例将数据从定义域映射到值域,上面关于x(1)的例子已经说得比较清楚了。、
-
svg
  .append("g") //注6
  .attr("fill", 'royalblue') //注7
  .selectAll("rect") //注8
  .data(data.sort((a, b) => d3.descending(a.age, b.age))) //注9
  .join("rect") //注10
        .attr("x", (d, i) => x(i)) //注11
        .attr("y", d => y(d.age)) //注12
		.attr('height', d=> y(0) - y(d.age)) //注13
		.attr('width', x.bandwidth()); //注14

svg.node(); //15
注6和注7:
- svg g`的含义是组合,这属于svg的知识(而并不仅是d3中的知识)。其自身具有width(宽度), fill(背景颜色), transform(变形: 比如旋转)等属性,还可以可以在其中添加line线条,rect矩形等属性,详情可以参照-svg tutorials
- 这里希望加入的组是柱状图的蓝色注条,所以注7设定了颜色
注8:
- rect的含义是rectangle,翻译一段Jakob关于rect的描述:“基于rect元素你可以画出不同宽度width,长度hight,边缘stroke,背景色fill的矩形,设置他们为圆角或直角”
- 这里选择了小组中所有的矩形来设定data(可是我们都没有声明“rect”呀!这或许就是join的神奇之处)
注9.1:d3.sort()
d3.descending吸收两个数字,并返回他们“是否”是按照降序排列的,“是”则返回1,“否”则返回零。
d3.sort的运作格式为:sort( compare ),这里的compare为d3.descending表示将以降序的方式排序,将返回一串数组。
注意;里面的data为含有我们数据的那个data字典,我们通过.sort的方式完成了排序,使用console.log(data.sort((a, b) => d3.descending(a.age, b.age)))将数据在浏览器中打印出来吧注9.2:d3.data()
- d3.data()函数接受数组型数据,并逐个对元素做遍历操作。这里我们为每一个元素都join(‘rect’)
注10:d3.join() 在这里的作用类似enter
注11:这里的d和i是作为attribute使用,d表示当前"x"数据,i指定了指数;x是我们之前建立的坐标映射,x(0)表示第一个数据的最小的x坐标。并将这个x(i)赋值为当前data的"x"。
如果我们去掉i,会导致两张图重合,但通过浏览器选择元素按钮还是可以看出来;
另一种写法是(d,i) => i*40,相当于手工设置坐标间距了
类似还有nodes和this,碰到的时候再说
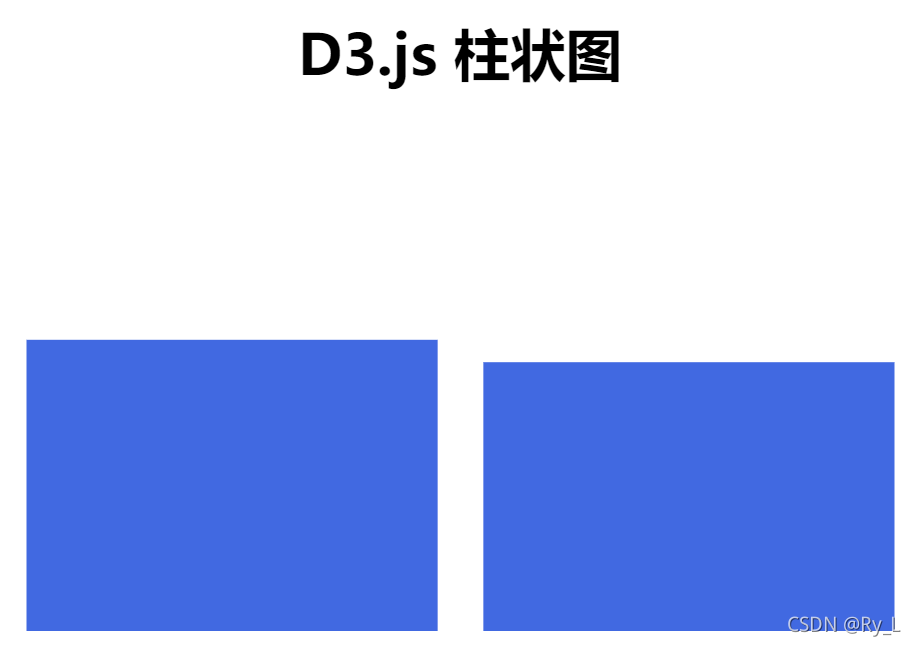
注12 13 14类似,略注15执行
svg.node()进行绘图、
F5运行,柱状图就出现啦~
5. 最后插入坐标轴
在运行svg.node前,执行画坐标轴的函数
function yAxis(g) {
  g.attr("transform", `translate(${margin.left}, 0)`)
    .call(d3.axisLeft(y).ticks(null, data.format))
    .attr("font-size", '20px')
}

function xAxis(g) {
  g.attr("transform", `translate(0,${height - margin.bottom})`)
    .call(d3.axisBottom(x).tickFormat(i => data[i].name))
    .attr("font-size", '20px')
}

svg.append("g").call(xAxis);
svg.append("g").call(yAxis);
svg.node();
transform的理解和d3.axis方法解释太麻烦,大家就当作固定的方法好了。给好学的童鞋放一个svg中关于[transform](https://developer.mozilla.org/en-US/docs/Web/SVG/Attribute/transform)的解释吧(某种程度上d3只是通过api简化了svg的写法)。
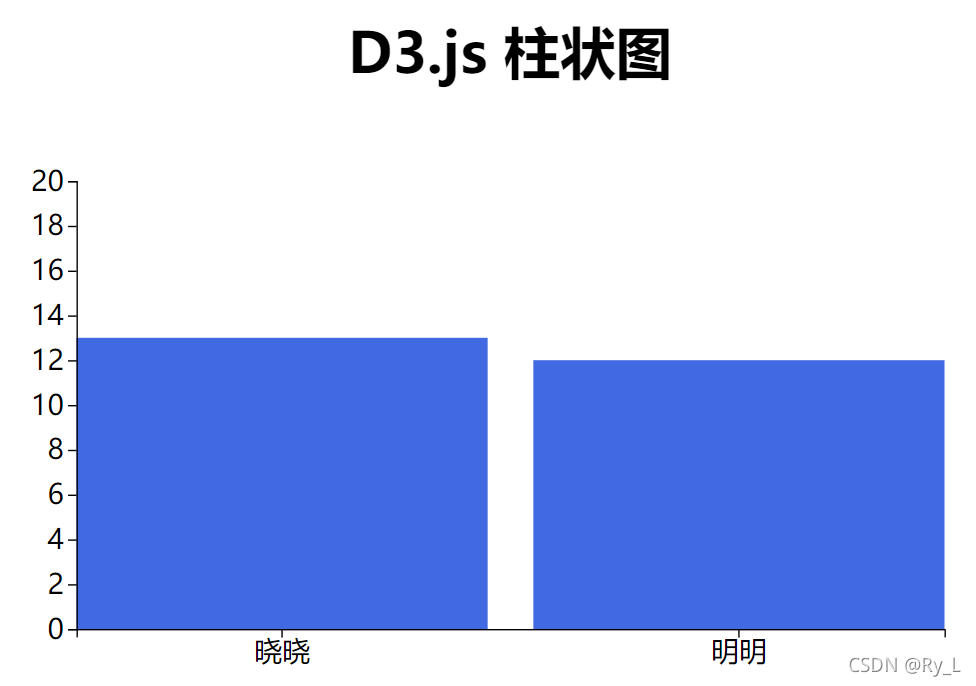
大功告成~
检查你的代码
html
<!doctype html>
<html>
<head>
<title>D3.js基础教程</title>
<script src="https://d3js.org/d3.v5.min.js" charset="utf-8"></script>
<!-- 注1 -->
</head>
<body>
<div style="text-align: center;">
<h1>D3.js 柱状图</h1>
<div id="d3-container"/> <!-- 注3 -->
</div>
<script src="index.js"></script> <!-- 注2 -->
</body>
</html>
index.js
const data = [
{name:'晓晓', age: 13},
{name:'明明', age: 12},
];

const width = 700;
const height = 400;
const margin = {top:40, bottom: 40, left: 40, right: 40};

const svg = d3.select('#d3-container') //注意
	.append('svg')
    .attr('height', height - margin.top - margin.bottom)
    .attr('width', width - margin.left - margin.right)
    .attr('viewBox', [0, 0, width, height]);

const x = d3.scaleBand()
	.domain(d3.range(data.length))
	.range([margin.left, width - margin.right])
	.paddingInner(0.1);
// alert(x(1))

const y = d3.scaleLinear()
	.domain([0, 20])
	.range([height - margin.bottom, margin.top])

// console.log(data.sort((a, b) => d3.descending(a.age, b.age)))

svg
  .append("g")
  .attr("fill", 'royalblue')
  .selectAll("rect")
  .data(data.sort((a, b) => d3.descending(a.age, b.age)))
  .join("rect")
        .attr("x", (d,i) => x(i))
        .attr("y", d => y(d.age))
		.attr('height', d=> y(0) - y(d.age))
		.attr('width', x.bandwidth());

function yAxis(g) {
  g.attr("transform", `translate(${margin.left}, 0)`)
    .call(d3.axisLeft(y).ticks(null, data.format))
    .attr("font-size", '20px')
}

function xAxis(g) {
  g.attr("transform", `translate(0,${height - margin.bottom})`)
    .call(d3.axisBottom(x).tickFormat(i => data[i].name))
    .attr("font-size", '20px')
}

svg.append("g").call(xAxis);
svg.append("g").call(yAxis);
svg.node();


 被折叠的 条评论
为什么被折叠?
被折叠的 条评论
为什么被折叠?
 到【灌水乐园】发言


