myEcharts() {
function fGetChartFontSize() {
const dpr = window.devicePixelRatio;
let fontSize = 13;
if (dpr == 2) {
fontSize = 14;
} else if (dpr == 3) {
fontSize = 15;
} else if (dpr > 3) {
fontSize = 16;
}
return fontSize;
}
const size = fGetChartFontSize();
let mychart = echarts.init(this.$refs.myChart);
// 绘制图表
mychart.setOption({
title: {
show: false
},
tooltip: {},
xAxis: {
data: [
"11.1",
"11.2",
"11.3",
"11.4",
"11.5",
"11.6",
"11.7",
"11.8",
"11.9",
"11.10",
"11.11",
"11.12",
"11.13",
"11.14",
"11.15",
"11.16",
"11.17",
"11.18",
"11.19",
"11.20",
"11.21",
"11.22",
"11.23",
"11.24",
"11.25",
"11.26",
"11.27",
"11.28",
"11.29",
"11.30"
],
axisLabel: {
interval: 13,
fontSize: size,
textStyle: {
color: "#999"
},
},
axisTick: {
//x轴刻度线
show: false
},
axisLine: {
//x轴
show: false
}
},
yAxis: {
//设置网格线颜色
splitLine: {
show: true,
lineStyle: {
color: ["#eee"],
width: 1,
type: "solid"
}
},
axisTick: {
//y轴刻度线
show: false
},
axisLine: {
//y轴
show: false
},
axisLabel: {
color: "#555",
fontSize: size,
fontSize: size,
textStyle: {
color: "#999"
},
formatter: function(value, index) {
var value;
if (value >= 1000) {
value = value / 1000 + "k";
} else if (value < 1000) {
value = value;
}
return value;
}
}
},
series: [
{
// For shadow
type: "bar",
itemStyle: {
normal: { color: "rgba(0,0,0,0.05)" }
},
barGap: "-100%",
barCategoryGap: "40%",
data: [],
animation: false
},
{
type: "bar",
itemStyle: {
normal: {
color: new echarts.graphic.LinearGradient(0, 0, 0, 1, [
{ offset: 0, color: "#83bff6" },
{ offset: 0.5, color: "#188df0" },
{ offset: 1, color: "#188df0" }
])
},
emphasis: {
color: new echarts.graphic.LinearGradient(0, 0, 0, 1, [
{ offset: 0, color: "#2378f7" },
{ offset: 0.7, color: "#2378f7" },
{ offset: 1, color: "#83bff6" }
])
}
},
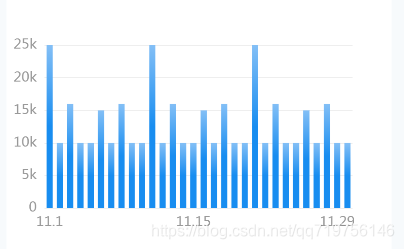
data: [
25000,
10000,
16000,
10000,
10000,
15000,
10000,
16000,
10000,
10000,
25000,
10000,
16000,
10000,
10000,
15000,
10000,
16000,
10000,
10000,
25000,
10000,
16000,
10000,
10000,
15000,
10000,
16000,
10000,
10000
]
}
]
});
}
// 引入 ECharts 主模块
var echarts = require("echarts/lib/echarts");
// 引入柱状图
require("echarts/lib/chart/bar");
// 引入提示框和标题组件
require("echarts/lib/component/tooltip");
require("echarts/lib/component/title");


 1万+
1万+

 被折叠的 条评论
为什么被折叠?
被折叠的 条评论
为什么被折叠?
 到【灌水乐园】发言


