


一、 关于ELK实时日志分析平台
A. Elasticsearch是个开源分布式搜索引擎,它的特点有:分布式,零配置,自动发现,索引自动分片,索引副本机制,restful风格接口,多数据源,自动搜索负载等。
B. Logstash是一个完全开源的工具,他可以对你的日志进行收集、过滤,并将其存储供以后使用(如,搜索)。
C. Kibana 也是一个开源和免费的工具,它Kibana可以为 Logstash 和 ElasticSearch 提供的日志分析友好的 Web 界面,可以帮助您汇总、分析和搜索重要数据日志。
Filebeat、topbeat、packetbeat用于收集各应用、服务器等日志信息:
A. Filebeat:自定义需要收集的日志信息;
B. Topbeat:主要收集主机CPU、Mem、Disk、Process、Load等信息, 周期性的发送指标到elasticsearch。可以通过kibana创建自定义仪表盘如系统负载、服务器概述、内存或cpu使用情况、top进程、每个进程占用cpu或内存比例、磁盘使用情况等等。
C. Packetbeat:是分布式的,实时的嗅探每个事务的请求与响应,并将相关数据插入到elasticsearch中。packetbeat被动的嗅探网络流量,因此不会干扰应用程序。
二、 ELK安装
1、 下载软件文件
可以到官网(https://www.elastic.co/downloads)下载最新版本rpm包安装
[root@operationelk]# ll
total155472
-rw-r--r--1 root root 27255779 Oct 13 09:11 elasticsearch-2.4.1.rpm
-rw-r--r--1 root root 4210383 Oct 7 05:04 filebeat-1.3.1-x86_64.rpm
-rw-r--r--1 root root 34652108 Sep 6 23:35kibana-4.6.1-x86_64.rpm
-rw-r--r--1 root root 84745974 Oct 13 09:08 logstash-2.4.0.noarch.rpm
-rw-r--r--1 root root 4665910 Oct 7 05:05 packetbeat-1.3.1-x86_64.rpm
-rw-r--r--1 root root 3661571 Oct 7 05:05 topbeat-1.3.1-x86_64.rpm
[root@operationelk]#
2、 安装
yuminstall elasticsearch-2.4.1.rpm filebeat-1.3.1-x86_64.rpmlogstash-2.4.0.noarch.rpm kibana-4.6.1-x86_64.rpm topbeat-1.3.1-x86_64.rpm -y
可以通过如下命令查看安装信息,由于内容较多,摘取主要信息
rpm -qlelasticsearch
rpm -qllogstash
rpm -qlkibana
rpm -qlfilebeat
rpm -ql topbeat
配置文件
# tree/etc/{elasticsearch,logstash,filebeat,topbeat}
/etc/elasticsearch
|--elasticsearch.yml ##elasticsearch主配置文件
|--logging.yml ##elasticsearch日志配置文件
`--scripts
/etc/logstash
`--conf.d ##logstash配置目录
`-- filebeat-nginx.conf ##logstash会加载conf.d目录下所有.conf配置文件,默认没有需要自己编写配置规则
/etc/filebeat
|--filebeat.default ##filebeat默认配置
|-- filebeat.template.json ##topbeat索引模板,导入到elasticsearch
`--filebeat.yml ##filebeat配置文件
/etc/topbeat/
|--topbeat.template.json ##topbeat索引模板,导入到elasticsearch
`--topbeat.yml ##topbeat配置文件
安装主路径
# ls -ld/opt/{logstash,kibana} /usr/share/elasticsearch/
drwxr-xr-x10 root root 4096 10月 13 15:50/opt/kibana
drwxr-xr-x 5 logstash logstash 4096 10月 13 15:50/opt/logstash
drwxr-xr-x 6 root root 4096 10月 13 15:50/usr/share/elasticsearch/
三、 ELK配置
1、 Logstash配置
grok部分可以通过http://grokdebug.herokuapp.com/网站进行匹配成功再往下配置,否则后面没有数据展示;grok正则匹配部分较为严谨,多个或少个空格都匹配不成功。
# cat/etc/logstash/conf.d/filebeat-nginx.conf
input {
beats {
port => 5044
}
}
filter {
grok {
match => {
message =>"%{IPORHOST:remote_addr} , \[%{HTTPDATE:timestamp}\] ,%{IPORHOST:http_host} , \"%{WORD:http_verb}(?:%{PATH:baseurl}\?%{NOTSPACE:params}|%{DATA:raw_http_request})\" ,%{NUMBER:http_status_code} , %{NUMBER:bytes_read} , %{QS:referrer} ,%{QS:agent} , \"%{IPORHOST:client_ip}, %{IPORHOST:proxy_server}\" , -, - , - , %{IPORHOST:server_ip} , %{BASE10NUM:request_duration}"
}
}
}
output {
elasticsearch {
hosts =>["192.168.xxx.157:9200"]
index => "pcgames_access-%{+YYYY.MM.dd}"
document_type => "nginx2"
}
#stdout { codec => rubydebug }
}
Nginx自定义日志格式:
log_format beats '$remote_addr, [$time_local] , $host , "$request" , '
'$status , $body_bytes_sent ,"$http_referer" , '
'"$http_user_agent" ,"$http_x_forwarded_for" , '
'$upstream_addr , $upstream_status, $upstream_response_time , '
'$server_addr , $request_time';
Nginx日志内容:
192.168.xxx.21, [27/Oct/2016:00:00:01 +0800] , img0.pcgames.com.cn , "GEThttp://img0.pcgames.com.cn/pcgames/1610/19/3602544_DotaPITS5.jpg HTTP/1.1", 304 , 0 , "http://fight.pcgames.com.cn/dota2/?type=checked" ,"Mozilla/5.0 (Linux; Android 5.1.1; vivo X7Plus Build/LMY47V)AppleWebKit/537.36 (KHTML, like Gecko) Version/4.0 Chrome/38.0.0.0 MobileSafari/537.36" , "125.114.76.241, 192.168.xxx.35" , - , - , - ,192.168.xxx.23 , 0.000
2、 Elasticsearch集群配置
# cat /etc/elasticsearch/elasticsearch.yml|grep -v '#'
cluster.name:pcgames
node.name:node-1
path.data: /data1/elastic/ ##elasticsearch数据存放路径
path.logs: /data1/elastic/logs ##elasticsearch日志存放路径
network.host:0.0.0.0
http.port:9200
discovery.zen.ping.unicast.hosts:["192.168.xxx.157:9300", "192.168.xxx.202:9300"] #es集群
node.master: true ##将此节点配置为主节点
node.data:true
注:其他节点配置一样,如果只有两台主机集群,为防止脑裂,node.master一个配置为true做为主节点,一个配置false做为从节点
3、 Kibana配置
kibana最主要配置好elasticsearch主机信息,其他保持默认即可!
elasticsearch.url: http://localhost:9200
导入kibana报表模板
# wget http://download.elastic.co/beats/dashboards/beats-dashboards-1.0.0.tar.gz
# tarxzvf beats-dashboards-1.0.0.tar.gz
# cdbeats-dashboards-1.0.0/
./load.sh -url http://192.168.xxx.157:9200
4、 Topbeat
A、配置
cat/etc/topbeat/topbeat.yml |grep -v '#'
input:
period: 10
procs: [".*"]
stats:
system: true
process: true
filesystem: true
cpu_per_core: false
output:
elasticsearch:
hosts: ["192.168.xxx.157:9200"]
shipper:
logging:
files:
topbeat配置elasticsearch地址,其他保持默认即可
B、导入elasticsearch索引模板
# curl-XPUT 'http://localhost:9200/_template/topbeat'-d@/etc/topbeat/topbeat.template.json
{"acknowledged":true}
5、 Filebeat
A、配置
# cat/etc/filebeat/filebeat.yml
filebeat:
prospectors:
-
paths:
- /var/log/nginx.log ##需要收集的日志
input_type: log
registry_file: /var/lib/filebeat/registry
output:
logstash:
hosts: ["192.168.xxx.157:5044"] ##这里主机和端口注意要logstash所配置的端口
shipper:
logging:
files:
四、 ELK启动和关闭
1、 ELK启动
ELK启动没有严格意义上的先后顺序,但是Filebeat收集信息上报logstash;logstash需要写入数据到elasticsearch,Topbeat数据写入elasticsearch;kibana需要读取elasticsearch数据实现最终展示。所以一般按如下启动:
# /etc/init.d/elasticsearchstart
# /etc/init.d/logstashstart
# /etc/init.d/filebeatstart
# /etc/init.d/topbeatstart
# /etc/init.d/kibanastart
2、 ELK关闭
#/etc/init.d/kibana stop
#/etc/init.d/filebeat stop
#/etc/init.d/topbeat stop
#/etc/init.d/logstash stop
#/etc/init.d/elasticsearch stop
五、 Kibana使用和展示
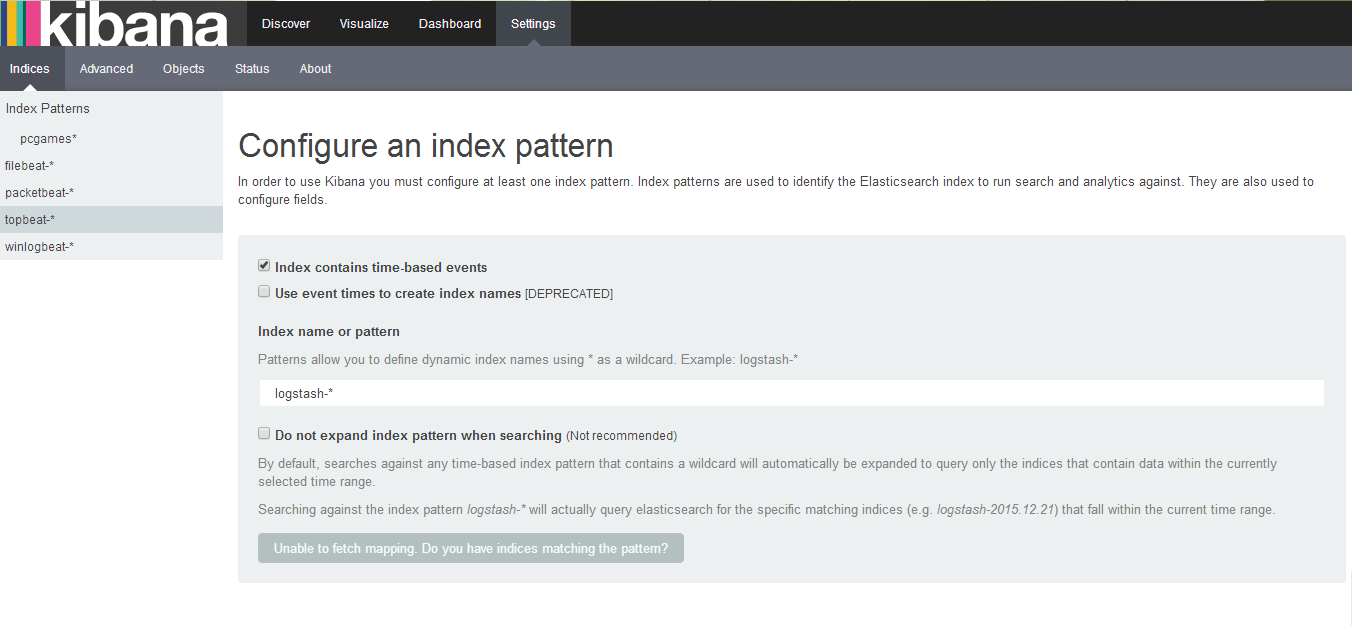
启动kibana后,访问http://192.168.xxx.157:5601/出现如下界面,提示创建索引
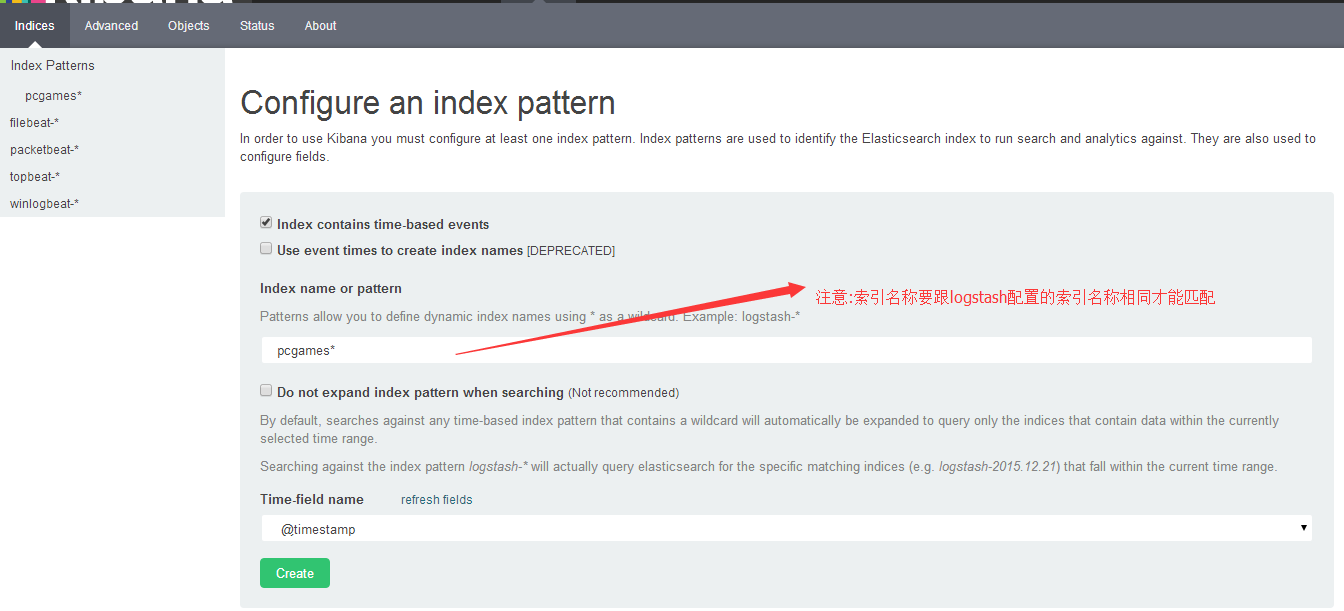
1、 创建索引Index

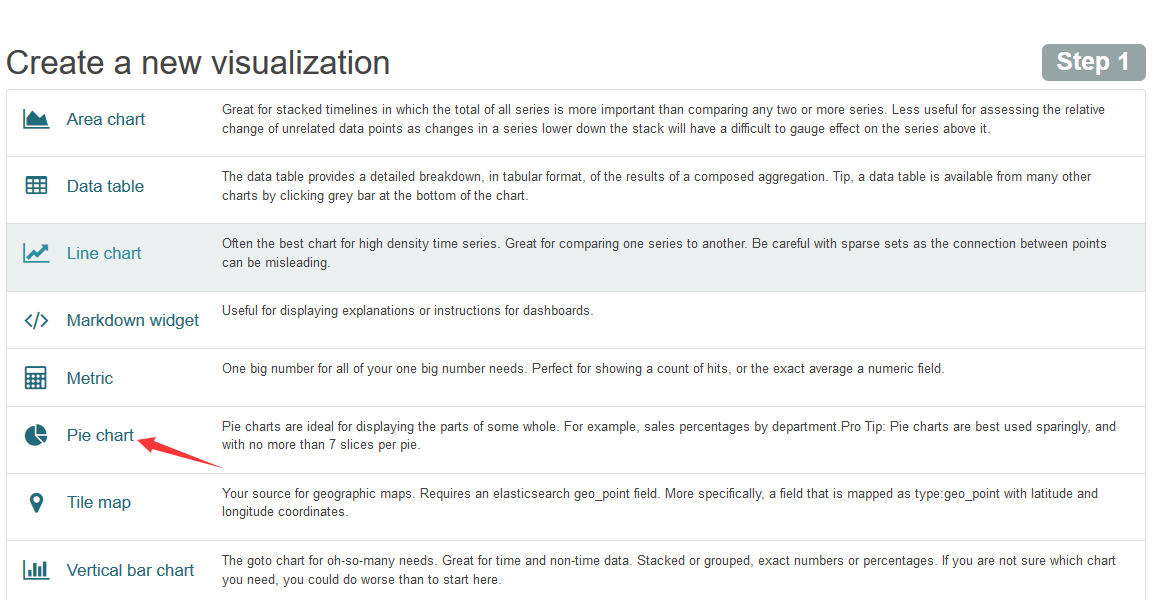
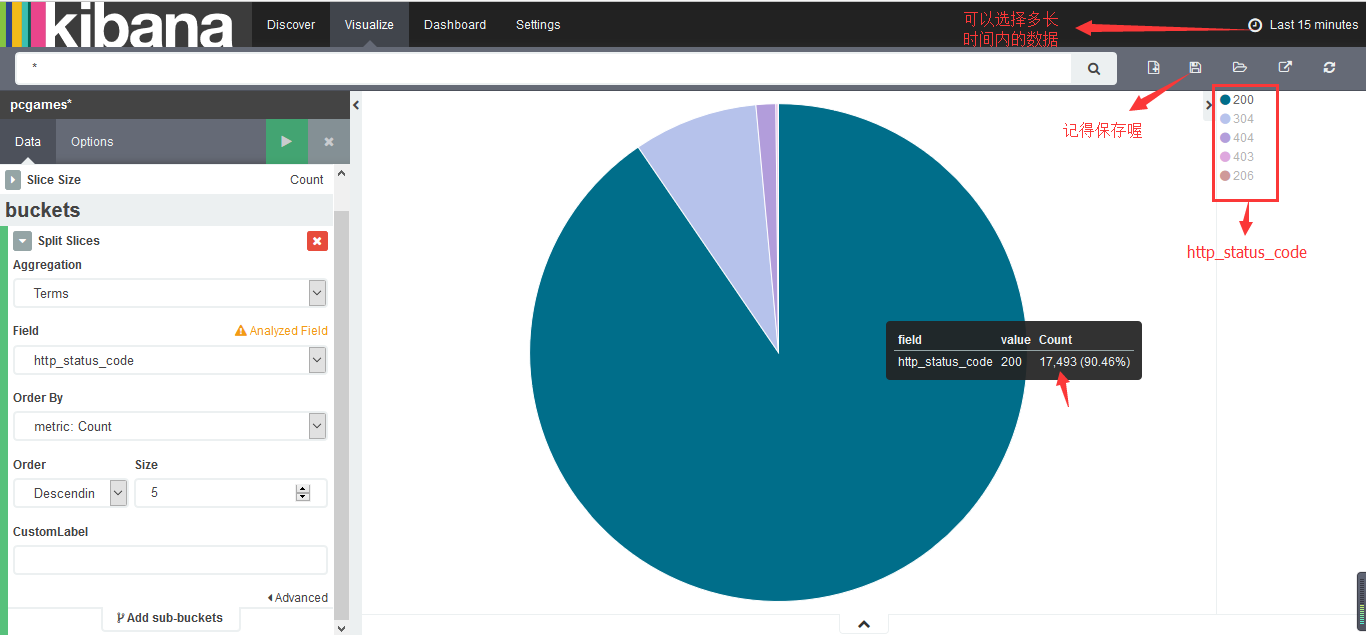
2、 定制可视化图形(visualization)
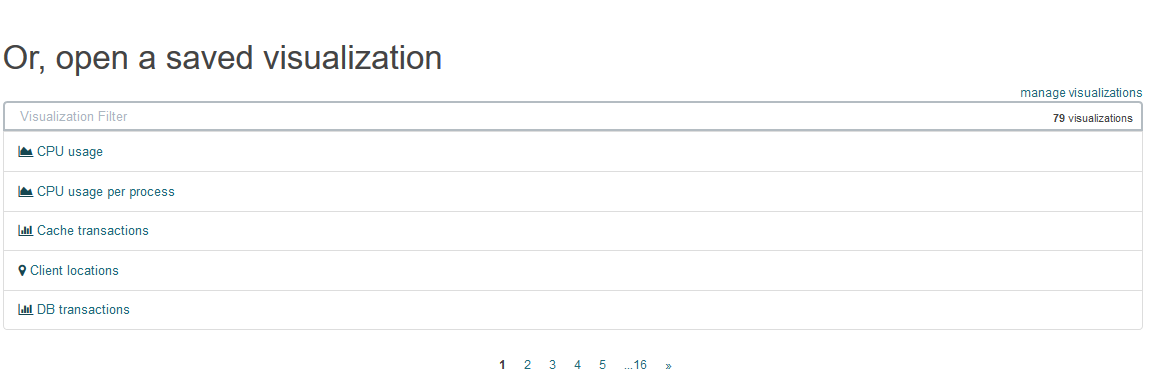
在这里可以创建新的可视化图形或者打开保存的可视化图形:
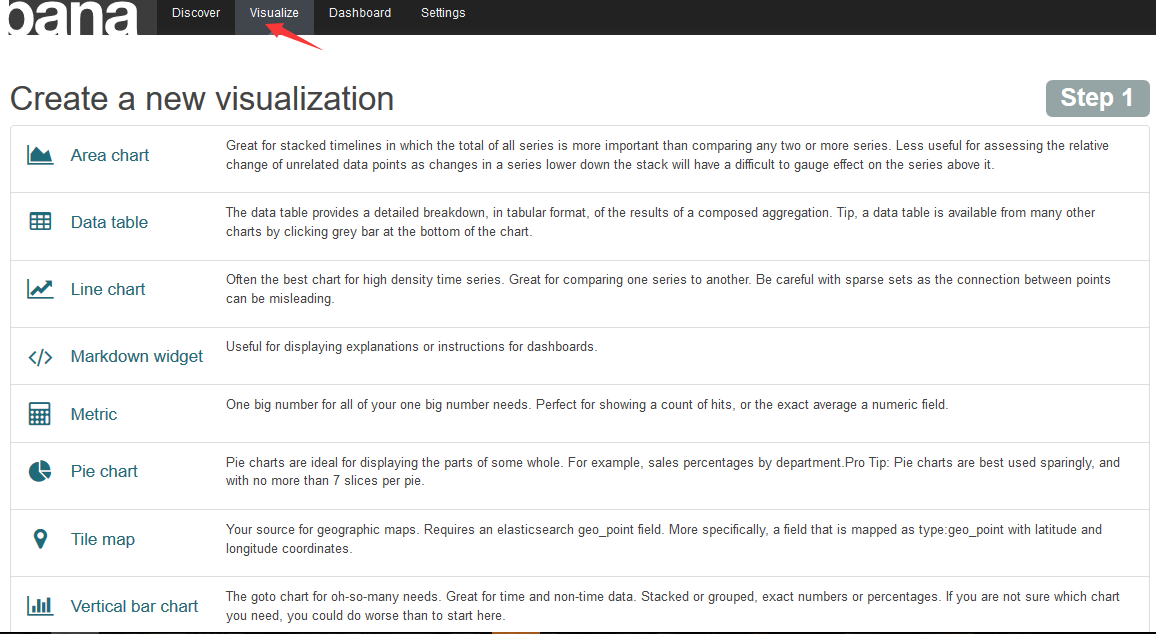
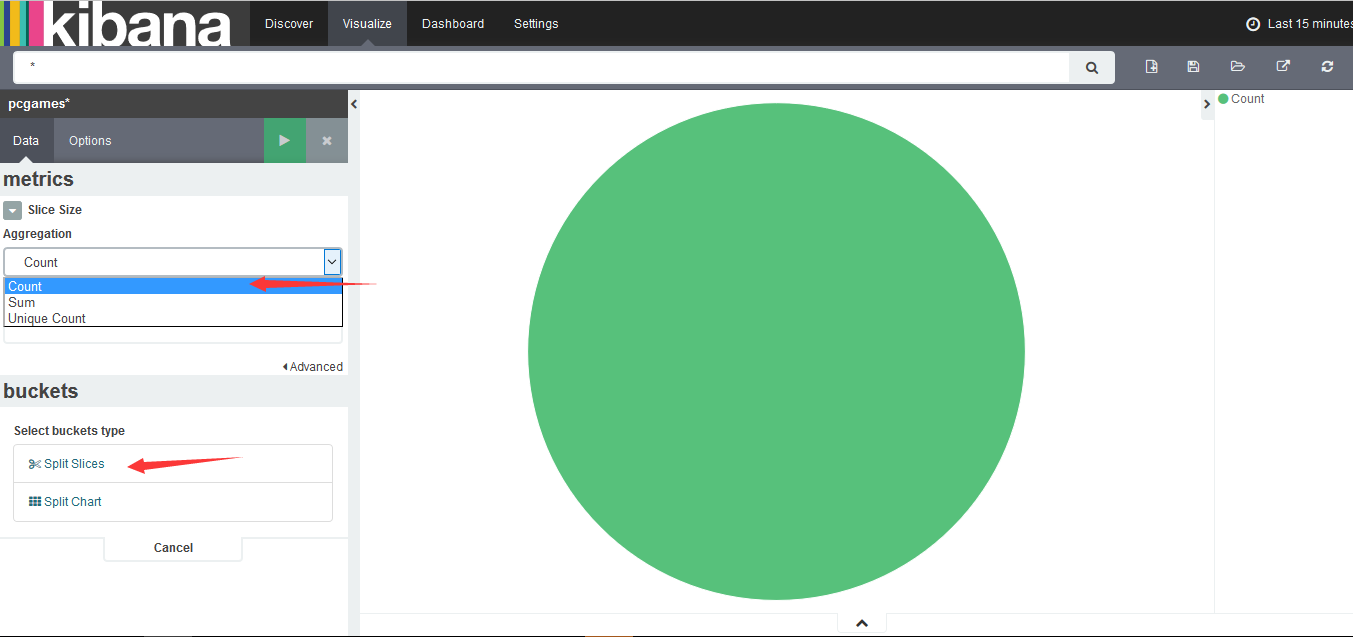
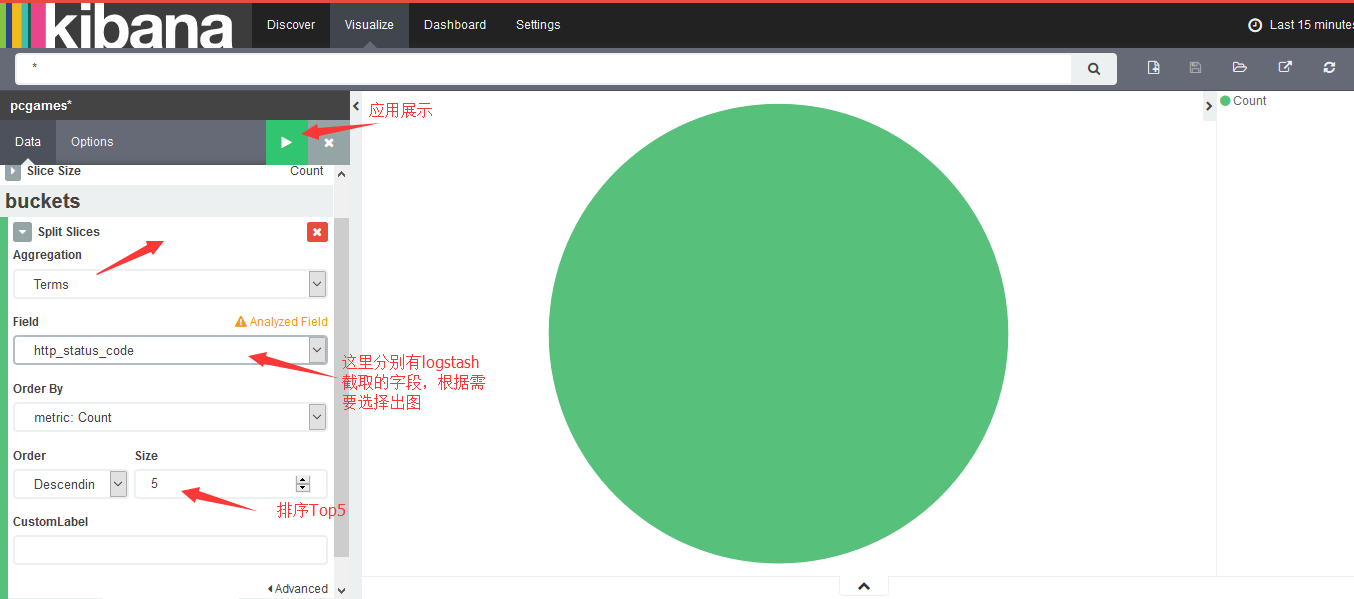
当我们需要定制自己定义的数据源时,我们需要选择创建新的图形,现在我们来创建一个饼状图形。
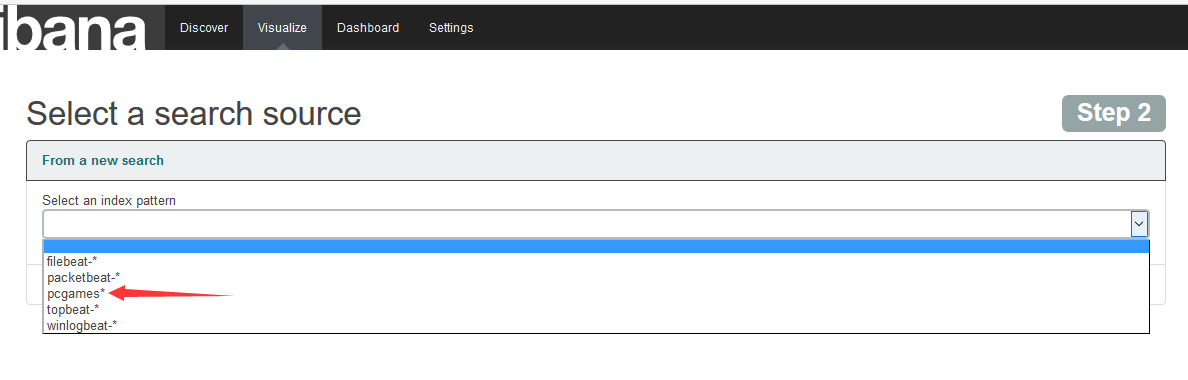
选择我们刚刚创建的index数据源
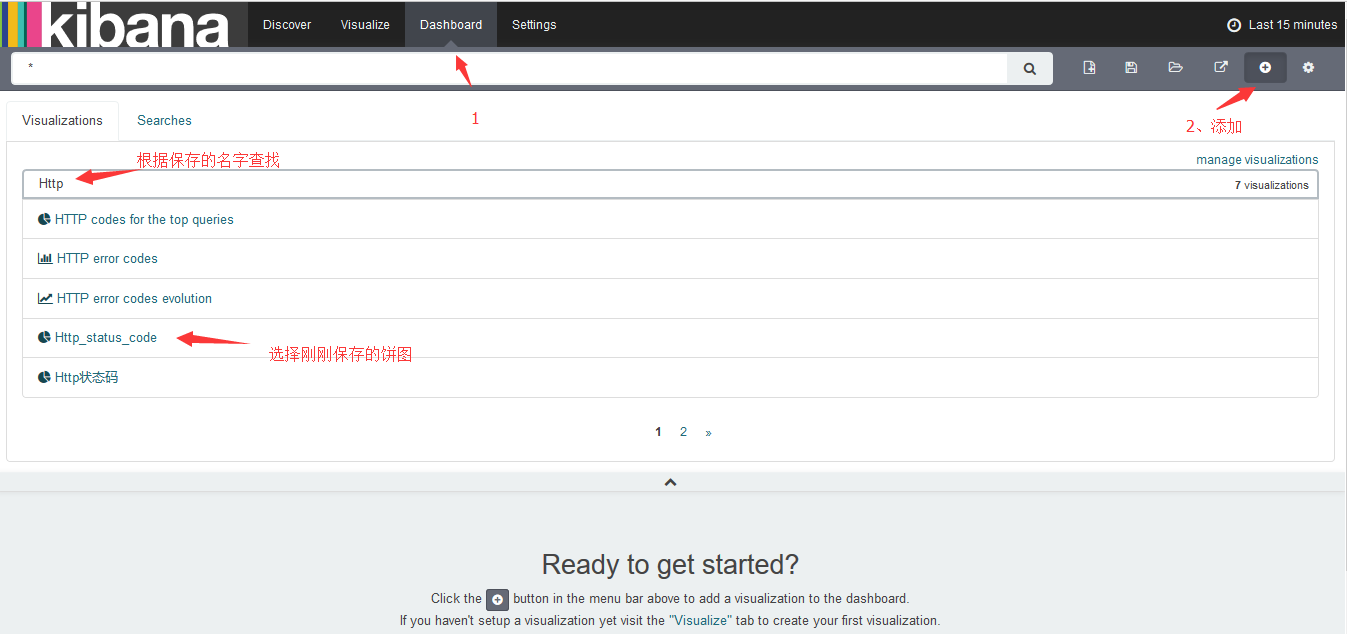
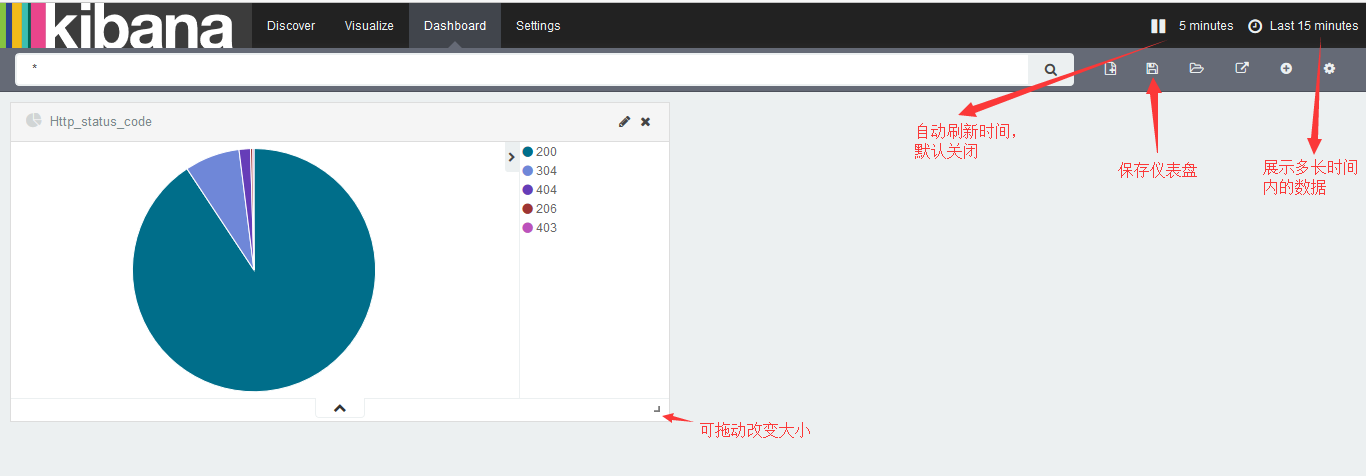
3、 创建仪表盘

附上 百度云盘共享安装包:http://pan.baidu.com/s/1hs2q4tQ
ELK中文指南 http://kibana.logstash.es/content/index.html
grok debug :http://grokdebug.herokuapp.com/
运维生存时间:http://www.ttlsa.com/log-system/elk/


 2474
2474

 被折叠的 条评论
为什么被折叠?
被折叠的 条评论
为什么被折叠?
 到【灌水乐园】发言


