


在调用echarts的API时也踩了不少坑,这里作下记录
首先地图数据要用到阿里的数据可视化平台
人数数据我们写一个js方法生成随机数
  /*
    取n-m之间的随机数
  */
export function mathSum (m, n){
  const num = Math.floor(Math.random()*(m - n) + n);
  return num
}
然后我们创建地图组件
<template>
  <div class="">
    <div id="main" ref="chart" class="echarts-box"></div>
  </div>
</template>

<script lang="ts" setup>
import { onMounted, ref } from 'vue'
import { mathSum } from '@/utils/index'
// 引入 echarts 核心模块,核心模块提供了 echarts 使用必须要的接口。
import * as echarts from 'echarts/core';
import {
  TitleComponent,
  ToolboxComponent,
  TooltipComponent,
  VisualMapComponent,
  GeoComponent
} from 'echarts/components';
import { MapChart } from 'echarts/charts';
import { CanvasRenderer } from 'echarts/renderers';
import axios from 'axios';
echarts.use([
  TitleComponent,
  ToolboxComponent,
  TooltipComponent,
  VisualMapComponent,
  GeoComponent,
  MapChart,
  CanvasRenderer
]);
const chart = ref()
onMounted(() => {
  getData()
})
const getData = async () => {
  var ROOT_PATH = 'https://geo.datav.aliyun.com';
  await axios.get(ROOT_PATH + '/areas_v3/bound/310000_full.json').then(res => {
    // console.log('res-->', res.data)
    init(res.data)
  }).catch(err => {

  });
}

const init = (data) => {
  let result = data.features.map(item => {
    let val = mathSum(800, 50000)
    return {
      name: item.properties.name,
      value: val
    }
  })
  var myChart = echarts.init(chart.value)
  echarts.registerMap('sh', data)
  var option = {
    title: {
      text: '上海人口分布图'
    },
    visualMap: {
        min: 800,
        max: 50000,
        text: ['高', '低'],
        realtime: false,
        calculable: true,
        inRange: {
          color: ['lightskyblue', 'yellow', 'orangered']
        }
      },
    series: [
      {
        type: 'map',
        map: 'sh',
        data: result
      }
    ]
  }
  myChart.setOption(option)
}
</script>

<style lang="scss" scoped>
.echarts-box {
  height: 300px;
}
</style>
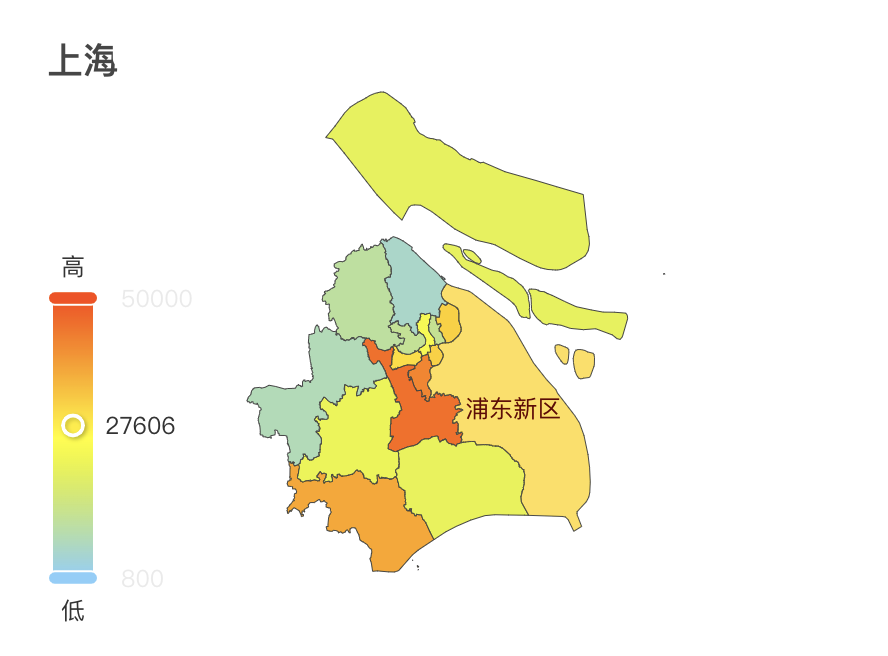
最后 运行效果


 4111
4111


 被折叠的 条评论
为什么被折叠?
被折叠的 条评论
为什么被折叠?
 到【灌水乐园】发言


