


echarts绘制上海市乡镇级地图
echarts 最新版本不支持GeometryCollection,虽然有人在4年前就提了issue
<!DOCTYPE html>
<html lang="en">
<head>
    <meta charset="UTF-8">
    <script src="./jquery-latest.js"></script>
    <script src="./echarts.js"></script>
    <title>上海市镇级地图</title>
</head>
<body>
    <div id="map" style="width: 600px;height: 700px;margin: 0 auto"></div>
</body>
<script>
    var myChart = echarts.init(document.getElementById('map'));
    $.get("./sh.json",function(geoJson){
        echarts.registerMap('sh',geoJson,{});
        var option = {
            series: [
                {
                    type: 'map',
                    mapType: 'sh',
                    aspectScale: 0.85
                }
            ]
        };
        myChart.setOption(option);
    });
</script>
</html>
需改造echarts.js中的parseGeoJSON函数
function parseGeoJSON(geoJson, nameProperty) {

      geoJson = decode(geoJson);
      return map(filter(geoJson.features, function (featureObj) {
        // Output of mapshaper may have geometry null

		console.info(featureObj)
        return featureObj.geometry && featureObj.properties
		&& (
                // avoid length error if missing coordinates
                (featureObj.geometry.coordinates && featureObj.geometry.coordinates.length > 0)
                // allow GeometryCollection
                || (featureObj.geometry.geometries && featureObj.geometry.geometries.length > 0)
            )

		;
      }), function (featureObj) {
        var properties = featureObj.properties;
        var geo = featureObj.geometry;
        var geometries = [];

        switch (geo.type) {
          case 'Polygon':
            var coordinates = geo.coordinates; // According to the GeoJSON specification.
            // First must be exterior, and the rest are all interior(holes).

            geometries.push(new GeoJSONPolygonGeometry(coordinates[0], coordinates.slice(1)));
            break;

          case 'MultiPolygon':
            each(geo.coordinates, function (item) {
              if (item[0]) {
                geometries.push(new GeoJSONPolygonGeometry(item[0], item.slice(1)));
              }
            });
            break;

          case 'LineString':
            geometries.push(new GeoJSONLineStringGeometry([geo.coordinates]));
            break;
            // 支持GeometryCollection
		case 'GeometryCollection':
            var geometries2 = geo.geometries;
            each$1(geometries2, function (geo) { // OR      zrUtil.each(geometries2, function (geo) {
                var coordinates = geo.coordinates;
                if (geo.type === 'Polygon') { // this is a full copy from above
                    geometries.push({
                        type: 'polygon',
                        exterior: coordinates[0],
                        interiors: coordinates.slice(1)
                    });
                } // end full copy
            });
            break;

          case 'MultiLineString':
            geometries.push(new GeoJSONLineStringGeometry(geo.coordinates));
        }

        var region = new GeoJSONRegion(properties[nameProperty || 'name'], geometries, properties.cp);
        region.properties = properties;
        return region;
      });
    }
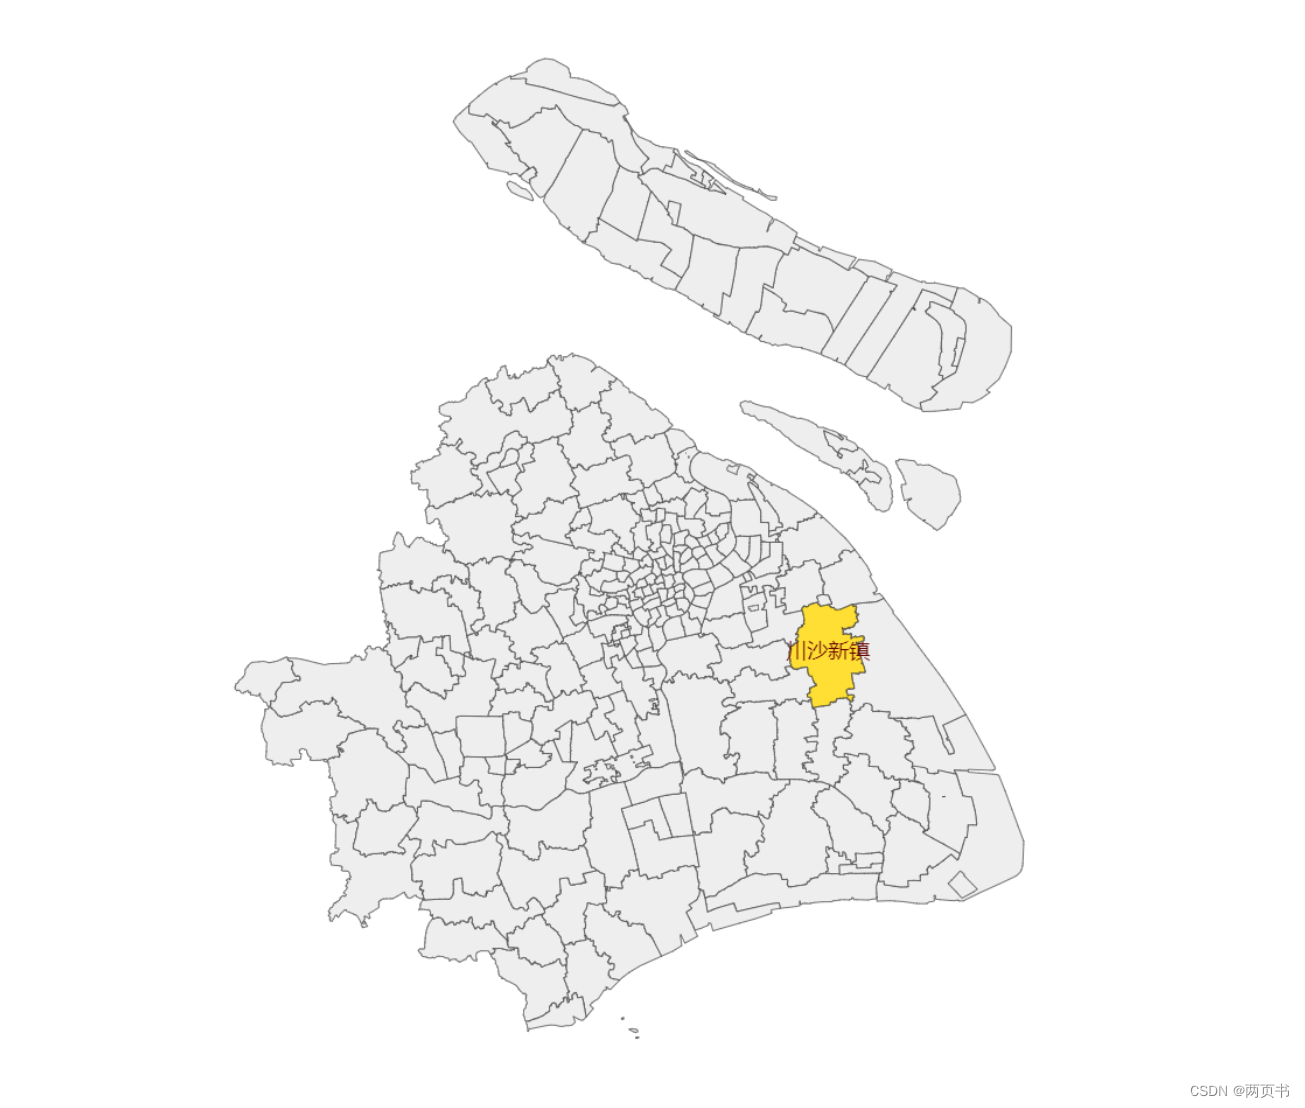
成效


 4141
4141


 被折叠的 条评论
为什么被折叠?
被折叠的 条评论
为什么被折叠?
 到【灌水乐园】发言


