


<div id="echartsBar" class="echartsBar" style="width: 100%; height: 150px"></div>
chart = echarts.init(document.getElementById('echartsBar'), true)
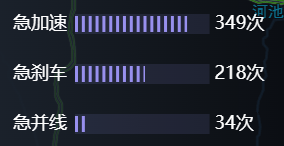
const sjyslist = [319, 218, 34];
chart.setOption(
// 通过setOption来生成柱状图
{
grid: {
top: '0',
left: '70',
right: '13%',
bottom: '0',
},
xAxis: {
axisLine: {
show: false,
},
axisTick: {
show: false,
},
axisLabel: {
show: false,
},
splitLine: {
show: false,
},
},
yAxis: [{
data: ['急加速', '急刹车', '急并线'],
inverse: true,
splitLine: {
show: false,
},
axisTick: {
show: false,
},
axisLine: {
show: false,
},
axisLabel: {
color: '#fff',
fontSize: 18,
// rotate: 45,
},
},
{
type: 'category',
axisTick: { show: false }, // 不显示刻度线
axisLabel: {
color: '#000',
},
axisLine: {
show: false,
},
inverse: true,
},
],
series: [
{
name: '进度条',
yAxisIndex: 0,
type: 'pictorialBar',
symbol: 'rect', // 长方形
symbolRepeat: 'fixed',
symbolMargin: '2', // 缝隙
symbolClip: true,
// 图片长宽比
symbolSize: ['3', '16'],
// 柱子之间的间距
barCategoryGap: 5,
zlevel: 1, // zlevel 大的 Canvas 会放在 zlevel 小的 Canvas 的上面
data: [
{
value: 349,
itemStyle: {
// 图形样式。
normal: {
color: '#9890EE',
},
},
},
{
value: 218,
itemStyle: {
// 图形样式。
normal: {
color: '#9890EE',
},
},
},
{
value: 34,
itemStyle: {
// 图形样式。
normal: {
color: '#9890EE',
},
},
},
],
},
{
name: '进度条背景',
type: 'bar',
yAxisIndex: 1,
barGap: '-100%', // 不同系列的柱间距离,为百分比。
barCategoryGap: 5,
barWidth: 20,
data: [maxValue, maxValue, maxValue],
color: 'rgba(152, 144, 238, 0.12)', // 柱条颜色
label: {
normal: {
show: true, // 是否显示进度条上方的百分比
formatter: (series) => sjyslist[series.dataIndex]+'次',
position: 'right',
textStyle: {
color: '#ffffff', // 进度条上方百分比字体颜色
fontSize: 18,
},
// offset: [0, -35],
},
},
},
],
},
);


 4533
4533


 被折叠的 条评论
为什么被折叠?
被折叠的 条评论
为什么被折叠?
 到【灌水乐园】发言


