


目录
8,访问网页验证 http://192.168.100.12:9090/
5,访问地址 http://192.168.100.13:9100/metrics 就可以查看到 node_exporter 在被监控端收集的监控信息
6,在 Prometheus 里添加节点node_exporter
8,访问prometheus服务地址 ,查看prometheus服务
文章一,Prometheus部署操作
1,Prometheus的介绍
Prometheus是一个开源的系统监控和报警系统,现在已经加入到CNCF基金会,成为继k8s之后第二个在CNCF托管的项目,在kubernetes容器管理系统中,通常会搭配prometheus进行监控,同时也支持多种exporter采集数据,还支持pushgateway进行数据上报,Prometheus性能足够支撑上万台规模的集群。
2,部署 Prometheus
环境准备
| Prometheus服务器 | 192.168.100.12 |
| node_exporter节点 服务器 | 192.168.100.13 |
| grafana 服务器 | 192.168.100.12 |
3,Prometheus的部署下载地址
https://prometheus.io/download/

https://github.com/prometheus/prometheus/releases/download/v2.37.6/prometheus-2.37.6.linux-amd64.tar.gz
4,上传prometheus安装包并解压
[root@localhost ~]# mkdir prometheus
[root@localhost ~]# cd prometheus/
[root@localhost prometheus]# rz -E
rz waiting to receive.
[root@localhost prometheus]# tar zxf prometheus-2.37.6.linux-amd64.tar.gz
[root@localhost prometheus]# ls
prometheus-2.37.6.linux-amd64  prometheus-2.37.6.linux-amd64.tar.gz
[root@localhost prometheus]# mv prometheus-2.37.6.linux-amd64 /usr/local/prometheus
[root@localhost prometheus]# cd /usr/local/prometheus/
[root@localhost prometheus]# ls
console_libraries  LICENSE  prometheus      promtool
consoles           NOTICE   prometheus.yml
[root@localhost prometheus]#
[root@localhost prometheus]# cp prometheus.yml prometheus.yml.bak
5,修改prometheus.yml 文件
vim prometheus.yml

# my global config
global:
  scrape_interval: 15s # Set the scrape interval to every 15 seconds. Default is every 1 minute.
  evaluation_interval: 15s # Evaluate rules every 15 seconds. The default is every 1 minute.
  # scrape_timeout is set to the global default (10s).

# Alertmanager configuration
alerting:
  alertmanagers:
    - static_configs:
        - targets:
          # - alertmanager:9093

# Load rules once and periodically evaluate them according to the global 'evaluation_interval'.
rule_files:
  # - "first_rules.yml"
  # - "second_rules.yml"

# A scrape configuration containing exactly one endpoint to scrape:
# Here it's Prometheus itself.
scrape_configs:
  # The job name is added as a label `job=<job_name>` to any timeseries scraped from this config.
  - job_name: "prometheus"

    # metrics_path defaults to '/metrics'
    # scheme defaults to 'http'.

    static_configs:
      - targets: ["192.168.100.12:9090"]    ###只修改这,将地址改为本机IP地址
~
6,配置系统启动文件,设置自启动
第一种设置启动方式

vim /usr/lib/systemd/system/prometheus.service

[Unit]
Description=prometheus-server
After=network-online.target remote-fs.target nss-lookup.target
Wants=network-online.target

[Service]
Type=simple
ExecStart=/usr/local/prometheus/prometheus --config.file=/usr/local/prometheus/prometheus.yml --web.enable-lifecycle --storage.tsdb.path=/usr/local/prometheus/data --storage.tsdb.retention.time=7d --web.max-connections=512 --web.read-timeout=3m --query.max-concurrency=25 --query.timeout=2m
ExecReload=/bin/kill -s HUP $MAINPID
ExecStop=/bin/kill -s TERM $MAINPID

[Install]
WantedBy=multi-user.target
第二种设置启动方式

cd /usr/local/prometheus
./prometheus
7,添加开机自启动,启动 检查
systemctl start prometheus  # 启动服务
systemctl enable prometheus.service   #开机自启服务
systemctl daemon-reload              #重新加载服务
systemctl status prometheus.service   #查看服务启动状态

[root@localhost prometheus]# netstat -natp | grep :9090    查看服务端口
tcp        0      0 192.168.100.12:58066    192.168.100.12:9090     ESTABLISHED 16388/prometheus
tcp6       0      0 :::9090                 :::*                    LISTEN      16388/prometheus
tcp6       0      0 192.168.100.12:9090     192.168.100.12:58066    ESTABLISHED 16388/prometheus


[root@localhost ~]# ps -ef |grep prometheus       #查看服务进程
root      16291   1305  0 12:44 pts/0    00:00:00 vim /usr/lib/systemd/system/prometheus.service
root      16388      1  0 12:48 ?        00:00:13 /usr/local/prometheus/prometheus --config.file=/usr/local/prometheus/prometheus.yml --web.enable-lifecycle --storage.tsdb.path=/usr/local/prometheus/data --storage.tsdb.retention.time=7d --web.max-connections=512 --web.read-timeout=3m --query.max-concurrency=25 --query.timeout=2m
root      16534  16460  0 14:56 pts/2    00:00:00 vim prometheus.yml
root      16576  16484  0 15:10 pts/3    00:00:00 grep --color=auto prometheus
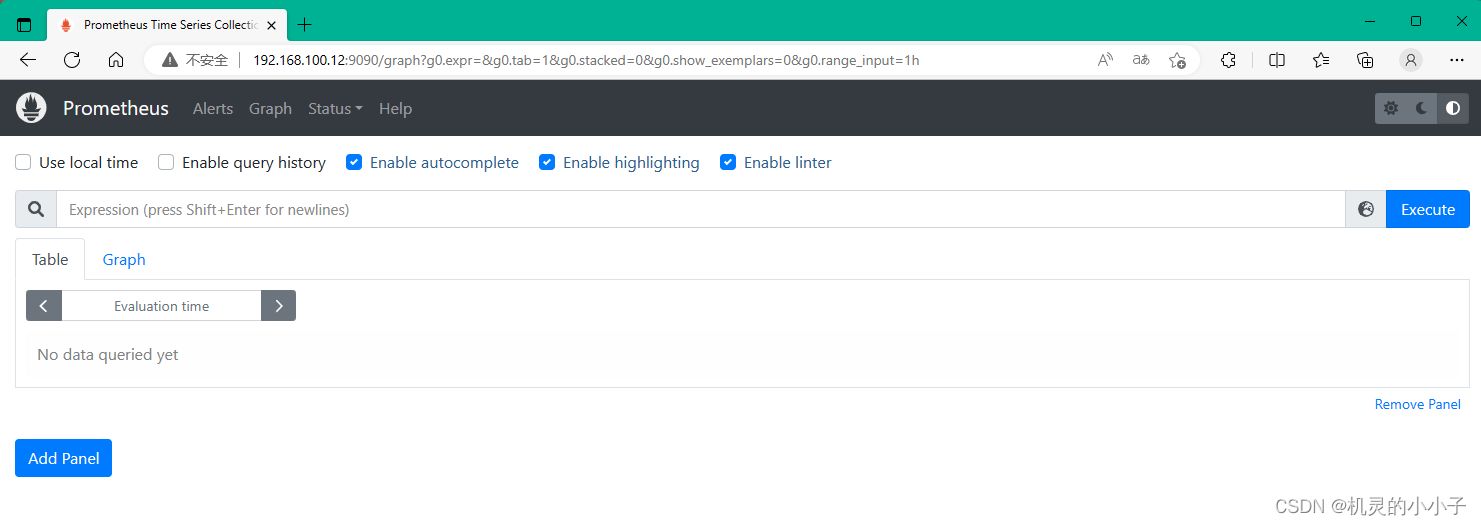
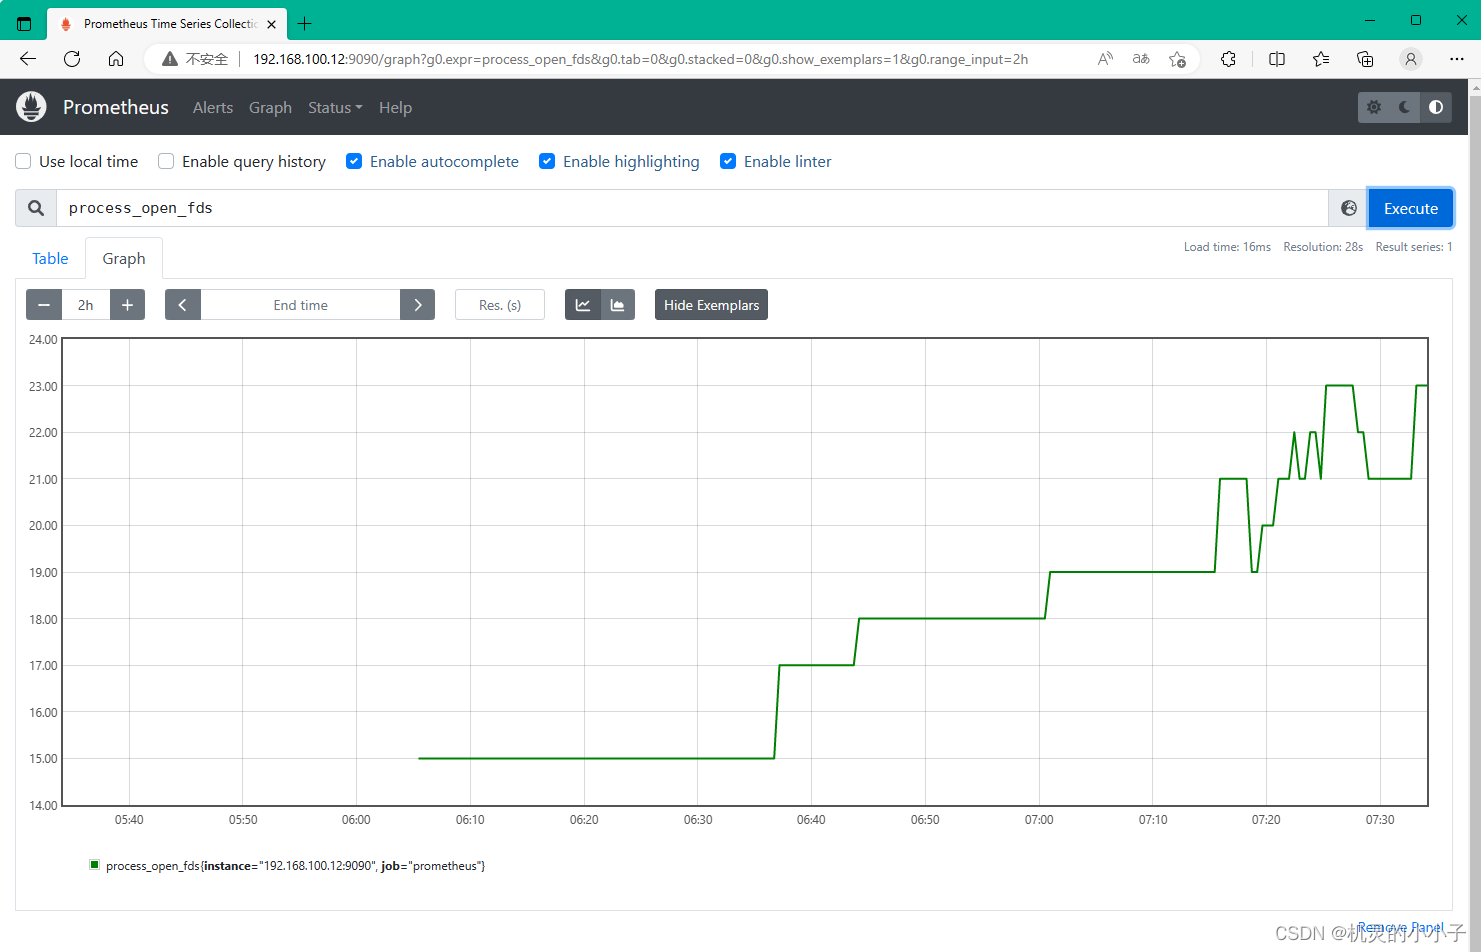
8,访问网页验证 http://192.168.100.12:9090/
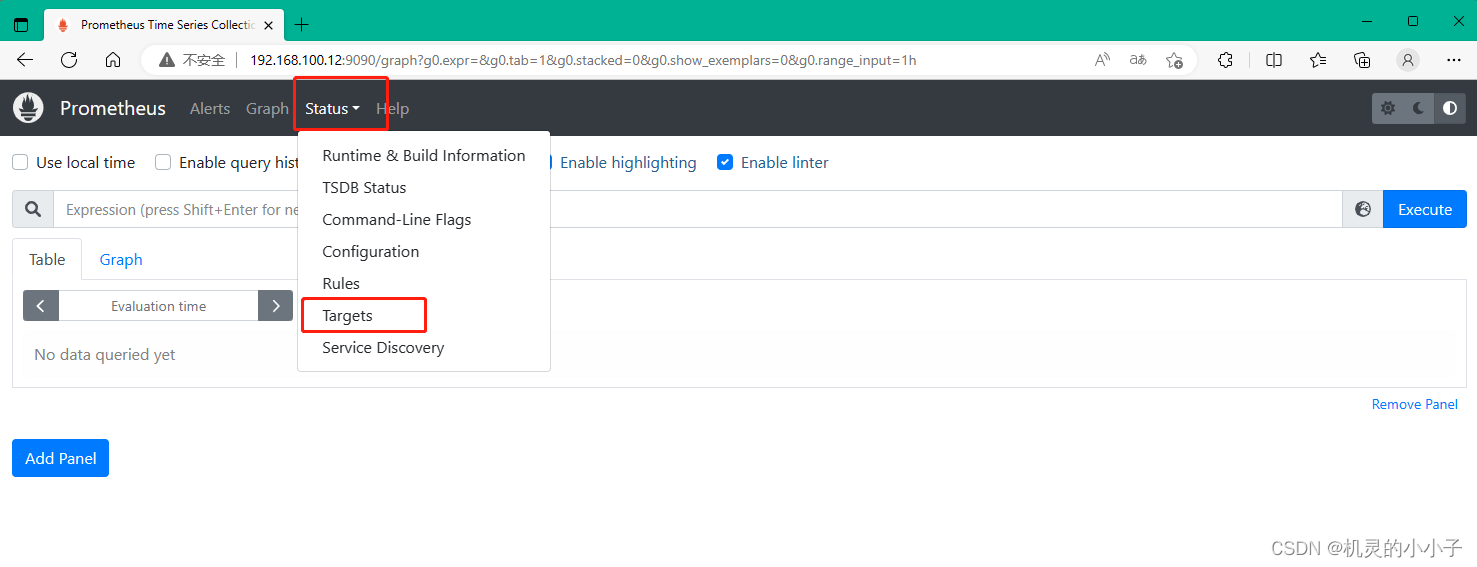
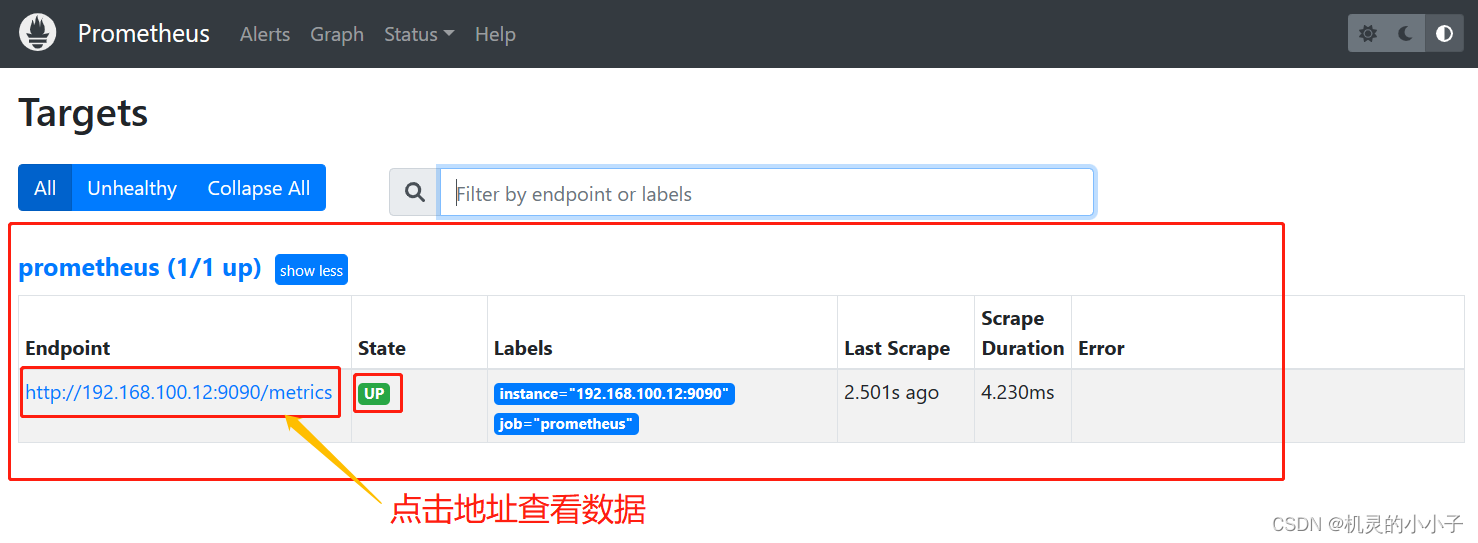
9,查看监控状态

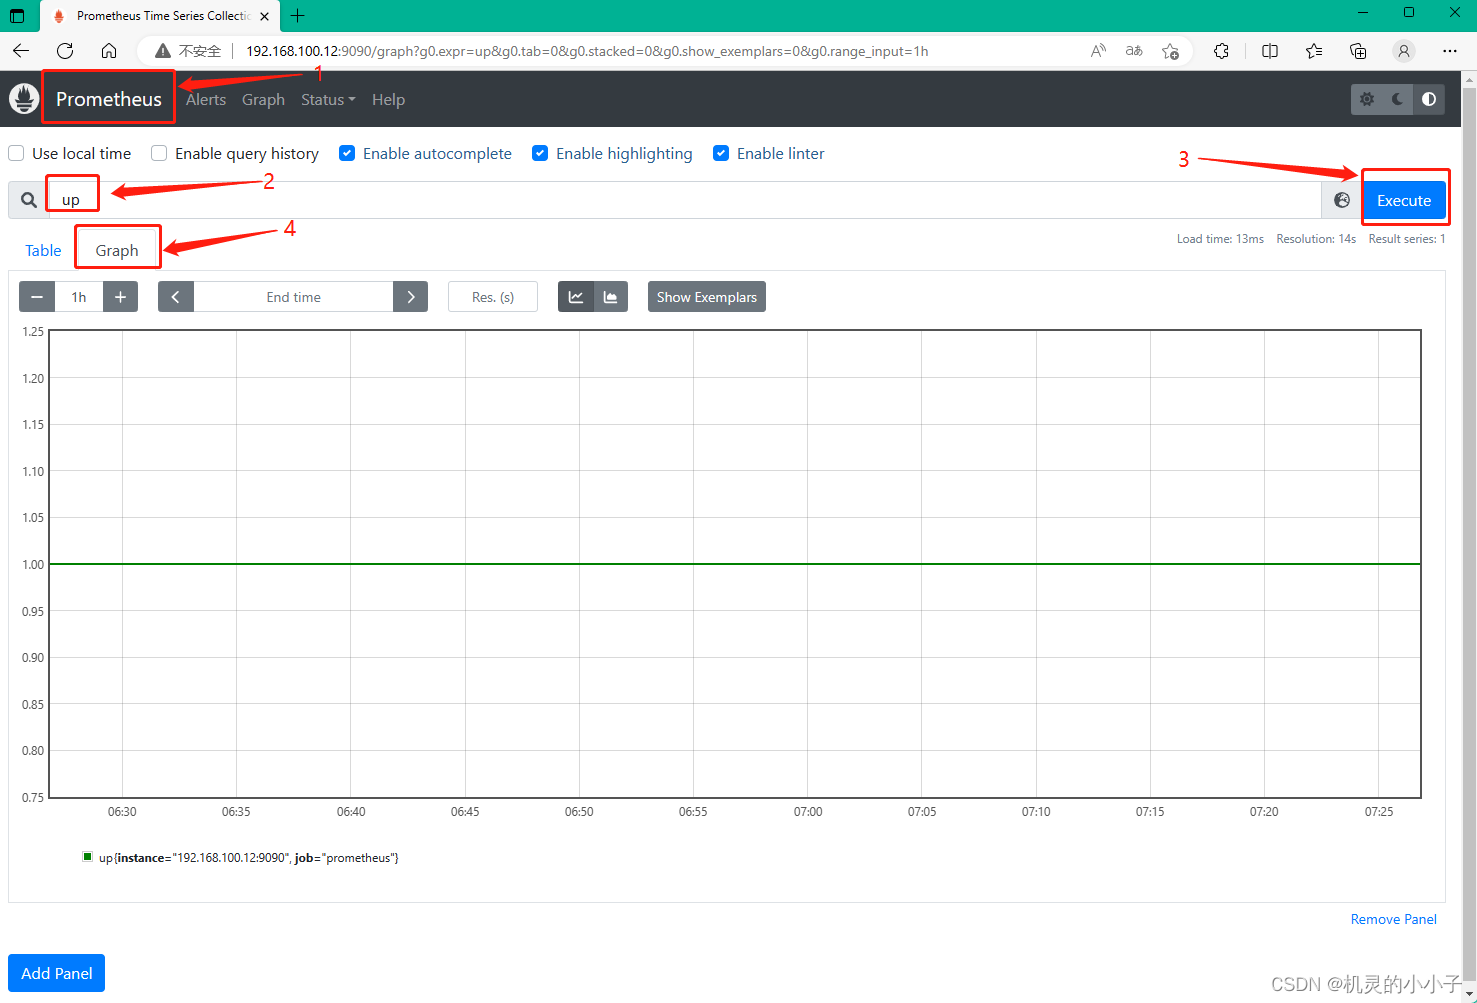
10,查看折线图 (步骤)

二, 部署Exporters
1,监控远程linux主机
在(被监控端 agent) linux 主机上安装 node_exporter 组件
下载node_exporter 组件地址

https://prometheus.io/download/

https://github.com/prometheus/node_exporter/releases/download/v1.5.0/node_exporter-1.5.0.linux-amd64.tar.gz
2,上传node_exporter组件安装包
[root@localhost /]# mkdir prometheus.node_exporter
[root@localhost prometheus.node_exporter]# rz -E
rz waiting to receive.
[root@localhost prometheus.node_exporter]# tar zxf node_exporter-1.5.0.linux-amd64.tar.gz  ##解压包
[root@localhost prometheus.node_exporter]# ls
node_exporter-1.5.0.linux-amd64  node_exporter-1.5.0.linux-amd64.tar.gz
[root@localhost prometheus.node_exporter]# cd node_exporter-1.5.0.linux-amd64/
[root@localhost node_exporter-1.5.0.linux-amd64]#
[root@localhost node_exporter-1.5.0.linux-amd64]# ls
LICENSE  node_exporter  NOTICE
[root@localhost node_exporter-1.5.0.linux-amd64]# mv node_exporter  /usr/local/bin/  ###添加至环境中
[root@localhost node_exporter-1.5.0.linux-amd64]# ls /usr/local/bin/
node_exporter
[root@localhost node_exporter-1.5.0.linux-amd64]#
3,配置启动文件,设置自启动
vim /usr/lib/systemd/system/node_exporter.service

[Unit]
Description=node_exporter
Documentation=https://prometheus.io/
After=network.target

[Service]
Type=simple
ExecStart=/usr/local/bin/node_exporter \
--collector.ntp \
--collector.mountstats \
--collector.systemd \
--collector.tcpstat

ExecReload=/bin/kill -HUP $MAINPID
Restart=on-failure

[Install]
WantedBy=multi-user.target
4,启动node_exporter
systemctl start node_exporter

systemctl enable node_exporter

netstat -natp | grep :9100


[root@localhost /]# netstat -natp | grep :9100
tcp6       0      0 :::9100                 :::*                    LISTEN      1390/node_exporter
5,访问地址 http://192.168.100.13:9100/metrics 就可以查看到 node_exporter 在被监控端收集的监控信息

6,在 Prometheus 里添加节点node_exporter
vim /usr/local/prometheus/prometheus.yml   添加3行
  - job_name: 'agent'
    static_configs:
    - targets: ['192.168.100.13:9100']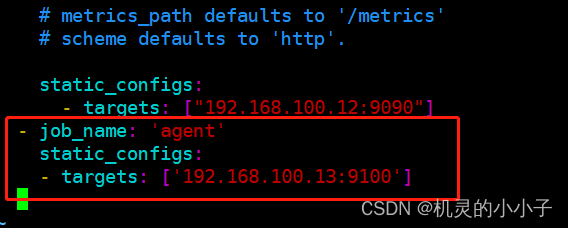
7,重启prometheus 服务
systemctl restart prometheus.service 8,访问prometheus服务地址 ,查看prometheus服务
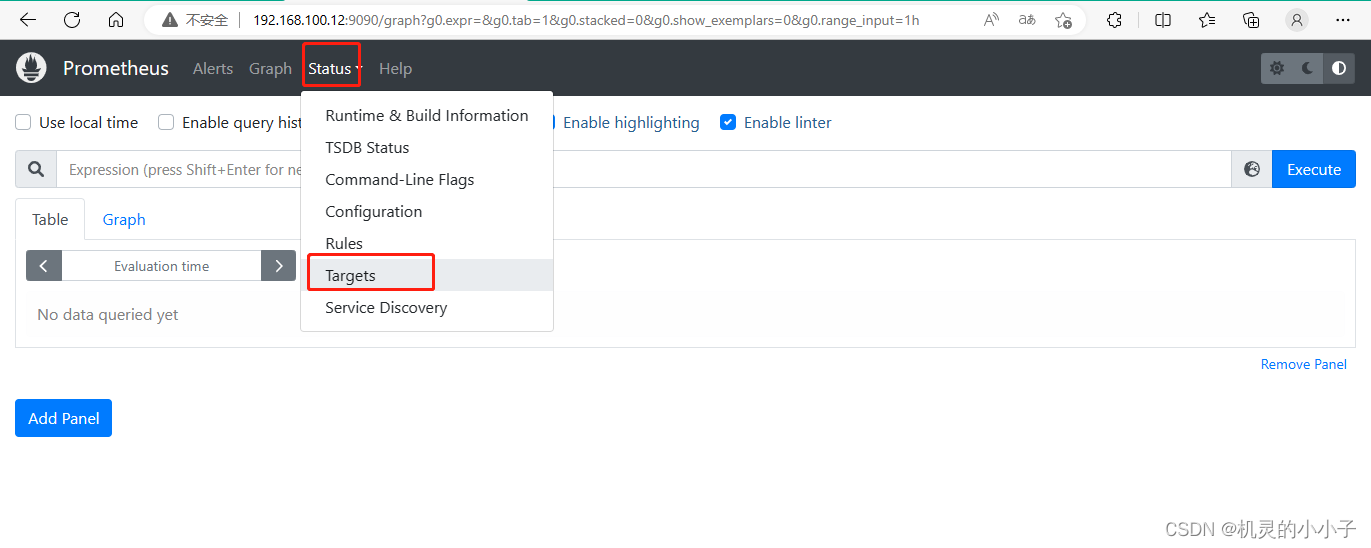

9.查看 Promrtheus 的服务发现
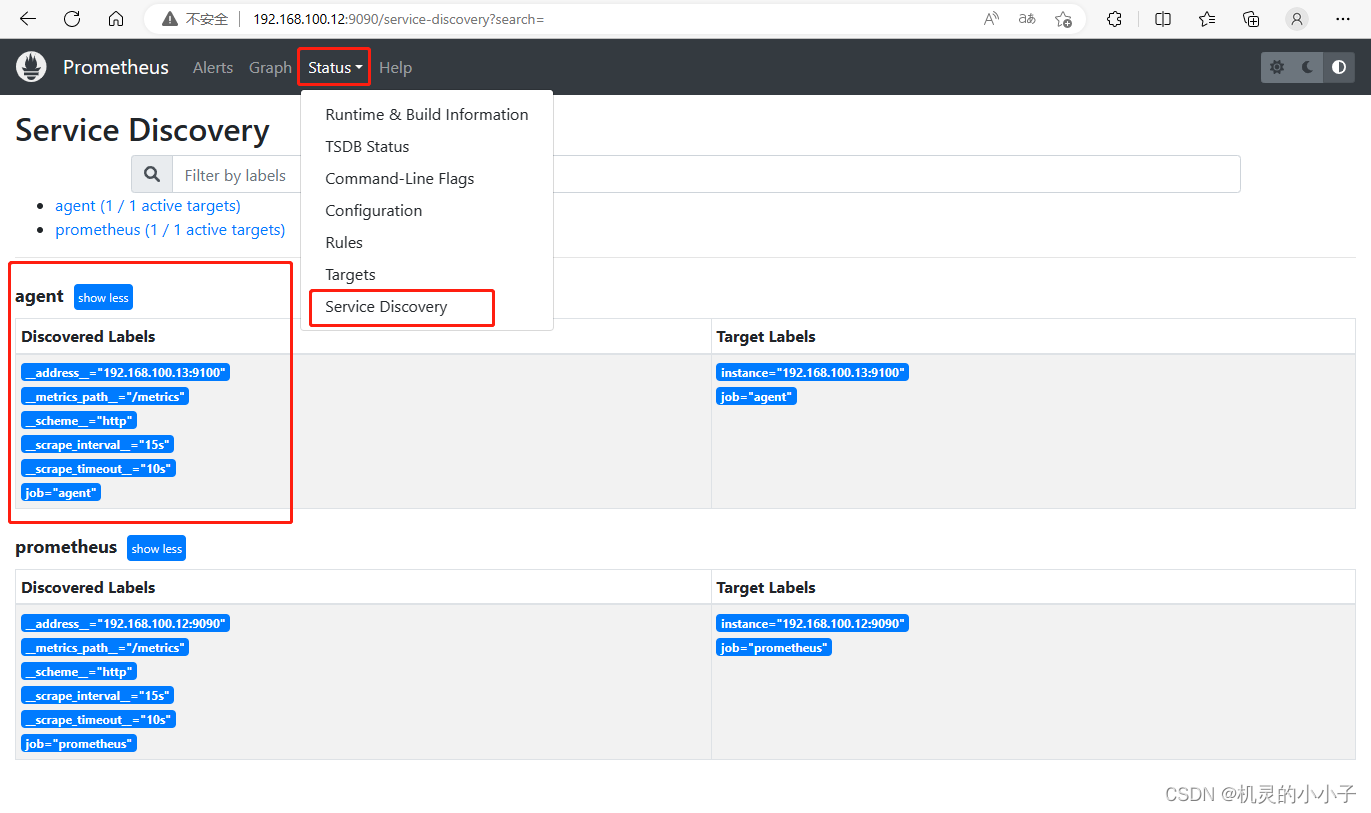
注:也可以在本机安装 node_exporter,使用上面的方式监控本机


 775
775


 被折叠的 条评论
为什么被折叠?
被折叠的 条评论
为什么被折叠?
 到【灌水乐园】发言


