


#-*-coding:utf-8-*-
from ctypes import *
WORD = c_ushort
DWORD = c_ulong
LPBYTE = POINTER(c_ubyte)
LPTSTR = POINTER(c_char)
HANDLE = c_void_p

#常量
DEBUG_PROCESS = 0x00000001#与父进程公用一个控制台(以子进程的方式运行)
CREATE_NEW_CONSOLE = 0x00000010#独占一个控制台(以单独的进程运行)

#结构体
class STARTUPINFO(Structure):
    _fields_ = [
        ("cb",DWORD),
        ("lpReserved",LPTSTR),
        ("lpTitle",LPTSTR),
        ("dwX",DWORD),
        ("dwY",DWORD),
        ("dwXSize",DWORD),
        ("dwYSize",DWORD),
        ("dwXCountChars",DWORD),
        ("dwYCountChars",DWORD),
        ("dwFillAttribute",DWORD),
        ("dwFlags",DWORD),
        ("wShowWindow",WORD),
        ("cbReserved2",WORD),
        ("lpReserved2",WORD),
        ("hStdInput",HANDLE),
        ("hStdOutput",HANDLE),
        ("hStdError",HANDLE),
    ]

class PROCESS_INFORMATION(Structure):
    _fields_ = [
        ("hProcess",HANDLE),
        ("hThread",HANDLE),
        ("dwProcessId",DWORD),
        ("dwThreadId",DWORD),
    ]
my_debugger1.py
#-*-coding:utf-8-*-
from ctypes import *
from my_debugger_defines1 import *
kernel32 = windll.kernel32

class debugger():
    def __init__(self):
        pass

    def load(self,path_to_exe):

        creation_flags = DEBUG_PROCESS

        #初始化结构体
        startupinfo = STARTUPINFO()
        process_information = PROCESS_INFORMATION()

        #the following two options allow the started process to be shown as a separate window
        #this also illustrates how different settings in the STARTUPINFO struct can affect the debuggee.
        startupinfo.dwFlags = 0x1
        startupinfo.wShowWindow = 0x0

        #初始化startupinfo.cb表示这个结构体的大小
        startupinfo.cb = sizeof(startupinfo)
        if kernel32.CreateProcessA(path_to_exe,
                                   None,
                                   None,
                                   None,
                                   None,
                                   creation_flags,
                                   None,
                                   None,
                                   byref(startupinfo),
                                   byref(process_information)):
            print "[*]We have successfully launched the process!"
            print "[*]PID:%d"%process_information.dwProcessId
        else:
            print "[*]Error:0x%08x."%kernel32.GetLastError()
#-*-coding:utf-8-*-
import my_debugger1
debugger = my_debugger1.debugger()
debugger.load("C:\\Windows\\SysWOW64\\calc.exe")
运行结果:
 #1获取进程的句柄
    def open_process(self,pid):
        h_process = kernel32.OpenProcess(PROCESS_ALL_ACCESS,False,pid)#权限,False,进程id
return h_process def attach(self,pid):
self.h_process = self.open_process(pid)
#2用DebugActiveProcess()函数附加到进程
if kernel32.DebugActiveProcess(pid):
self.debugger_active = True
self.pid = pid
#self.run()
else:
print "[*]Unable to attach to process."3、调试器循环调用WaitForDebugEvent()以便俘获调试事件。
BOOL WINAPI WaitForDebugEvent(
LPDEBUG_EVENT lpDebugEvent,#该结构体描述一个调试事件
DWORD dwMilliseconds,#设为无限等待
)
4、调试器捕捉的每一个事件都有相关的事件处理函数进行处理,
5、当处理函数完成了操作,我们希望进程继续执行用ContinueDebugEvent()
BOOL WINAPI ContinueDebugEvent(
DWORD dwProcessId,
DWORD dwThreadId,
DWORD dwContinueStatus #DBG_CONTINUE, DBG_EXCEPTION_NOT_HANDLED
);

6、从进程分离出来:把进程ID传递给DebugActiveProcessStop()
    def detach(self):
        #5进程分离,把进程id传递给DebugActiveProcessStop()
        if kernel32.DebugActiveProcessStop(self.pid):
            print "[*]Finished debugging.Exiting..."
            return True
        else:
            print "There was an error"
            return False
my_debugger_defines1.py
#-*-coding:utf-8-*-
from ctypes import *
WORD = c_ushort
DWORD = c_ulong
LPBYTE = POINTER(c_ubyte)
LPTSTR = POINTER(c_char)
HANDLE = c_void_p
##############
PVOID = c_void_p
ULONG_PTR =c_ulong

#常量
DEBUG_PROCESS = 0x00000001#与父进程公用一个控制台(以子进程的方式运行)
CREATE_NEW_CONSOLE = 0x00000010#独占一个控制台(以单独的进程运行)

################
PROCESS_ALL_ACCESS = 0x001F0FFF
INFINITE = 0xFFFFFFFF
DBG_CONTINUE = 0x00010002

#结构体
class STARTUPINFO(Structure):
    _fields_ = [
        ("cb",DWORD),
        ("lpReserved",LPTSTR),
        ("lpTitle",LPTSTR),
        ("dwX",DWORD),
        ("dwY",DWORD),
        ("dwXSize",DWORD),
        ("dwYSize",DWORD),
        ("dwXCountChars",DWORD),
        ("dwYCountChars",DWORD),
        ("dwFillAttribute",DWORD),
        ("dwFlags",DWORD),
        ("wShowWindow",WORD),
        ("cbReserved2",WORD),
        ("lpReserved2",WORD),
        ("hStdInput",HANDLE),
        ("hStdOutput",HANDLE),
        ("hStdError",HANDLE),
    ]

class PROCESS_INFORMATION(Structure):
    _fields_ = [
        ("hProcess",HANDLE),
        ("hThread",HANDLE),
        ("dwProcessId",DWORD),
        ("dwThreadId",DWORD),
    ]

##########################################
class EXCEPTION_RECORD(Structure):
    pass
EXCEPTION_RECORD._fields_ = [#这里之所以要这么设计,是因为ExceptionRecode调用了EXCEPTION_RECORD
        ("ExceptionCode",DWORD),
        ("ExceptionFlags",DWORD),
        ("ExceptionRecord",POINTER(EXCEPTION_RECORD)),
        ("ExceptionAddress",PVOID),
        ("NumberParameters",DWORD),
        ("ExceptionInfomation",ULONG_PTR * 15),
    ]

class EXCEPTION_DEBUG_INFO(Structure):
    _fields_ = [
        ("ExceptionRecord",EXCEPTION_RECORD),
        ('dwFistChance',DWORD),
    ]
class DEBUG_EVENT_UNION(Union):
    _fields_ = [
        ("Exception",EXCEPTION_DEBUG_INFO),
#        ("CreateThread",CREATE_THREAD_DEBUG_INFO),
#        ("CreateProcessInfo",CREATE_PROCESS_DEBUG_INFO),
 #       ("ExitThread",EXIT_THREAD_DEBUG_INFO),
#       ("ExitProcess",EXIT_PROCESS_DEBUG_INFO),
#        ("LoadDll",LOAD_DLL_DEBUG_INFO),
#        ("UnloadDll",UNLOAD_DLL_DEBUG_INFO),
#        ("DebugString",OUTPUT_DEBUG_INFO),
#        ("RipInfo",RIP_INFO),
    ]
class DEBUG_EVENT(Structure):#定义DEBUG_EVENT处理事件
    _fields_ = [
        ("dwDebugEventCode",DWORD),#调试事件类型
        ("dwProcessId",DWORD),
        ("dwThreadId",DWORD),
        ("u",DEBUG_EVENT_UNION),
    ]
my_debugger1.py
#-*-coding:utf-8-*-
from ctypes import *
from my_debugger_defines1 import *
kernel32 = windll.kernel32

class debugger():

    def __init__(self):
        self.h_process = None
        self.pid = None
        self.debugger_active = False

    def load(self,path_to_exe):

        creation_flags = DEBUG_PROCESS

        #初始化结构体
        startupinfo = STARTUPINFO()
        process_information = PROCESS_INFORMATION()

        #the following two options allow the started process to be shown as a separate window
        #this also illustrates how different settings in the STARTUPINFO struct can affect the debuggee.
        startupinfo.dwFlags = 0x1
        startupinfo.wShowWindow = 0x0

        #初始化startupinfo.cb表示这个结构体的大小
        startupinfo.cb = sizeof(startupinfo)
        if kernel32.CreateProcessA(path_to_exe,
                                   None,
                                   None,
                                   None,
                                   None,
                                   creation_flags,
                                   None,
                                   None,
                                   byref(startupinfo),
                                   byref(process_information)):
            print "[*]We have successfully launched the process!"
            print "[*]PID:%d"%process_information.dwProcessId
        else:
            print "[*]Error:0x%08x."%kernel32.GetLastError()

        #获得一个有效的句柄对于这个进程
        self.h_process = self.open_process(process_information.dwProcessId)

    #1获取进程的句柄
    def open_process(self,pid):
        h_process = kernel32.OpenProcess(PROCESS_ALL_ACCESS,False,pid)#权限,False,进程id
        return h_process

    def attach(self,pid):
        self.h_process = self.open_process(pid)
        #2用DebugActiveProcess()函数附加到进程
        if kernel32.DebugActiveProcess(pid):
            self.debugger_active = True
            self.pid = pid
            self.run()
        else:
            print "[*]Unable to attach to process."

    def run(self):
        #测试这个调试器
        while self.debugger_active == True:
            self.get_debug_event()

    def get_debug_event(self):
        debug_event = DEBUG_EVENT()
        continue_status = DBG_CONTINUE#告诉进程继续执行
        #3循环调用WaitForDebugEvent()以便俘获调试事件
        if kernel32.WaitForDebugEvent(byref(debug_event),INFINITE):#DEBUG_EVENT结构描述了一个调试事件,无线等待
            raw_input(    "Press a key to continue...")
            self.debugger_active = False

        #4处理函数完成操作后,我们希望进程继续执行调用Continue Debug Event
        kernel32.ContinueDebugEvent(debug_event.dwProcessId,debug_event.dwThreadId,continue_status)#continue_status告诉进程继续进行还是产生异常

    def detach(self):
        #5进程分离,把进程id传递给DebugActiveProcessStop()
        if kernel32.DebugActiveProcessStop(self.pid):
            print "[*]Finished debugging.Exiting..."
            return True
        else:
            print "There was an error"
            return False
my_test1.py
#-*-coding:utf-8-*-
import my_debugger1
debugger = my_debugger1.debugger()
pid = raw_input("Enter the PID of the process to attach to:")
debugger.attach(int(pid))
debugger.detach()
发现此时无法操作计算器,这是因为该进程被调试器挂起了,等待进一步的指示。
三、获取寄存器的状态
1、首先获取被调试目标内部的线程句柄,由OpenThread()实现。
HANDLE WINAPI OpenThread{
DWORD dwDesiredAccess,#THREAD_ALL_ACCESS
BOOL bInheritHandle, #False
DWORD dwThreadId
);
#获取寄存器状态
    def open_thread(self,thread_id):
        h_thread = kernel32.OpenThread(THREAD_ALL_ACCESS,False,thread_id)
        if h_thread is not None:
            return h_thread
        else:
            print "[*]Could not obtain a valid thread handle."
            return False
2、为了得到寄存器的状态我们必须枚举出进程内部所有的线程。用CreateToolhelp32Snapshot()
HANDLE WINAPI CreateToolhelp32Snapshot(
DWORD dwFlags,#标志我们需要手机的数据类型(线程,进程,模块,堆)这里为TH32CS_SNAPTHREAD表示我们要搜集快照snapshot注册了的线程。
DWORD th32ProcessID
);
3、获得线程的列表后我们就用Thread32First()枚举出来
BOOL WINAPI Thread32First(
HANDLE hSnapshot, #就是上个函数获得的镜像句柄
LPTHREADENTRY32 lpte#指向一个THREADENTRY32结构
);
typedef struct THREADENTRY32{
DWORD dwSize, #该结构的大小,必须初始化
DWORD cntUsage,
DWORD th32ThreadID,#
DWORD th32OwnerProcessID,#
LONG tpBasePri,
LONG tpDeltaPri,
DWORD dwFlags
);
 #枚举线程
    def enumerate_threads(self):
        thread_entry = THREADENTRY32()
        thread_list = []#用来保存线程列表
        snapshot = kernel32.CreateToolhelp32Snapshot(TH32CS_SNAPTHREAD,self.pid)#通过CreateToolhelp32Snapshot获得的句柄
        if snapshot is not None:
            #你不得不设置结构体的大小否则调用会出错
            thread_entry.dwSize = sizeof(thread_entry)
            success = kernel32.Thread32First(snapshot,byref(thread_entry))#通过Thread32First列举出线程
            print success
            while success:
                if thread_entry.th32OwnerProcessID == self.pid:
                    thread_list.append(thread_entry.th32ThreadID)
                success = kernel32.Thread32Next(snapshot,byref(thread_entry))

            kernel32.CloseHandle(snapshot)
            return thread_list
        else:
            print "enumerate_threads fail."
            return False
4、现在已经获得句柄,获取寄存器的值。
BOOL WINAPI GetThreadContext(
HANDLE hThread,
LPCONTEXT lpContext#指向一个CONTEXT结构
);
BOOL WINAPI SetThreadContext(
HANDLE hThread,
LPCONTEXT lPcONTEXT
);
typedef struct CONTEXT{
DWORD ContextFlags,
,,,
FLOATING_SAVE_AREA FloatSave,
,,,
BYTE ExtendedRegisters[MAXMUM_SUPPORTED_EXTENSION]
};
#获得寄存器内容
    def get_thread_context(self,thread_id):
        context = CONTEXT()
        context.ContextFlags = CONTEXT_FULL |CONTEXT_DEBUG_REGISTERS
        #获得线程的句柄
        h_thread = self.open_thread(thread_id)
        if kernel32.GetThreadContext(h_thread,byref(context)):
            kernel32.CloseHandle(h_thread)
            return context
        else:

            return False
my_test1.py
#-*-coding:utf-8-*-
import my_debugger1
debugger = my_debugger1.debugger()
pid = raw_input("Enter the PID of the process to attach to:")
debugger.attach(int(pid))

list = debugger.enumerate_threads()

for thread in list:
    thread_context = debugger.get_thread_context(thread)
    print "[*] Dumping registers for thread ID:0x%08x"%thread
    print "[*] EIP:0x%08x"%thread_context.Eip
    print "[*] ESP:0x%08x"%thread_context.Esp
    print "[*] EBP:0x%08x"%thread_context.Ebp
    print "[*] EAX:0x%08x"%thread_context.Eax
    print "[*] EBX:0x%08x"%thread_context.Ebx
    print "[*] ECX:0x%08x"%thread_context.Ecx
    print "[*] EDX:0x%08x"%thread_context.Edx
    print "[*] END DUMP"

debugger.detach()发现报错:依然出现Press a key to continue...
参考CSDN中大神的解决方法:注释掉
if kernel32.WaitForDebugEvent(byref(debug_event),INFINITE):#DEBUG_EVENT结构描述了一个调试事件,无线等待
            #raw_input(    "Press a key to continue...")
            #self.debugger_active = False
if kernel32.DebugActiveProcess(pid):
self.debugger_active = True
self.pid = pid
#self.run()运行结果:
成功了!哦也!
四、实现调试事件的处理
为了让我们的调试器能针对特定的事件采取相应的行动,我们必须给调试器捕捉到的调试事件编写处理函数即1.4中。由WaitForDebugEvent()函数每当捕捉到调试事件时就返回DEBUG_EVENT结构。
typedef struct DEBUG_EVENT{
DWORD dwDebugEventCode, #表明了捕捉事件的类型,同时也决定了u里存储的是什么类型的值。
DWORD dwProcessId,
DWORD dwThreadId,
union{
EXCEPTION_DEBUG_INFO Exception
,,,
}u;
};
在这个结构中dwDebugEventCode是最重要的,它表明了什么事情被WaitForDebugEvent捕捉到了,同事也决定联合体u重存储的是什么类型的值。u中的变量与dwDebugEventCode的值一一对应如下:
def get_debug_event(self): debug_event = DEBUG_EVENT() continue_status = DBG_CONTINUE#告诉进程继续执行 #3循环调用WaitForDebugEvent()以便俘获调试事件 if kernel32.WaitForDebugEvent(byref(debug_event),INFINITE):#DEBUG_EVENT结构描述了一个调试事件,无线等待 #raw_input( "Press a key to continue...") #self.debugger_active = False #获取线程和内容信息 self.h_thread = self.open_thread(debug_event.dwThreadId) self.context = self.get_thread_context(self.h_thread) print "Event Code:%d ThreadID:%d"%(debug_event.dwDebugEventCode,debug_event.dwThreadId) #4处理函数完成操作后,我们希望进程继续执行调用Continue Debug Event kernel32.ContinueDebugEvent(debug_event.dwProcessId,debug_event.dwThreadId,continue_status)增加两行代码发现:结果含义如下:0x3事件先发生表示创建一个进程,0x6事件发生表示加载,0x2事件发生表示创建一个线程,0x1事件发生表示例外事件发生,最后0x4发生表示线程结束自己。
my_debugger_defines1.py#调试事件常量 EXCEPTION_DEBUG_EVENT = 0x1 CREATE_THREAD_DEBUG_EVENT =0x2 CREATE_PROCESS_DEBUG_EVENT = 0x3 EXIT_THREAD_DEBUG_EVENT = 0x4 EXIT_PROCESS_DEBUG_EVENT = 0x5 LOAD_DLL_DEBUG_EVENT = 0x6 UNLOAD_DLL_DEBUG_EVENT = 0x7 OUPUT_DEBUG_STRING_EVENT =0x8 RIP_EVENT = 0x9 #调试异常的代码 EXCEPTION_ACCESS_VIOLATION =0x00000005 EXCEPTION_BREAKPOINT = 0x80000003 EXCEPTION_GUARD_PAGE = 0x80000001 EXCEPTION_SINGLE_STEP = 0x80000004
my_debugger1.pydef get_debug_event(self): debug_event = DEBUG_EVENT() continue_status = DBG_CONTINUE#告诉进程继续执行 #3循环调用WaitForDebugEvent()以便俘获调试事件 if kernel32.WaitForDebugEvent(byref(debug_event),INFINITE):#DEBUG_EVENT结构描述了一个调试事件,无线等待 #raw_input( "Press a key to continue...") #self.debugger_active = False #获取线程和内容信息 self.h_thread = self.open_thread(debug_event.dwThreadId) self.context = self.get_thread_context(self.h_thread) print "Event Code:%d ThreadID:%d"%(debug_event.dwDebugEventCode,debug_event.dwThreadId) #如果事件是一个异常,我们将更深入地调查 if debug_event.dwDebugEventCode == EXCEPTION_DEBUG_EVENT: self.exception = debug_event.u.Exception.ExceptionRecord.ExceptionCode self.exception_address = debug_event.u.Exception.ExceptionRecord.ExceptionAddress if self.exception == EXCEPTION_ACCESS_VIOLATION: print "Access Violation Detected." elif self.exception == EXCEPTION_BREAKPOINT:#如果异常时断点 continue_status = self.exception_handler_breakpoint() elif self.exception == EXCEPTION_GUARD_PAGE:#如果异常是保护页 print "Guard Page Access Detected." elif self.exception == EXCEPTION_SINGLE_STEP: #如果异常是单步断点 print "Single Stepping." #4处理函数完成操作后,我们希望进程继续执行调用Continue Debug Event kernel32.ContinueDebugEvent(debug_event.dwProcessId,debug_event.dwThreadId,continue_status) def exception_handler_breakpoint(self): print "[*]Inside the breakpoint handler." print "Exception Address:0x%08x"% self.exception_address return DBG_CONTINUE
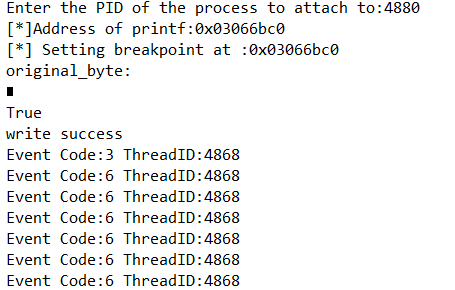
重新运行脚本,结果如下:
五、全能断点
1、软件断点原理:为了在一个地方设置断点,我们将地址的前两个字节替换成一个单字节0xCC,并将地址保存起来。当CPU执行到此处时,CPU暂停并触发一个INT3中断事件。
调试器判断这个地址是不是之前自己设置的断点地址,如果调试器找到了这个地址就将设置断点前保存的操作码写回到该地址,这样进程就能继续执行。
1)为了设置软件断点,我们必须能够将数据写入目标进程的内存。这需要通过ReadProcessMemory()和WriteProcessMemory()实现。
BOOL WINAPI ReadProcessMemory(
HANDLE hProcess,
LPCVOID lpBaseAddress,#读或写的目标地址
LPVOID lpBuffer,#指向一片缓冲区
SIZE_T nSize,#数据的大小
SIZE_T * lpNumberOfBytesRead#由函数填写,通过它我们知道一次操作后实际读写了的数据。
);
这两个函数都允许调试器观察和更新被调试的进程的内存。
2)支持软件断点后,我们需要找个地址设置一个试试,用printf()作为将要捕获的目标函数。windows调试API通过GetProcAddress()确定一个函数的虚拟地址。
FARPROC WINAPI GetProcAddress(
HMODULE hModule,#模块的句柄
LPCSTR lpProcName
);
HMODULE WINAPI GetModuleHandle(
LPCSTR lpMoudleName
);
通过获得一个模块的句柄,然后查找从中导出感兴趣的函数的地址
from ctypes import * import time msvcrt = cdll.msvcrt counter = 0 while 1: msvcrt.printf("Loop iteration%d!\n"%counter) time.sleep(2) counter += 1运行结果如下:#软件断点 def read_process_memory(self,address,length): data = "" read_buf = create_string_buffer(length) count = c_ulong(0) if not kernel32.ReadProcessMemory(self.h_process, address, read_buf, length, byref(count)): return False else: data += read_buf.raw return data def write_process_memory(self,address,data): count = c_ulong(0) length = len(data) c_data = c_char_p(data[count.value:]) if not kernel32.WriteProcessMemory(self.h_process, address, c_data, length, byref(count)): return False else: return True def bp_set(self,address): print('[*] Setting breakpoint at :0x%08x' % address) if not self.breakpoints.has_key(address): try: original_byte = self.read_process_memory(address,1) print "original_byte:" print original_byte res = self.write_process_memory(address,'\xCC') print res if res : print "write success" else: print "write fail" self.breakpoints[address] = (address,original_byte) except: return False return True def func_reslove(self,dll,function): handle = kernel32.GetModuleHandleA(dll) address = kernel32.GetProcAddress(handle,function) kernel32.CloseHandle(handle) return address

测试发现读写内存错误,说明代码有误。1)经过反复检查发现在read_process_memory()函数中应该注释掉not。2)在func_solve函数中address的地址一直都是0x00000000,后经过大神的帮忙发现该地址该函数应该返回id(function)因为这样得到的地址才是函数printf的地址。原因未知。。。。。def func_reslove(self,dll,function): handle = kernel32.GetModuleHandleA(dll) #print(id(function)) address = kernel32.GetProcAddress(handle,function) #print(address) kernel32.CloseHandle(handle) return id(function)#address
2、硬件断点原理:硬件断点适合小块区域设置断点又不能修改他们时,这种类型的断点设在CPU级别,并用特定的寄存器--调试寄存器。一般有8个调试寄存器,0~3为存储硬件断点地址的寄存器,45保留,6是状态,7本质上是硬件断点的开关寄存器。和软件中断不同,硬件中断是Int1中断,负责硬件中断和步进事件。步进( Single-step )意味着一步一步的执行指令,从而精确的观察关键代码以便监视数据的变化。如果任何储存在 DR0-DR3 中的地址所指向的区域被访问了,就会触发 INT1 中断,同时暂停 CPU。如果没有,CPU 执行代码,到下一行代码时,CPU 继续重复上面的检查。工作流程:1)通过设置相应的CPU调试寄存器来实现。当我们使用硬件断点时要跟踪4个可用的调试寄存器哪个是用过的和没用的,必须确保我们使用的哪个寄存器是空的,否则硬件断点不能再我们希望的地方出发。2)通过修改全局的硬件断点字典,我们选择一个空的调试寄存器存储硬件断点。一旦我们得到空位就把硬件断点地址填入调试寄存器,然后对DR7的标志位进行更新。
3)然后修改处理调试事件的主函数使它能够处理由硬件断点引发的异常。
#硬件断点条件 HW_ACCESS =0x00000003 HW_EXECUTE =0x00000000 HW_WRITE =0x00000001代码主要是三个函数:
#硬件断点 def bp_set_hw(self,address,length,condition): #检查有效长度值 if length not in (1,2,4): return False else: length -= 1 #检查有效条件 if condition not in(HW_ACCESS,HW_EXECUTE,HW_WRITE): return False #检查有效点 if not self.hardware_breakpoints.has_key(0): available = 0 elif not self.hardware_breakpoints.has_key(1): available = 1 elif not self.hardware_breakpoints.has_key(2): available = 2 elif not self.hardware_breakpoints.has_key(3): available = 3 else: return False #我们想要在每个线程偶设置调试寄存器 for thread_id in self.enumerate_threads(): context = self.get_thread_context(thread_id=thread_id) #在DR7设置合适的标志位来设置断点的地址 context.Dr7 |= 1 << (available*2) #在空的寄存器中保存断点的地址 if available == 0: context.Dr0 = address elif available == 1: context.Dr1 = address elif available == 2: context.Dr2 = address elif available == 3: condition.Dr3 = address # 设置断点出发的条件 context.Dr7 |= condition << ((available*4)+16) #设置长度 condition.Dr7 |= length << ((available*4)+18) #设置线程的内容在每个断点的地方 h_thread = self.open_thread( thread_id) kernel32.SetThreadContext(h_thread,byref(context)) #更新内部的硬件断点字典 self.hardware_breakpoints[available] = (address,length,condition) return True
def exception_handler_single_step(self): #确定单步异常发生在硬件断点,我们应该检查Dr6的BS标志位 if self.context.Dr6 & 0x1 and self.hardware_breakpoints.has_key(0): slot = 0 elif self.context.Dr6 & 0x1 and self.hardware_breakpoints.has_key(1): slot = 1 elif self.context.Dr6 & 0x1 and self.hardware_breakpoints.has_key(2): slot = 2 elif self.context.Dr6 & 0x1 and self.hardware_breakpoints.has_key(3): slot = 3 else: #这里没有一个INT1异常发生在硬件断点 continue_status = DBG_EXCEPTION_NOT_HANDLED #现在让我们从列表中移除硬件断电 if self.bp_del_hw(slot): conti nue_status = DBG_CONTINUE print "[*]Hardware breakpoint removed." return continue_statusdef bp_del_hw(self,slot): #禁止所有活动线程断点 for thread_id in self.enumerate_threads(): context = self.get_thread_context(thread_id=thread_id) #重置标志位来一处断电 context.Dr7 &= ~(1<<(slot*2)) #归零的地址 if slot == 0: context.Dr0 = 0x00000000 elif slot == 1: context.Dr1 = 0x00000000 elif slot == 2: context.Dr2 = 0x00000000 elif slot == 3: context.Dr3 = 0x00000000 #移除条件标志位 context.Dr7 &= ~(3<<((slot*4)+16)) #移除长度标志 context.Dr7 &= ~(3 << ((slot * 4) + 18)) #随着断电的移除充值线程的内容 h_thread = self.open_thread(thread_id) kernel32.SetThreadContext(h_threa d,byref(context)) #从列表中移除断点 del self.hardware_breakpoints[slot] return True结果和软件结果一样。。。。。。。。。。。。printf的地址还是0???为什么????
3、内存断点原理:内存断点其实不是本质的断点,当设置了内存断点时其实是改变了内存页的访问权限。这里我们感兴趣的是保护页(Guard Page) 。这种类型的页面常被用于:分离堆和栈或者确保一部分内存数据不会增长出边界。另一种情况,就是当一个特定的内存块被进程命中(访问)了,就暂停进程。
流程:首先查询一个内存块以并找到基地址(页面在虚拟内存中的起始地址)一旦确定了页面大小就设置页面权限,使其成为保护页。当CPU尝试访问这块内存时就会抛出一个GUARD_PAGE_EXCEPTION异常。我们用对应的处理函数将页面权限恢复到以前,最后让程序继续执行。
1)为了计算页面的大小用GetSystemInfo()函数完成,函数保护一个SYSTEM_INFO结构,这个结构包含wPageSize成员即页面大小。
#内存断点 #存储默认页的大小 system_info = SYSTEM_INFO() kernel32.GetSystemInfo(byref(system_info)) self.page_size = system_info.dwPageSize self.guarded_pages = [] self.memory_breakpoints = {}
2)获得默认页大小后,查询和控制页面的权限。先调研VirtualQueryEx()函数查询出内存断点在内存里的哪一个页面,该函数包含MEMORY_BASIC_INFORMATION结构,该结构包含页的信息。
SIZE_T WINAPI Virtual QueryEx(
HANDLE hProcess,
LPCVOID lpAddress,
PMEMORY_BASIC_INFORMATION lpBuffer,
SIZE_T dwLength
);
3)接下来用VirtualProtextEx()设置权限。
#内存断点 def bp_set_mem(self,address,size): mbi = MEMORY_BASIC_INFORMATION() if kernel32.VirtualQueryEx(self.h_process,address,byref(mbi),sizeof(mbi)<sizeof(mbi)): return False current_page = mbi.BaseAddress #我们将这只页面的许可权 while current_page <= address + size: #将页面添加到列表,这将区分操作系统设置的保护页和调试进程设置的保护页 self.guarded_pages.append(current_page) old_protection = c_ulong(0) #添加保护也的属性 if not kernel32.VirtualQueryEx(self.h_process,current_page,size,mbi.Protect|PAGE_GUARD,byref(old_protection)): return False #增加默认系统内存页面的大小 current_page += self.page_size #添加内存断点到我们的全局列表中 self.memory_breakpoints[address] = (address,size,mbi) return True


 4052
4052


 被折叠的 条评论
为什么被折叠?
被折叠的 条评论
为什么被折叠?
 到【灌水乐园】发言


