


Index
Background:
In the project that I am engaged in, we are having some grafana graphs to display server’s CPU, memory, GC info, top requested urls. However we will share the Grafana charts to another team to display on their UI pages via iframe URLs. we configured auth proxy to Grafana server for security reason, which means that the third cannot call iframe url to display charts without authendication. They have to do authentication in their BE. like to implement a proxy that calling the grafana chart URLs.
How to achieve it
Configure Grafana auth proxy
follow below link
Grafana auth proxy
Nginx reverse proxy
Nginx multiple site reverse proxy, for all Grafana iframe requests will go through Nginx.
edit file /etc/nginx/sites-available/grafana-dev.com .conf
sudo vi /etc/nginx/sites-available/grafana-dev.com .conf
  server {
    listen 81;
    server_name grafana-dev.com;

    set $upstream community.grafana.com;

    location ~ /\.ht { deny  all; }

    location / {
        auth_basic "grafana";
        auth_basic_user_file /etc/nginx/.htpasswd;
        proxy_pass http://your_grafana_server:3000/;
        proxy_set_header X-WEBAUTH-USER $remote_user;
        proxy_set_header Authorization "";
    }

    location /grafana/ {
        auth_basic "grafana";
        auth_basic_user_file /etc/nginx/.htpasswd;
        proxy_pass http://your_grafana_server:3000/;
        proxy_set_header X-WEBAUTH-USER $remote_user;
        proxy_set_header Authorization "";
    }

  }
Create a symbolic link for the nginx conf file
sudo ln -s /etc/nginx/sites-available/grafana-dev.com.conf /etc/nginx/sites-enabled/
Reload and restart Nginx
sudo nginx -s reload
sudo systemctl restart nginx
imitate to implement auto login at BE
I have already searched via google , baidu…for some time. Unfortunately I didn’t find a useful solution to address the issue. so I just have to implement the proxy by ourselves.In BE of the third app, they will check whether the user login successfully or not, if it is the authencated user, just send the Grafana inframe requests, however it needs to do auto authentication for requests, like with a token.
the whole process will be like below:
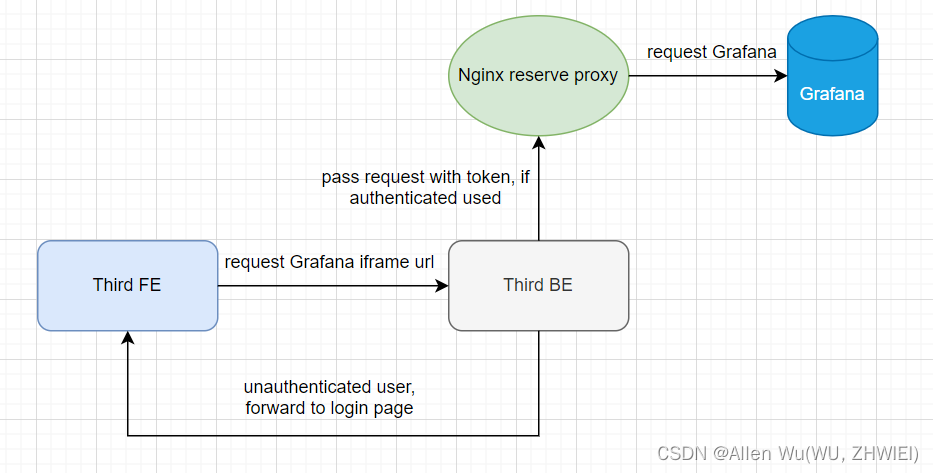
auto login authentication will be conducted in the third BE. they do a login logic in the BE rather than at UI page. just set basic token in the header of the requests. there is a node code to imitate BE logic.
We can test on windows first.
enbed_grafana_chart_demo.html
<html lang="en">
<head>
    <meta charset="UTF-8">
    <meta name="viewport" content="width=device-width, initial-scale=1.0">
    <title>Grafana Chart Embed Demo</title>
    <script src="https://code.jquery.com/jquery-3.6.0.min.js"></script>
</head>
<body>

    <h1>Embedded Grafana Chart</h1>

    <div id="grafana-chart-container"></div>

    <script>
        $(document).ready(function() {
            const grafanaUrl = your_grafana_iframe_url;
            $.ajax({
				method: 'GET',
                url: 'http://localhost/login',
                success: function(response) {
                    var iframe = $('<iframe>', {
                        src: grafanaUrl,
                        width: '900',
                        height: '400',
                        frameborder: '0'
                    });
                    $('#grafana-chart-container').append(iframe);
                },
                error: function(xhr, status, error) {
                    //console.error('Error:', error);
                }
            });
        });
    </script>

</body>
</html>
proxy.js
const http = require('http');

const proxy = http.createServer((req, res) => {
    let options;

	if (req.url.includes('/login') || req.url.includes('/api/frontend-metrics')) {
		console.log('login Request URL:', req.url);
        requestBody = JSON.stringify({
            user: 'username',
            password: 'password'
        });

		// Define the options for the proxy request
		options = {
			hostname: 'grafana-dev.com',
			port: 81,
			path: req.url, // Keep the same path as the request
			method: 'POST',
			headers: {
				'Authorization': 'basic_token',
				'Content-Type': 'application/json',
				'Content-Length': Buffer.byteLength(requestBody) // Calculate the length of the request body
			}
		};
	} else if (req.url.includes('/d-solo')){
		console.log('d-solo Request URL:', req.url);
		// Define the options for the proxy request
		options = {
			hostname: 'grafana-dev.com',
			port: 81,
			path: req.url, // Keep the same path as the request
			method: 'GET',
			headers: {
				'Authorization': 'basic_token',
				'Accept': 'text/html'
			}
		}

    } else {
		console.log('other Requests URL:', req.url);
		// Define the options for the proxy request
		options = {
			hostname: 'grafana-dev.com',
			port: 81,
			path: req.url, // Keep the same path as the request
			method: 'GET',
			headers: {
				'Authorization': 'basic_token'
				//'Content-Type': 'text/javascript'
			}
		}
    }


	res.setHeader('Access-Control-Allow-Origin', '*');

    // Send the proxy request
    const proxyReq = http.request(options, (proxyRes) => {
        // Forward the response from the target server to the client
        res.writeHead(proxyRes.statusCode, {
            ...proxyRes.headers // Forward other headers from the proxy response
        });
        proxyRes.pipe(res, { end: true });
    });

    // Handle errors from the proxy request
    proxyReq.on('error', (error) => {
        console.error('Proxy request error:', error);
        res.statusCode = 500;
        res.end('Proxy request failed');
    });

    // Write the request body to the proxy request
    proxyReq.write(requestBody);

    // End the proxy request
    proxyReq.end();
});

// Start the proxy server
proxy.listen(80, () => {
    console.log('Proxy server is running on port 80');
});
start nodejs
node proxy.js
open html file
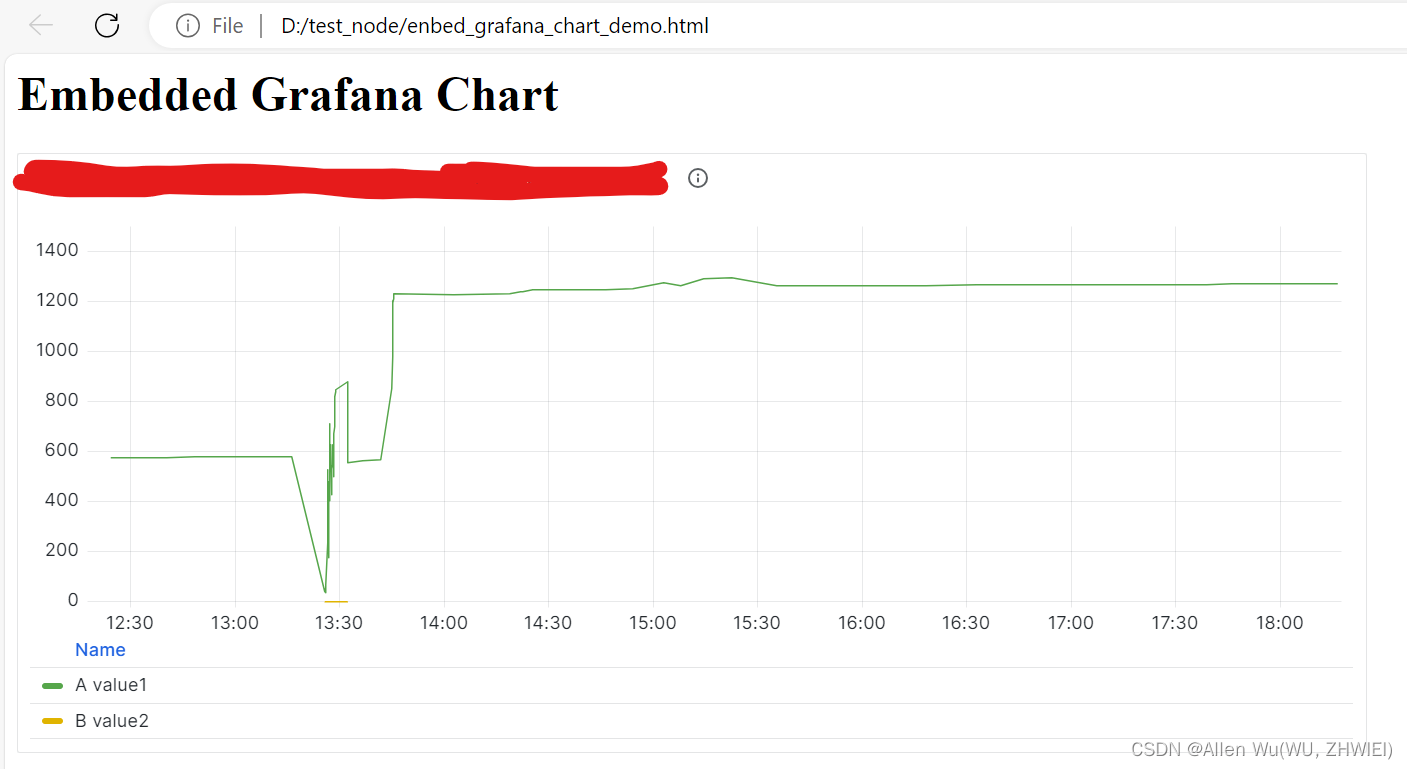
you can see the Grafana chart was loaded successfully, which means that auto login is successfully.


 被折叠的 条评论
为什么被折叠?
被折叠的 条评论
为什么被折叠?
 到【灌水乐园】发言


