


 本文介绍了如何在R中使用networkD3包创建动态网络图,包括forceNetwork()和simpleNetwork()两个函数的用法。forceNetwork()允许自定义节点大小、链接宽度、距离等参数,可以实现复杂效果;simpleNetwork()则提供简洁的绘图方式。示例中展示了基于MisLinks和MisNodes数据集创建网络图的过程,并提供了全节点显示标签的实现方法。
介绍
人物关系网经常在文本分析中应用,其实质就是一个有边和节点的图,在R中实现图的展示有igraph和networkD3两个包,这里讲解networkD3的使用。
forceNetwork()的介绍
该函数创建一个D3的JavaScript网络图对象。
forceNetwork(Links, Nodes, Source, Target, Value, NodeID, Nodesize, Group,
  height = NULL, width = NULL,
  colourScale = JS("d3.scaleOrdinal(d3.schemeCategory20);"), fontSize = 7,
  fontFamily = "serif", linkDistance = 50,
  linkWidth = JS("function(d) { return Math.sqrt(d.value); }"),
  radiusCalculation = JS(" Math.sqrt(d.nodesize)+6"), charge = -30,
  linkColour = "#666", opacity = 0.6, zoom = FALSE, legend = FALSE,
  arrows = FALSE, bounded = FALSE, opacityNoHover = 0,
  clickAction = NULL)
参数介绍
-
Links
a data frame object with the links between the nodes. It should include the Source and Target for each link. These should be numbered starting from 0. An optional Value variable can be included to specify how close the nodes are to one another. -
Nodes
a data frame containing the node id and properties of the nodes. If no ID is specified then the nodes must be in the same order as the Source variable column in the Links data frame. Currently only a grouping variable is allowed. -
Source
character string naming the network source variable in the Links data frame. -
Target
character string naming the network target variable in the Links data frame. -
Value
character string naming the variable in the Links data frame for how wide the links are. -
NodeID
character string specifying the node IDs in the Nodes data frame. -
Nodesize
character string specifying the a column in the Nodes data frame with some value to vary the node radius’s with. See also radiusCalculation. -
Group
character string specifying the group of each node in the Nodes data frame. -
height
numeric height for the network graph’s frame area in pixels. -
width
numeric width for the network graph’s frame area in pixels. -
colourScale
character string specifying the categorical colour scale for the nodes. See https://github.com/d3/d3/blob/master/API.md#ordinal-scales. -
fontSize
numeric font size in pixels for the node text labels. -
fontFamily
font family for the node text labels. -
linkDistance
numeric or character string. Either numberic fixed distance between the links in pixels (actually arbitrary relative to the diagram’s size). Or a JavaScript function, possibly to weight by Value. For example: linkDistance = JS(“function(d){return d.value * 10}”). 这里是value越大,距离越远,往往我们要让关系强的距离近,就需要进行调整。 -
linkWidth
numeric or character string. Can be a numeric fixed width in pixels (arbitrary relative to the diagram’s size). Or a JavaScript function, possibly to weight by Value. The default is linkWidth = JS(“function(d) { return Math.sqrt(d.value); }”). -
radiusCalculation
character string. A javascript mathematical expression, to weight the radius by Nodesize. The default value is radiusCalculation = JS(“Math.sqrt(d.nodesize)+6”). -
charge
numeric value indicating either the strength of the node repulsion (negative value) or attraction (positive value). -
linkColour
character vector specifying the colour(s) you want the link lines to be. Multiple formats supported (e.g. hexadecimal). -
opacity
numeric value of the proportion opaque you would like the graph elements to be. -
zoom
logical value to enable (TRUE) or disable (FALSE) zooming. -
legend
logical value to enable node colour legends. -
arrows
logical value to enable directional link arrows. -
bounded
logical value to enable (TRUE) or disable (FALSE) the bounding box limiting the graph’s extent. See http://bl.ocks.org/mbostock/1129492. -
opacityNoHover
numeric value of the opacity proportion for node labels text when the mouse is not hovering over them. -
clickAction
character string with a JavaScript expression to evaluate when a node is clicked.
实例
library(networkD3)
# Load data
data(MisLinks)
data(MisNodes)
# Create graph
head(MisLinks)
# source target value
# 1 1 0 1
# 2 2 0 8
# 3 3 0 10
# 4 3 2 6
# 5 4 0 1
# 6 5 0 1
head(MisNodes)
# name group size
# 1 Myriel 1 15
# 2 Napoleon 1 20
# 3 Mlle.Baptistine 1 23
# 4 Mme.Magloire 1 30
# 5 CountessdeLo 1 11
# 6 Geborand 1 9
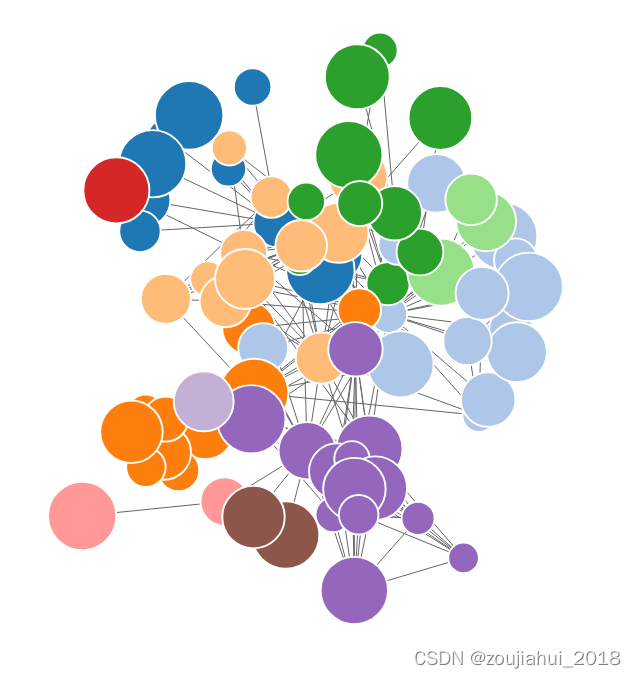
forceNetwork(Links = MisLinks, Nodes = MisNodes, Source = "source",
Target = "target", Value = "value", NodeID = "name",Nodesize='size',
Group = "group", opacity =1, zoom = T,
radiusCalculation = "Math.sqrt(d.nodesize,2)*5",
linkWidth = JS("function(d) { return Math.sqrt(d.value)-4;}"),
linkDistance=JS("function(d){return 1/(d.value)*100 }"))
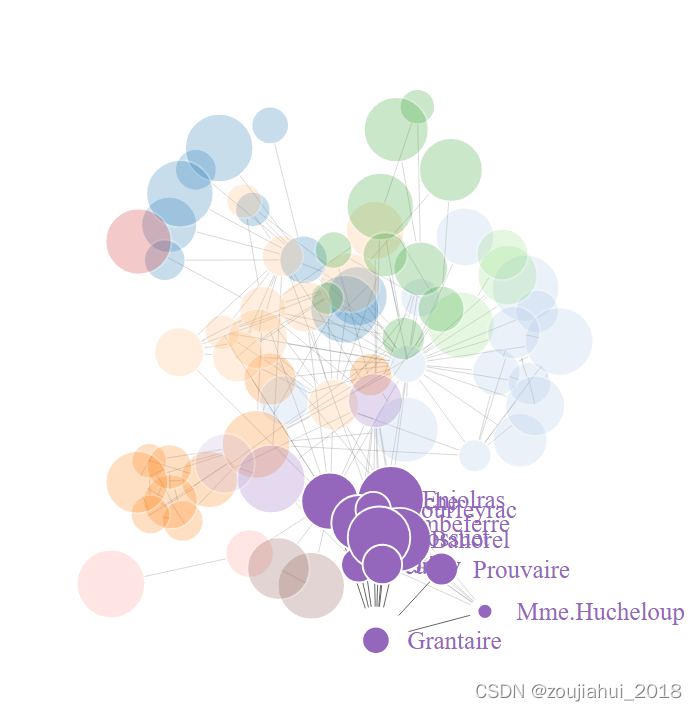
令全部结点显示标签
通过改写clickAction可以实现同时显示全部标签的效果
customJS <- '
function(el,x) {
    var link = d3.selectAll(".link")
    var node = d3.selectAll(".node")

    var options = { opacity: 1,
                    clickTextSize: 10,
                    opacityNoHover: 0.1,
                    radiusCalculation: "Math.sqrt(d.nodesize)+6"
                  }

    var unfocusDivisor = 4;

    var links = HTMLWidgets.dataframeToD3(x.links);
    var linkedByIndex = {};

    links.forEach(function(d) {
      linkedByIndex[d.source + "," + d.target] = 1;
      linkedByIndex[d.target + "," + d.source] = 1;
    });

    function neighboring(a, b) {
      return linkedByIndex[a.index + "," + b.index];
    }

    function nodeSize(d) {
            if(options.nodesize){
                    return eval(options.radiusCalculation);
            }else{
                    return 6}
    }

    function mouseover(d) {
      var unfocusDivisor = 4;

      link.transition().duration(200)
        .style("opacity", function(l) { return d != l.source && d != l.target ? +options.opacity / unfocusDivisor : +options.opacity });

      node.transition().duration(200)
        .style("opacity", function(o) { return d.index == o.index || neighboring(d, o) ? +options.opacity : +options.opacity / unfocusDivisor; });

      d3.select(this).select("circle").transition()
        .duration(750)
        .attr("r", function(d){return nodeSize(d)+5;});

      node.select("text").transition()
        .duration(750)
        .attr("x", 13)
        .style("stroke-width", ".5px")
        .style("font", 24 + "px ")
        .style("opacity", function(o) { return d.index == o.index || neighboring(d, o) ? 1 : 0; });
    }

    function mouseout() {
      node.style("opacity", +options.opacity);
      link.style("opacity", +options.opacity);

      d3.select(this).select("circle").transition()
        .duration(750)
        .attr("r", function(d){return nodeSize(d);});
      node.select("text").transition()
        .duration(1250)
        .attr("x", 0)
        .style("font", options.fontSize + "px ")
        .style("opacity", 0);
    }

    d3.selectAll(".node").on("mouseover", mouseover).on("mouseout", mouseout);
}
'
然后对一个D3对象进行操作即可:
library(htmlwidgets)
onRender(fn, customJS)
simpleNetwork()的用法
forceNetwork()可以实现很多比较复杂的效果,但是simpleNetwork()使用起来更加方便。
simpleNetwork(Data, Source = 1, Target = 2, height = NULL, width = NULL,
  linkDistance = 50, charge = -30, fontSize = 7, fontFamily = "serif",
  linkColour = "#666", nodeColour = "#3182bd", opacity = 0.6, zoom = F)
参数介绍
-
Data
a data frame object with three columns. The first two are the names of the linked units. The third records an edge value. (Currently the third column doesn’t affect the graph.) -
Source
character string naming the network source variable in the data frame. If Source = NULL then the first column of the data frame is treated as the source. -
Target
character string naming the network target variable in the data frame. If Target = NULL then the second column of the data frame is treated as the target. -
height
height for the network graph’s frame area in pixels (if NULL then height is automatically determined based on context) -
width
numeric width for the network graph’s frame area in pixels (if NULL then width is automatically determined based on context) -
linkDistance
numeric distance between the links in pixels (actually arbitrary relative to the diagram’s size).可以利用JS语言 -
charge
numeric value indicating either the strength of the node repulsion (negative value) or attraction (positive value). -
fontSize
numeric font size in pixels for the node text labels. -
fontFamily
font family for the node text labels. -
linkColour
character string specifying the colour you want the link lines to be. Multiple formats supported (e.g. hexadecimal). -
nodeColour
character string specifying the colour you want the node circles to be. Multiple formats supported (e.g. hexadecimal). -
opacity
numeric value of the proportion opaque you would like the graph elements to be. -
zoom
logical value to enable (TRUE) or disable (FALSE) zooming
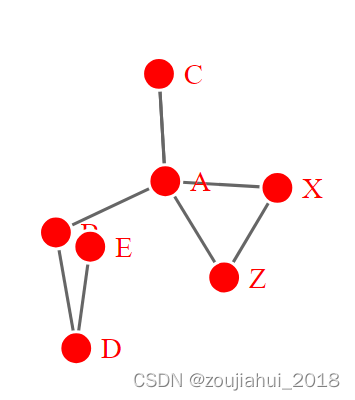
实例
library(networkD3)
net=data.frame(source=c('A','B','C','D','X','A','A','X'),target=c('C','D','A','E','Z','B','Z','A'),value=c(1,2,3,4,2,3,1,8))
simpleNetwork(net,fontSize=14,nodeColour='red',opacity=1,zoom=T)
参考:
https://cloud.tencent.com/developer/ask/sof/614660


 2727
2727

 被折叠的 条评论
为什么被折叠?
被折叠的 条评论
为什么被折叠?
 到【灌水乐园】发言


