


前言
本章讲解FileBeat的简单使用
方法
1.概念
接下来,算是正式进入Elastic Stack中的Beats了。通过准备篇的学习,我们知道Beats是elastic公司开源的一款采集系统监控数据的代理agent,是在被监控服务器上以客户端的形式运行的数据收集器的统称,可以直接把数据发送给ElasticSearch或者通过Logstash发送给ElasticSearch,然后进行后续的数据分析活动。
我们经常接触到的Beats有FileBeat和MetricBeat!
首先我们来看一下FileBeat,下面的图片来自于官网:https://www.elastic.co/cn/products/beats/filebeat

通过这句话我们发现,fileBeat用来收集诸如nginx等容器产生的日志文件并传输给我们的ELK
注意:本次示例将采集nginx的日志作为演示,请确保已经安装好nginx
2.fileBeat的安装和配置测试
我们可以在官网下载指定版本的filebeat:https://www.elastic.co/cn/downloads/beats/filebeat
本次我们下载的是7.4.0的window版本:
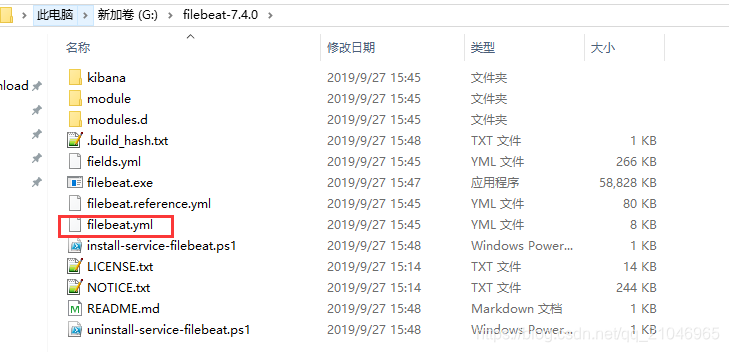
首先我们将filebeat.yml文件重新拷贝,重命名为test.yml文件以便于我们的测试!
打开test.yml文件,载入如下配置:
#=========================== Filebeat inputs =============================
filebeat.inputs:
#----------------------------- Stdin input -------------------------------
# Configuration to use stdin input
- type: stdin


#==================== Elasticsearch template setting ==========================
setup.template.settings:
  index.number_of_shards: 3

#================================ Outputs =====================================

# Configure what output to use when sending the data collected by the beat.

#----------------------------- Console output ---------------------------------
output.console:
  # Boolean flag to enable or disable the output module.
  enabled: true

  # Configure JSON encoding
  codec.json:
    # Pretty-print JSON event
    pretty: true
上面的设置filebeat接收控制台输入,并且将数据已json的格式输出至控制台!
我们尝试启动我们的filebeat:filebeat.exe -e -c test.yml
-e表示一个日志标准化的输出 -c指定我们的配置文件
启动成功后我们在控制台输入hello,则控制台返回如下json:
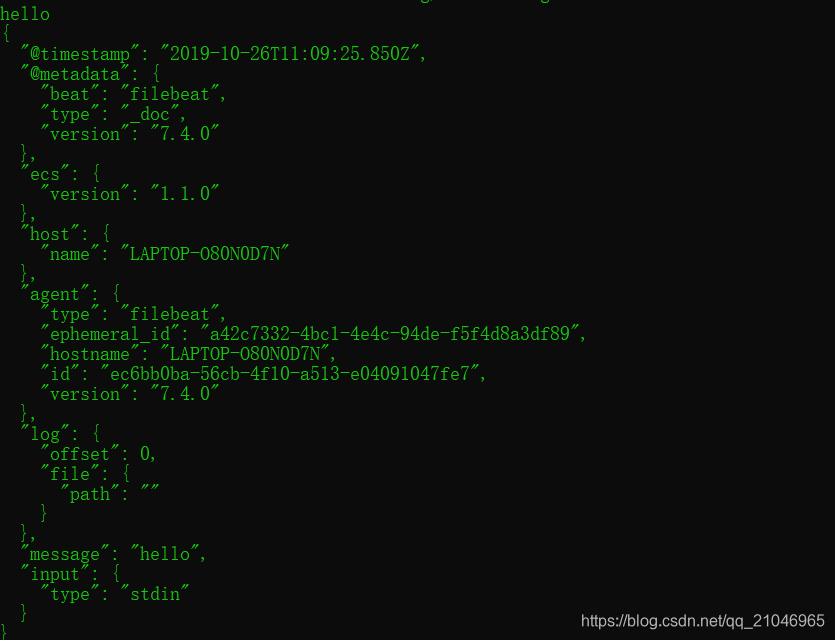
由此可见,我们的关键记录保存在了message中!
3.使用filebeat读取nginx日志输出到elasticsearch
这将是本章的重点!
1)载入nginx的module
在filebeat中,存在大量的module来辅助我们解析日志文件,正如上面测试的那样,我们采集到的日志统统都会粗拿在message中,这使得我们解析日志的难度增大,所以我们有必要启动nginx的module来简化日志分析!
使用命令查询当前启用和未启用的module:filebeat.exe modules list
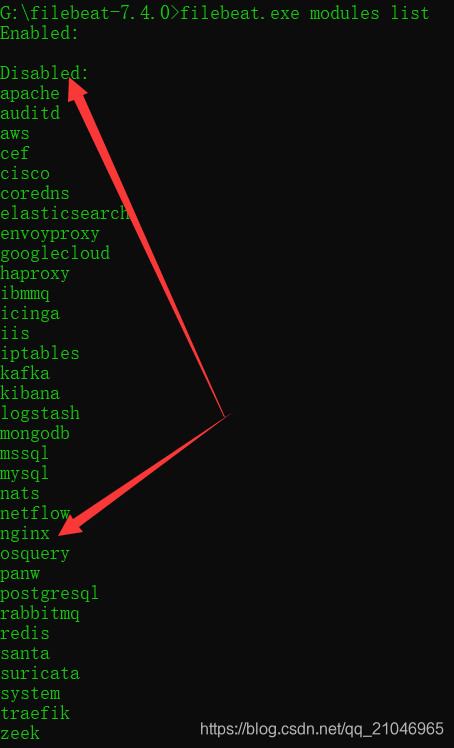
我们发现nginx的module并没有启用,我们将使用命令进行启用:filebeat.exe modules enable nginx
转移到filebeat根路径下的.\modules.d文件夹下,找到nginx.yml文件进行如下配置:
# Module: nginx
# Docs: https://www.elastic.co/guide/en/beats/filebeat/7.4/filebeat-module-nginx.html

- module: nginx
  # Access logs
  access:
    enabled: true

    # Set custom paths for the log files. If left empty,
    # Filebeat will choose the paths depending on your OS.
    var.paths:
       - G:\nginx-1.17.5\logs\access.log*

  # Error logs
  error:
    enabled: true

    # Set custom paths for the log files. If left empty,
    # Filebeat will choose the paths depending on your OS.
    var.paths:
       - G:\nginx-1.17.5\logs\error.log*
主要配置的是读取nginx的两种主要的日志文件:access.log和error.log
2)将filebeat.yml文件重新拷贝,重命名为nginx.yml文件
#============================= Filebeat modules ===============================

filebeat.config.modules:
  # Glob pattern for configuration loading
  path: ${path.config}/modules.d/*.yml

  # Set to true to enable config reloading
  reload.enabled: false

#==================== Elasticsearch template setting ==========================

setup.template.settings:
  index.number_of_shards: 3

#================================ Outputs =====================================

# Configure what output to use when sending the data collected by the beat.

#-------------------------- Elasticsearch output ------------------------------
output.elasticsearch:
  # Array of hosts to connect to.
  hosts: ["localhost:9200"]
由于我们采用了module来配置我们的输入,所以这里不需要配置input啦!
3)启动es,启动nginx,启动filebeat
启动nginx:start nginx.exe
启动filebeat:filebeat.exe -e -c nginx.yml
观察写入es中的数据:
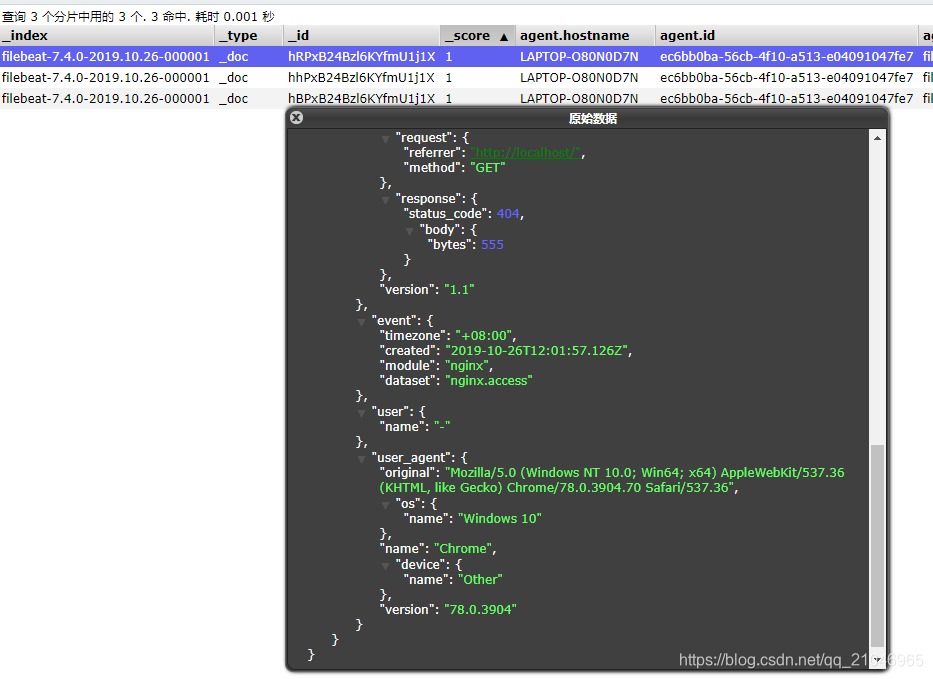
我们可以发现,这些数据很容易被我们解析!


 2292
2292

 被折叠的 条评论
为什么被折叠?
被折叠的 条评论
为什么被折叠?
 到【灌水乐园】发言


