图表上可以直接进行操作

第一个可以移动整体的图表显示
第二个可以选择一个区域将图整体放大
第三个指出来的可以修改图表的x和y的范围

如果进行了操作想还原成原来的效果,点击后退

后退表示直接返回上一层
画折线图
参考:https://www.pythonf.cn/read/22457
#绘制折线图
import matplotlib.pyplot as plt
year = [2011,2012,2013,2014]
pop = [1.2,3.4,4.5,6.5]
#折线图绘制函数
plt.plot(year,pop)
plt.show()

画散点图
#绘制折线图
import matplotlib.pyplot as plt
year = [2011,2012,2013,2014]
pop = [1.2,3.4,4.5,6.5]
#散点图绘制函数
plt.scatter(year,pop)
plt.show();

python matplotlib RuntimeWarning: Glyph xxxxx missing from current font.字体设置问题
参考:https://blog.csdn.net/weixin_43218670/article/details/105840128

这是错误提示,只需要补全下面代码就行(缺哪个补哪个)
from matplotlib import font_manager as fm, rcParams
import matplotlib as plt

plt.rcParams['font.sans-serif']=['SimHei'] #显示中文标签
plt.rcParams['axes.unicode_minus']=False   #这两行需要手动设置
修饰图
修饰图中的各类信息
title(’图形名称’) (都放在单引号内)
xlabel(’x轴说明’)
ylabel(’y轴说明’)
text(x,y,’图形说明’)
legend(’图例1’,’图例2’,…)
#coding=utf-8
import matplotlib.pyplot as plt

year = [1950,1970,1990,2010]
pop = [2.3,3.4,5.8,6.5]

#折线图,实体填充
plt.fill_between(year,pop,0,color='green')

#轴的标签
plt.xlabel('Year')
plt.ylabel('Population')

#轴的标题
plt.title('World Population')

#轴的y刻度
plt.yticks([0,2,4,6,8,10],['0B','2B','4B','6B','8B','10B'])
图表清空
画上的图表如果没有清空,会让之后的图表继续覆盖原来的图
参考:https://www.zhihu.com/question/26627112
在画图之前用cla(),亲测可以。下面是一个小例子
import matplotlib.pyplot as plt
import numpy as np

for i in range(1, 5) :
	x = range(0, i)
	y = range(0, i)
	y = np.array(y) * i
	plt.cla()		#这句的意思是清空
	plt.scatter(x, y, c = 'r', s = 20)
	plt.savefig("./test_%d.png" % i)
python画三维图
参考:https://blog.csdn.net/u014636245/article/details/82799573
fig = plt.figure()  #定义新的三维坐标轴
ax3 = plt.axes(projection='3d')

#定义三维数据
xx = np.arange(-5,5,0.5)
yy = np.arange(-5,5,0.5)
X, Y = np.meshgrid(xx, yy)
Z = np.sin(X)+np.cos(Y)


#作图
ax3.plot_surface(X,Y,Z,cmap='rainbow')
#ax3.contour(X,Y,Z, zdim='z',offset=-2,cmap='rainbow)   #等高线图,要设置offset,为Z的最小值
plt.show()

当然也可以用list来实现,以下是我的实现
from matplotlib import pyplot as plt
import numpy as np
from mpl_toolkits.mplot3d import Axes3D

def calc(x,y):
    return x**2+y**2
fig = plt.figure()
ax = Axes3D(fig)
'''
X = np.arange(-4, 4, 0.25)
print(X)
Y = np.arange(-4, 4, 0.25)
'''
X=[]
Y=[]
for i in range(-4,5):
    X.append(i)
for i in range(-4,5):
    Y.append(i)
X, Y = np.meshgrid(X, Y)
Z = calc(X,Y)
# 具体函数方法可用 help(function) 查看,如:help(ax.plot_surface)
ax.plot_surface(X, Y, Z, rstride=1, cstride=1, cmap='rainbow')
plt.show()
效果如下:

其中rstride=1, cstride=1是行和列的相邻之间的步距
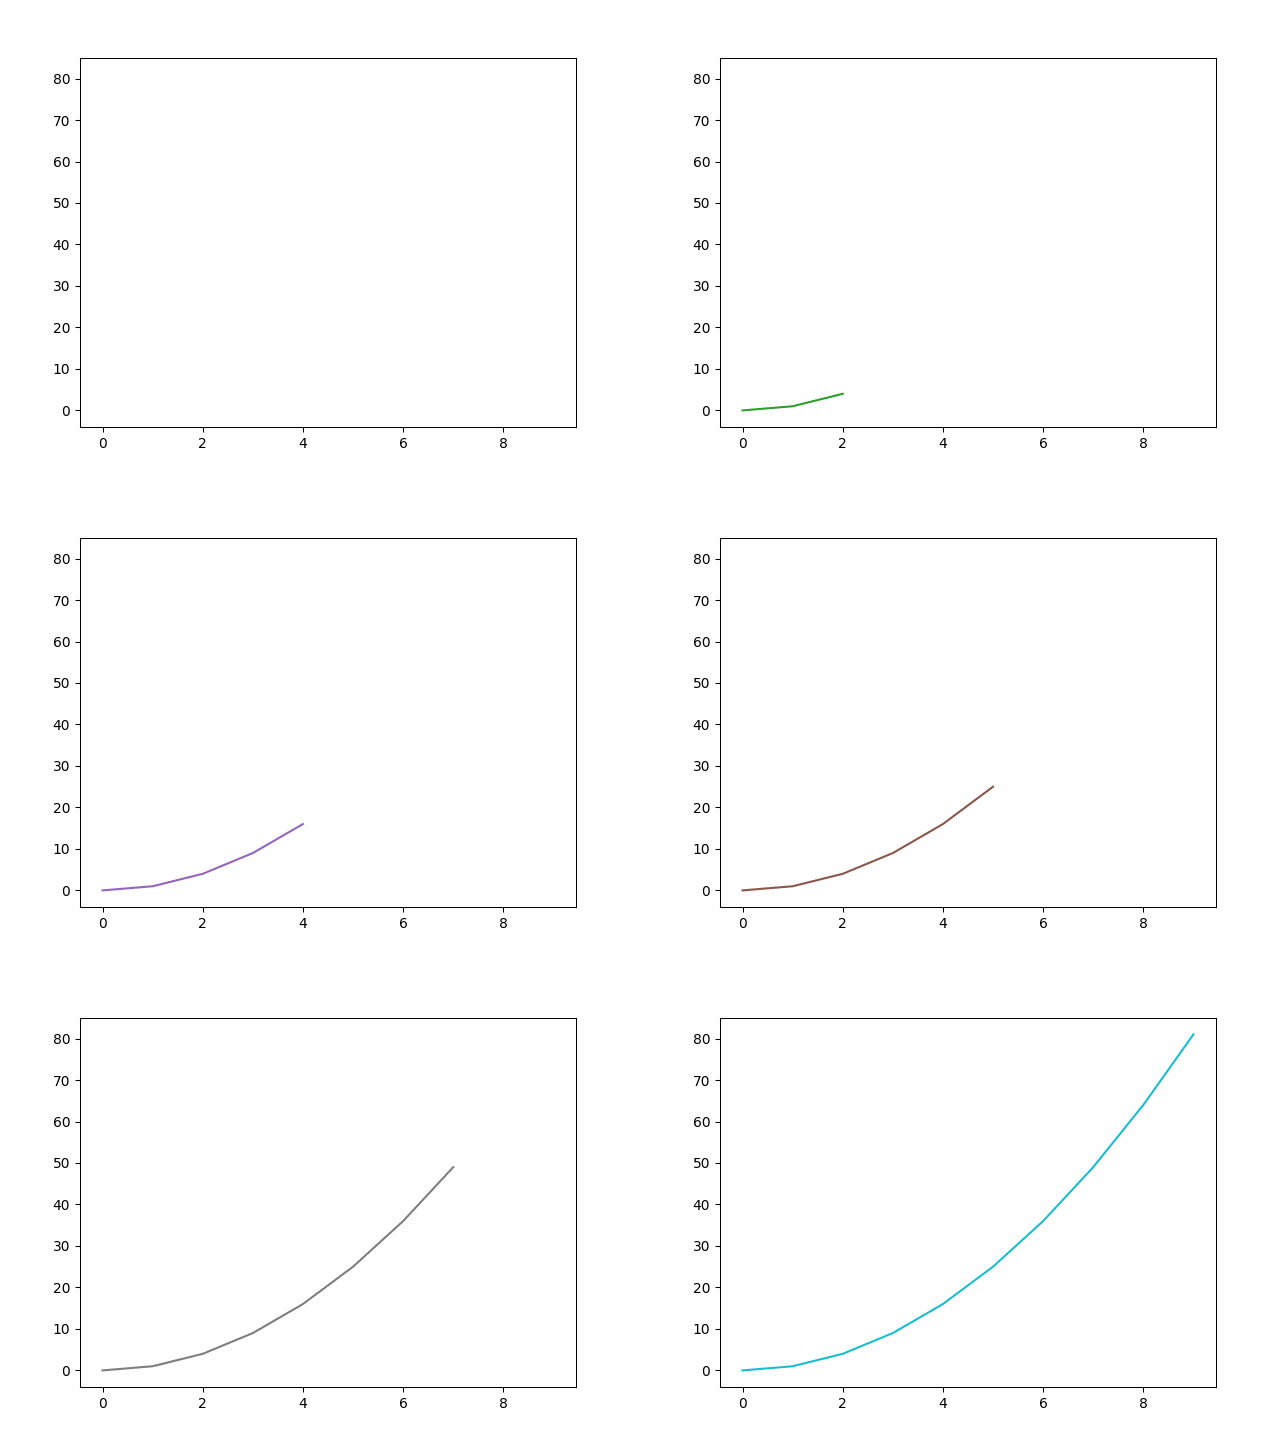
Python生成gif播放图并且Python显示gif
import os

import cv2
import matplotlib.pyplot as plt
import matplotlib.animation as animation
import numpy as np

Inputfile=[]
for i in range(0,10):
    Inputfile.append([i,i**2])
if __name__=="__main__":
    fig=plt.figure()
    xx=[]
    yy=[]
    yyyy=[]
    for i in range(10):
        x=Inputfile[i][0]
        xx.append(x)
        y=Inputfile[i][1]
        yy.append(y)
        yyy=plt.plot(xx,yy)
        yyyy.append(yyy)
    ani=animation.ArtistAnimation(fig,yyyy,interval=1,repeat_delay=1)
    ani.save("test3.gif",writer='pillow')

    #cv2.imshow("test3.gif", ani)
    os.system(r"start test3.gif")

画轨迹图
            #将侧面杠铃中心点轨迹显示出来
            plt.figure()
            xx=[]
            yy=[]
            plt.ylim((min_row_pixal,max_row_pixal))
            plt.xlim((min_col_pixal-(max_col_pixal-min_col_pixal)//2,max_col_pixal+(max_col_pixal-min_col_pixal)//2))
            for i in range(left_bell_len):
                if left_bell_track[i][2]==min_row_pixal:
                    break
                x=max_col_pixal-left_bell_track[i][1]+min_col_pixal
                xx.append(x)
                y=max_row_pixal-left_bell_track[i][2]
                yy.append(y)
                plt.plot(xx,yy)
            plt.show()
效果如下:

python plot画点
参考:https://zhidao.baidu.com/question/490409794107932212.html
import matplotlib.pyplot as plt
plt.plot(x,y,'ro',label="point")
plt.legend()
plt.show()
动态画二维图
参考:https://blog.csdn.net/xyisv/article/details/80651334
import numpy as np
import matplotlib.pyplot as plt

plt.axis([0, 100, 0, 1])
plt.ion()

xs = [0, 0]
ys = [1, 1]

for i in range(100):
    y = np.random.random()
    xs[0] = xs[1]
    ys[0] = ys[1]
    xs[1] = i
    ys[1] = y
    plt.plot(xs, ys)
    plt.pause(0.1)

matplotlib如何绘制比例柱状图?
参考:https://www.zhihu.com/question/326181892/answer/695693441

import numpy as np
import matplotlib.pyplot as plt

people = ('1','2','3','4','5','6','7','8')
segments = 4

# multi-dimensional data
data = np.asarray([[  3.40022085,   7.70632498,   6.4097905,   10.51648577,   7.5330039,
    7.1123587,   12.77792868,   3.44773477],
 [ 11.24811149,   5.03778215,   6.65808464,  12.32220677,   7.45964195,
    6.79685302,   7.24578743,   3.69371847],
 [  3.94253354,   4.74763549,  11.73529246,   4.6465543,   12.9952182,
    4.63832778,  11.16849999,   8.56883433],
 [  4.24409799,  12.71746612,  11.3772169,    9.00514257,  10.47084185,
   10.97567589,   3.98287652,   8.80552122]])

percentages = np.zeros((8, 4))
col_sum = np.sum(data, axis=0)
for i in range(data.shape[0]):
    for j in range(len(data[i])):
        percentages[j, i] = data[i, j] / col_sum[j] * 100

y_pos = np.arange(len(people))

fig = plt.figure(figsize=(10,8))
ax = fig.add_subplot(111)

colors ='rgbm'
patch_handles = []

bottom = np.zeros(len(people))
for i, d in enumerate(data):
    patch_handles.append(ax.bar(y_pos, d,
      color=colors[i%len(colors)], align='center',
      bottom=bottom))
    bottom += d

# search all of the bar segments and annotate
for j in range(len(patch_handles)):
    for i, patch in enumerate(patch_handles[j].get_children()):
        bl = patch.get_xy()
        x = 0.5*patch.get_width() + bl[0]
        y = 0.5*patch.get_height() + bl[1]
        ax.text(x,y, "%d%%" % (percentages[i,j]), ha='center')

plt.show()
[ python可视化 ] 给图像添加文字说明
参考:https://blog.csdn.net/qq_27886807/article/details/80586368?utm_medium=distribute.pc_aggpage_search_result.none-task-blog-2aggregatepagefirst_rank_ecpm_v1~rank_v31_ecpm-1-80586368.pc_agg_new_rank&utm_term=plot+plt+%E6%96%87%E5%AD%97%E8%AF%B4%E6%98%8E&spm=1000.2123.3001.4430
len=np.array(len) #这是我的数据列表
a=mean(len) #以添加均值和方差注释为例
b=var(len)
plt.hist(len,15,facecolor='g')#画频率分布直方图
plt.ylabel('Frequency')
plt.text(.64, 7, r'$\mu$={:.4f}, $\sigma$={:.5f}'.format(a, b) )
#用pyplot下的text方法,前两个属性标注text添加的位置,比如我这里添加在右上方.
plt.title('Frequency Distribution Histogram')
plt.show()
将图表进行图片生成
在linux上的可能会无法直接能看,这样可以生成图片来看
plt.savefig(str(year)+'.jpg')
这样即可生成图片,然后在vscode上远程看


 1256
1256


 被折叠的 条评论
为什么被折叠?


