


快开学了,安心在家的日子不多了。。今天也是暑假写笔记的最后一天了,下一次再写估计就是很久以后,,争取九月份入门r语言和bootstrap,毕竟还有好多事啊。。。
Layer用法
p=ggplot(diamonds,aes(carat,price,colour=cut))
p=p+geom_point()+geom_smooth()
p
钻石数据包。利用Layer可以把绘图设置、数据和出图形式分割开,可以反复利用前者就不用每次都需要copy了,代码看起来就简洁了许多。
p=ggplot(diamonds,aes(carat,price))
p=p+geom_point()+geom_smooth(colour="green")
p
colour="green"似乎放不放在aes()里无所谓,不放似乎更好些。
再举个例子:
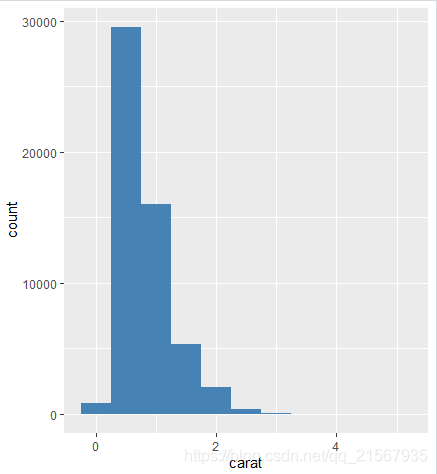
p=ggplot(diamonds,aes(x=carat))
p<-p+layer( geom="bar",params=list(fill="steelblue",binwidth = 0.5), stat="bin", position = "identity")
p
注意:position为位置参数,position = "identity"表示位置不做任何调整。stat为统计变换的参数。
位置参数position
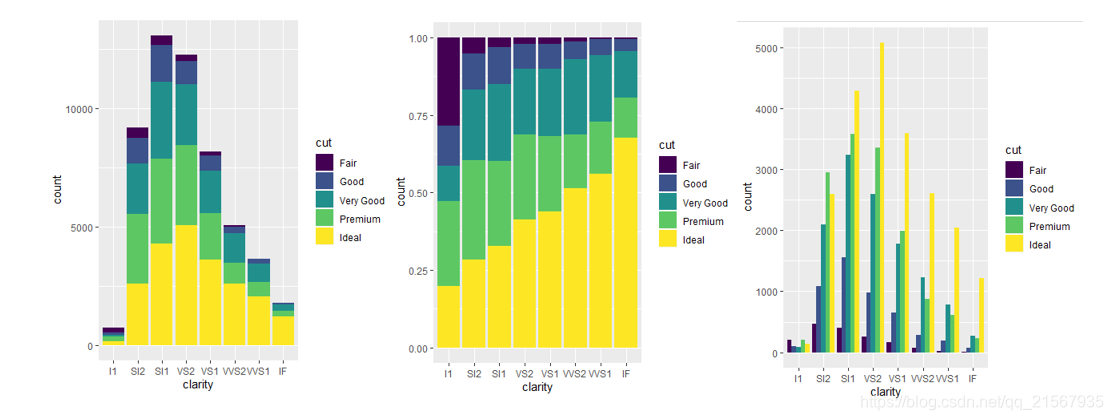
ggplot(diamonds,aes(clarity,fill=cut))+geom_bar(position="stack")
ggplot(diamonds,aes(clarity,fill=cut))+geom_bar(position="fill")
 ggplot(diamonds,aes(clarity,fill=cut))+geom_bar(position="dodge")
position="dodge"表示组内分级显示。position=position_dodge(0.7)为设置组内柱子的间距为0.7。
分组显示group=
install.packages("nlme")
 library("nlme")
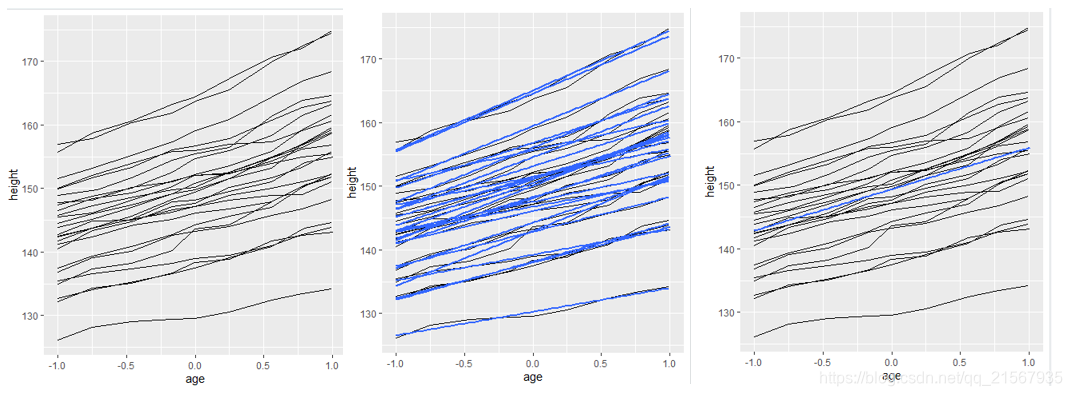
该数据包为26个男生身高随年龄变化
p=ggplot(Oxboys,aes(age,height,group=Subject))+geom_line()
p
p+geom_smooth(aes(group=Subject),method="lm",se=F)
p+geom_smooth(aes(group=1),method="lm",se=F)
下图从左到右分别为分组显示,分组拟合,整体拟合
手动设置样式scale_fill_manual
library(gcookbook)
climate
gcookbook数据包中的climate气候数据。
csub=subset(climate,Source="Berkeley"&Year>=1900)
csub$pos = csub$Anomaly10y >= 0
ggplot(csub,aes(x=Year,y=Anomaly10y,fill=pos))+
geom_bar(stat="identity",position = "identity")+
scale_fill_manual(values=c("#669933","#FFCC66"),guide=FALSE)
第二句中Anomaly10y >= 0表示新加一个pos列为Anomaly10y >= 0的结果。scale_fill_manual表示手动设置样式,guide=FALSE表示不加图例。

折线图(多线)
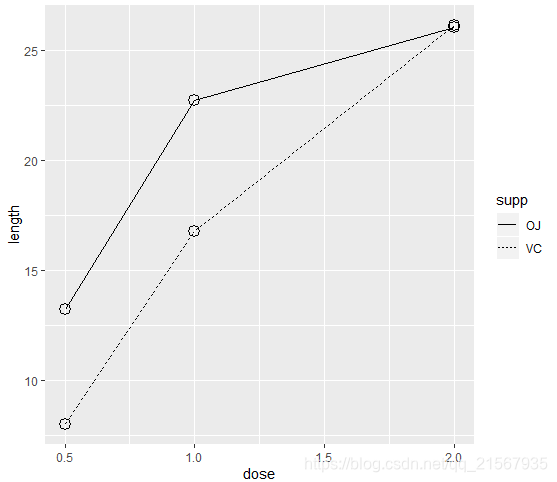
tg=ddply(ToothGrowth,c("supp","dose"),summarise,length=mean(len))
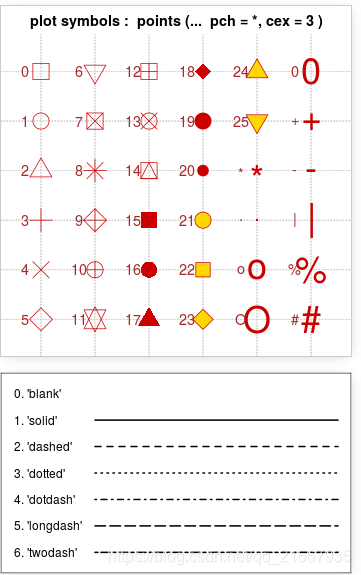
ggplot(tg,aes(x=dose,y=length,linetype=supp))+geom_line()+geom_point(size=4,shape=21)
ddply函数本文最后单独讲。
点、线型样式
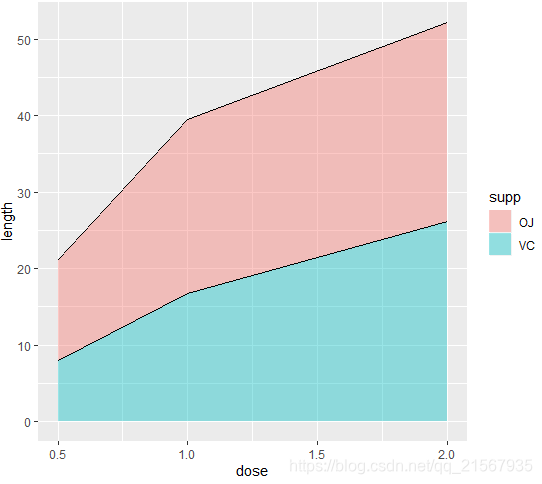
面积图
ggplot(tg,aes(x=dose,y=length,fill=supp,order=desc(supp)))+geom_area(alpha=0.4)+geom_line(position="stack",size=0.2)
注意这里两个面积是堆叠在一起的,不是相互覆盖的。
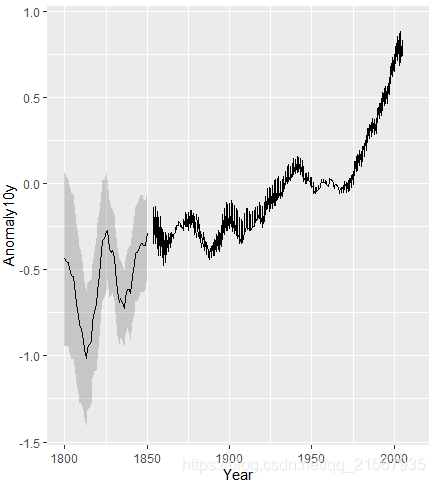
线条缓冲区(伪)
 clim=subset(climate,Source="Berkeley",select = c("Year","Anomaly10y","Unc10y"))
 ggplot(clim,aes(x=Year,y=Anomaly10y))+
geom_ribbon(aes(ymin=Anomaly10y-Unc10y,ymax=Anomaly10y+Unc10y),alpha=0.2)+geom_line()
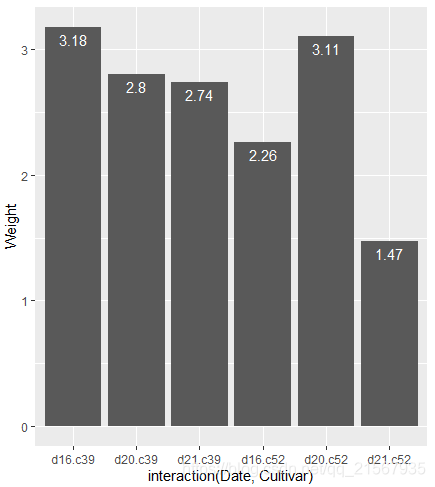
增加Label
ggplot(cabbage_exp,aes(x=interaction(Date,Cultivar),y=Weight))+
geom_bar(stat="identity")+
geom_text(aes(label=Weight),vjust=1.5,colour="white")+
ylim(0,max(cabbage_exp$Weight)*1.05)
interaction()为里面变量的组合,vjust为数值离柱子水平线的距离。ylim则是设置柱子到图像边缘的距离。
柱状图排序reorder()
注意:reorder()里第一个参数为factor标签,第二个参数为weight相应的y值。
aes(x=reorder(Cultivar,Weight),y=Weight))
subset函数
从某一个数据框中选择出符合某条件的数据或是相关的列。
1单条件查询
selectresult=subset(data,name=="q")
2指定显示列(显示age、sex列)
selectresult=subset(data,name=="q",select=c(age,sex))
3多条件查询
selectresult=subset(data,name=="q" & sex=="f",select=c(age,sex))
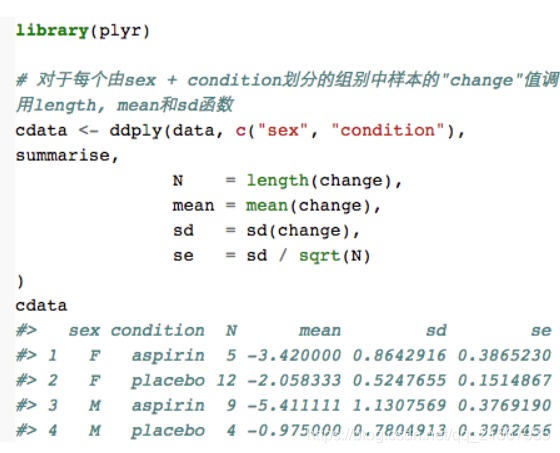
ddply函数(plyr包)
用于分组统计数据的均值方差等等。
参考资料:
1.http://www.sohu.com/a/111261376_464826


 650
650


 被折叠的 条评论
为什么被折叠?
被折叠的 条评论
为什么被折叠?
 到【灌水乐园】发言


