


当路由manhattan 和工具segments 同时使用时,segments 渲染在边上的小方块会与边不对齐,例如竖边上会渲染出水平小方块,水平边上会渲染竖直小方块。如下图:

参考官方文档/图表示例/边/辅助工具/调整线段给出的案例来看,在边添加了vertices之后,segments可以正常运作。
于是考虑主动设置vertices以支持Segments,进而可得思路为,怎么获取manhattan路由的拐点。
同时参考ProcessOn的交互逻辑,用户在拖动节点时,边会抛弃用户的调整,根据设定路由对边的路径进行重绘。
因此这里也采用这里的交互方式,即:
node:mousedown时 清空现有相连边的vertices
node:mouseup时 获得路由routePoints 设置node相连边的vertices
manhattan路由的拐点在哪里?
打印一下
graph.on("node:mousedown", (e) => {
  console.log(e)
  debugger
})
可得如下结构
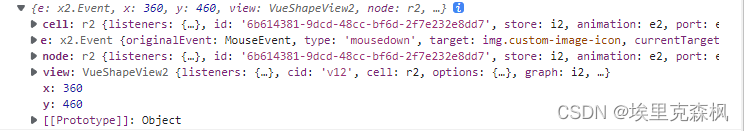
其中cell和view是 node:mousedown 下的节点对应的cellModel 和 view。
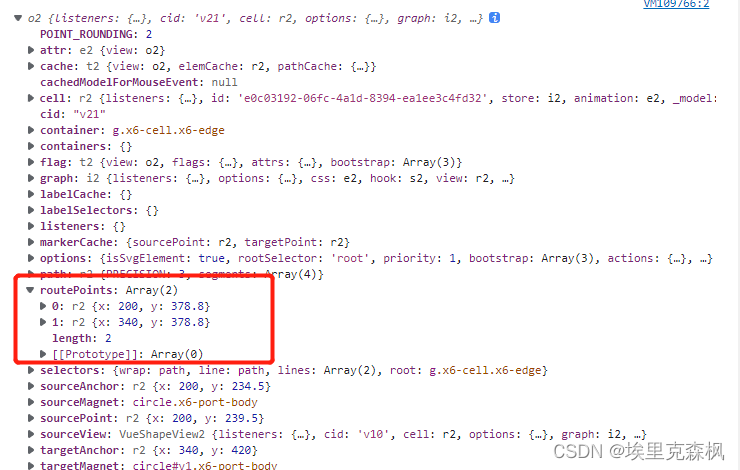
进一步打印获得相连边的view
graph.getConnectedEdges(e.cell).forEach((edge) => {
    console.log(graph.findViewByCell(edge))
})
可得如下结构
搜索下文档
https://antv-x6.gitee.io/zh/docs/api/registry/connector/#registry
在connector的章节中找到了相关解释,虽然不在路由的文中,但姑且先拿来用。
根据上面说的设计思路,代码如下:
graph.on("node:mousedown", (e) => {
  const connectedEdges = graph.getConnectedEdges(e.cell)
  connectedEdges.forEach(edge => {
    edge.setVertices([])
  })
})
graph.on("node:mouseup", (e) => {
const connectedEdges = graph.getConnectedEdges(e.cell)
connectedEdges.forEach(edge => {
edge.setVertices(graph.findViewByCell(edge).routePoints)
})
})于是工具Segments 开始有预期表现。同时也证明EdgeView 中routePoints 就是路由算出的拐点

工具条正常后,可能出现问题:结束节点接入边始终不正常(最后会拐一下),如下图:
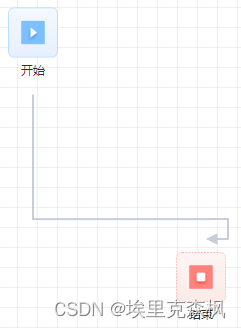
可以考虑将manhattan路由的step参数设置为网格大小,如下:
new Graph({
  //...
  grid: {
    visible: true,
    type: "mesh",
    size: 20, // 网格大小 px
    color: "rgb(246,246,246)",
  },
  connecting: {
    router: {
      name: "manhattan",
      args: {
        step: 20, // 画布的网格大小
      }
    },
  }
  // ...
})
本文基于以下antv/x6版本
"@antv/x6": "^1.31.3",
"@antv/x6-vue-shape": "^1.3.2",
在搜索到以下issue没有人回复还被Bot关闭后
segments工具和manhattan路由一起使用有问题 · Issue #1324 · antvis/X6 · GitHub
manhattan 路由出现的顶点不在 segments 的计算范围内 · Issue #1814 · antvis/X6 · GitHub
百度、谷歌、必应无果后,所做的尝试。
如果有更好的方法,欢迎评论。
着急改BUG,如果文章有纰漏也欢迎评论。


 570
570


 被折叠的 条评论
为什么被折叠?
被折叠的 条评论
为什么被折叠?
 到【灌水乐园】发言


