


import { Graph, FunctionExt, Point, Path } from '@antv/x6'
addData() {
  this.graph = new Graph({
      container: document.getElementById('container'), //
      width: width, // 画布宽度
      height: height, // 画布高度
      grid: {
        // 网格设置
        size: 40, // 网格大小 10px
        visible: true, // 渲染网格背景
        type: 'mesh',
        args: {
          color: '#D0D0D0',
          thickness: 1, // 网格线宽度
          factor: 10
        }
      },
      autoResize: false, // 跟随窗口自动变化大小
      snapline: false, // 对齐线
      connecting: {
        allowBlank: true,
        snap: {
          radius: 20 // 自动吸附
        }
      },
      history: true, // 启动撤销重做功能
      selecting: true
      // background: {
      //   image: require('../../assets/img/fj.jpg')
      // }
    })
   const data = {
        // 节点
        nodes: [{
            id: 'node1',
            zIndex: 10,
            x: 10,
            y: 50,
            shape: 'custom-sc',
            width: 160,
            height: 140,
            ports: this.ports
          },
          {
            id: 'node2',
            zIndex: 10,
            shape: 'custom-sc2',
            x: 80,
            y: -300,
            width: 20,
            height: 80,
            ports: this.ports
          },
          {
            id: 'gif',
            shape: 'custom-gif',
            x: -200,
            y: 100,
            width: 140,
            height: 140,
            ports: this.ports
          }
        ],
        // 边
        edges: [{
          id: '1',
          source: { cell: 'node1', port: 'port1' },
          target: { cell: 'node2', port: 'port2' },
          vertices: [
            // { x: 140, y: 200 },
            { x: 90, y: 30 },
            { x: 70, y: 20 },
            { x: 90, y: 10 }
          ],
          shape: 'edge',
          zIndex: 10,
          label: '水流',
          attrs: {
            line: {
              stroke: 'rgba(92,165,238,0)',
              strokeWidth: 5,
              strokeDasharray: 0
              targetMarker: ''
            },
            style: {
              animation: 'ant-line 30s infinite linear'
            }
          }
        }, {
          id: '2',
          source: { cell: 'node1', port: 'port1' },
          target: { cell: 'node2', port: 'port2' },
          vertices: [
            { x: 90, y: 30 },
            { x: 70, y: 20 },
            { x: 90, y: 10 }
          ],
          shape: 'edge',
          zIndex: 10,
          attrs: {
            line: {
              stroke: 'rgba(92,165,238,0.5)',
              strokeWidth: 5,
              strokeDasharray: 0,
              targetMarker: ''
            },
            style: {
              animation: 'ant-line 30s infinite linear'
            }
          }
        }, {
          id: '3',
          source: { cell: 'node1', port: 'port1' },
          target: { cell: 'node2', port: 'port2' },
          vertices: [
            { x: 90, y: 30 },
            { x: 70, y: 20 },
            { x: 90, y: 10 }
          ],
          shape: 'edge',
          zIndex: 10,
          angle: 0, // 旋转
          attrs: {
            line: {
              stroke: 'rgba(92,165,238, 0.4)',
              strokeWidth: 12,
              strokeDasharray: 0,
              targetMarker: ''
            },
            style: {
              animation: 'ant-line 30s infinite linear'
            }
          }
        }]
      }
      this.graph.fromJSON(data)
      // 动画 -- 水流流动效果
      this.setAnimate('1')
},
setAnimate(id) {
    const edges = this.graph.getEdges()
    edges.forEach((edge) => {
      if (edge.id === id) {
        edge.attr('line', {
          strokeDasharray: 5,
          style: {
            animation: 'ant-line 30s infinite linear'
          }
        })
      }
    })
  },
// 撤销
  revoke() {
    this.graph.undo()
  }

  // 重做
  redo() {
    this.graph.redo()
  }

  // 重置视图--还原比例
  resetView() {
    this.graph.zoom(this.graph_zoom <= 0 ? Math.abs(this.graph_zoom) : -this.graph_zoom)
    this.mapZoom = 0

    this.graph.resize(1300, 820)
    this.setCenter()
  }

  // 地图放大缩小
  mapZoom(type) {
    if (type === '放大') {
      this.graph.zoom(0.1)
      this.mapZoom += 0.1
    } else if (type === '缩小') {
      this.graph.zoom(-0.1)
      this.mapZoom -= 0.1
    }
  }

  // 全屏浏览
  screenView() {
    this.graph.resize(1850, 850)
    this.setCenter()
  }

  // 加载json数据
  loadData(json) {
    this.graph.fromJSON(json)
  }
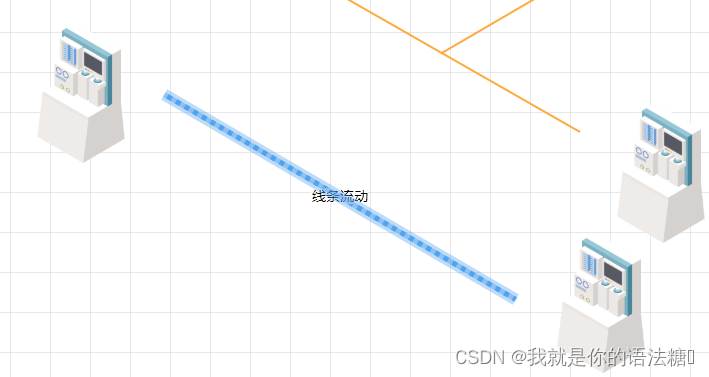
线条流动动画


 1795
1795


 被折叠的 条评论
为什么被折叠?
被折叠的 条评论
为什么被折叠?
 到【灌水乐园】发言


