


echart实现3D地理图的绘制
尝试echart能够实现的功能
绘制地图
- 下载地图geoJSON文件
- dataV-geoatlas
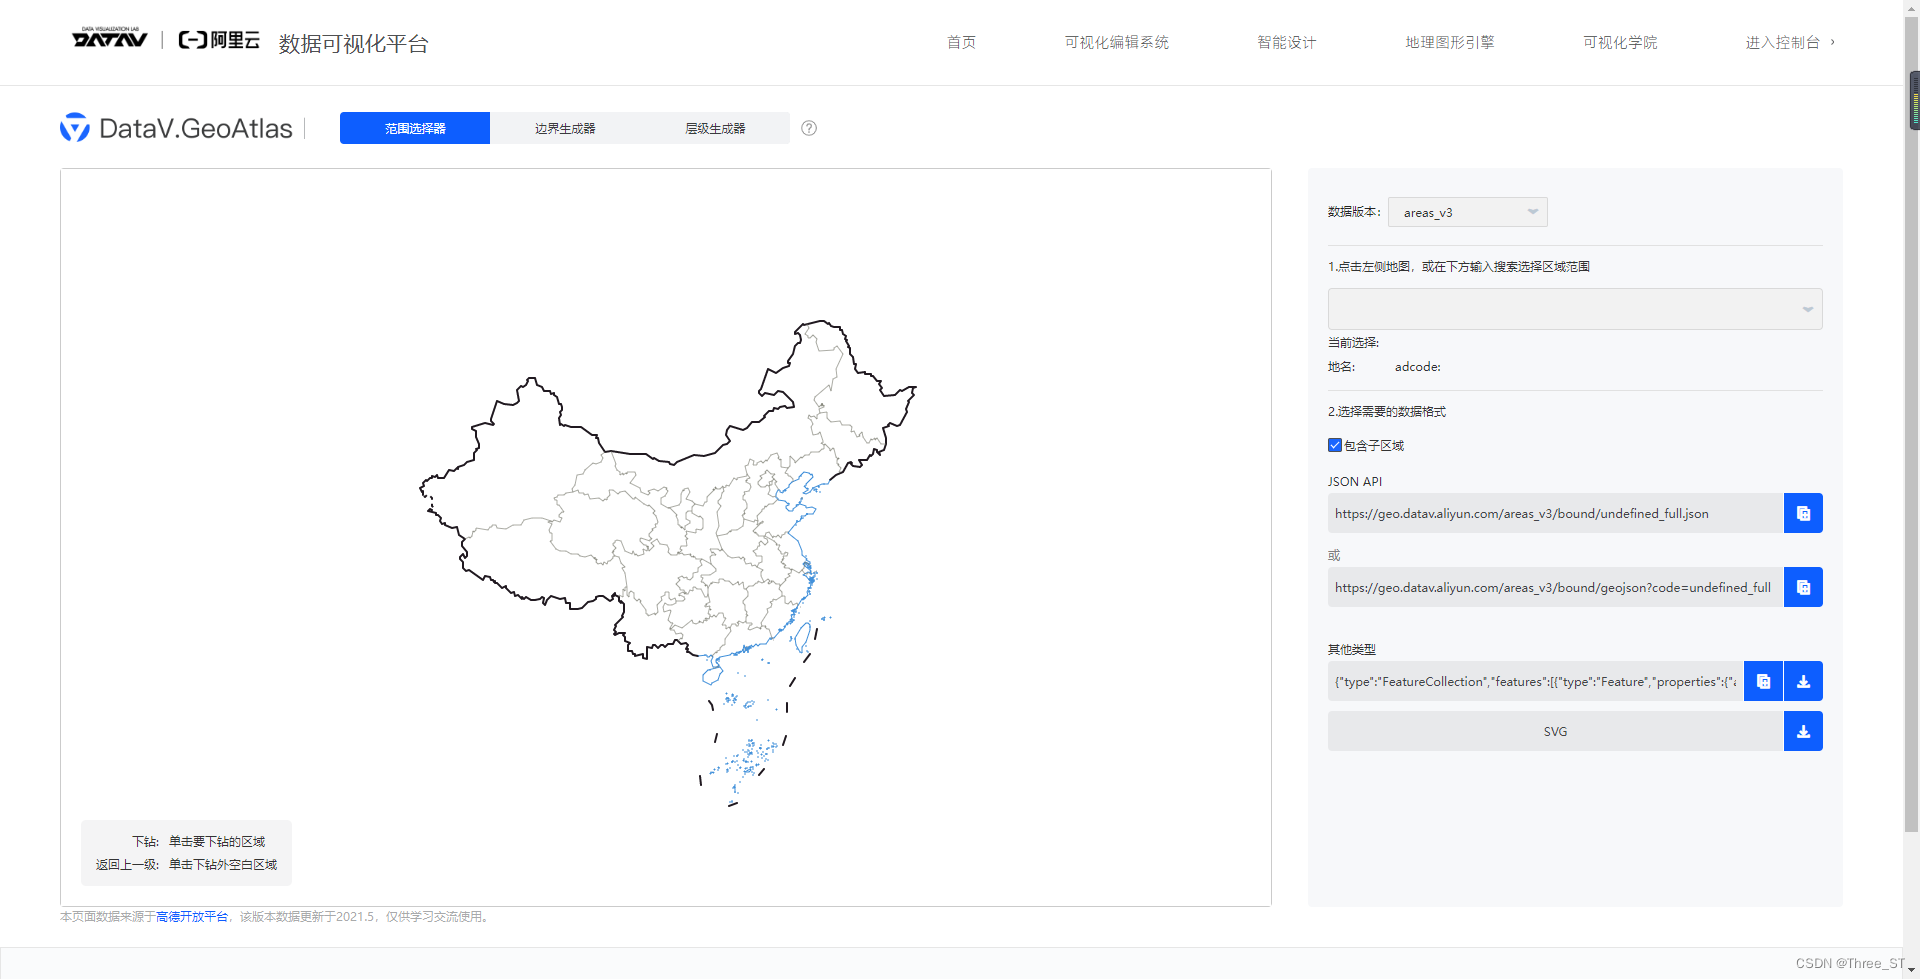
下载感兴趣的数据
- 引用echart,对于三维地图,需要引入echarts-gl这个组件1
npm install echarts
npm install echarts-gl
在页面中引用
<div id="echarts_map" ref="echarts_map"></div>
    this.myChart = this.$echarts.init(this.$refs.echarts_map);
      // 2. 注册可用的地图,只在 geo 组件或者map图表类型中使用
      this.$echarts.registerMap("wulingshan", mapjson); //用导入的json文件注册一个name:map 的地图组件
      // 3. 设置图表 option
      var option = {
        backgroundColor: "#000f1e",
        geo: {
          type: "map",
          map: "wulingshan",
          show: false,
        },
        geo3D: {
          map: "wulingshan",
          show: false,
          zlevel: -10,
          boxWidth: 200,
          boxHeight: 4, //4:没有bar. 30:有bar,bar最高度30,按比例分配高度
          regionHeight: 3,
          shading: "lambert",

          viewControl: {
            projection: "perspective",
            autoRotate: false,
            damping: 0,
            rotateSensitivity: 2, //旋转操作的灵敏度
            rotateMouseButton: "left", //旋转操作使用的鼠标按键
            zoomSensitivity: 2, //缩放操作的灵敏度
            panSensitivity: 2, //平移操作的灵敏度
            panMouseButton: "right", //平移操作使用的鼠标按键

            distance: 500, //默认视角距离主体的距离
            center: [0, 0, 0],

            animation: true,
            animationDurationUpdate: 1000,
            animationEasingUpdate: "cubicInOut",
          },
        },

        series: [
          {
            type: "map3D",
            map: "wulingshan",
            name: "wulingshan",
            selectedMode: "single", //地图高亮单选
            regionHeight: 5, //地图高度

            show: true,
            zlevel: 1,
            boxWidth: 200,
            //boxHeight: 4, //4:没有bar. 30:有bar,bar最高度30,按比例分配高度
            regionHeight: 3,
            shading: "lambert",
            label: {
              // 标签的相关设置
              show: false,
            },

            itemStyle: {
              color: "#2B5890",
              areaColor: "#025894",
              opacity: 0.8,
              borderWidth: 3,
              borderColor: "#5578A5",
            },
            emphasis: {
              label: {
                show: true,

                textStyle: {
                  color: "#fff",
                  fontSize: 14,
                  backgroundColor: "transparent", // 字体背景色
                },
              },
              shading: "lambert",

              borderColor: "#333",
              borderWidth: 5,
              itemStyle: {
                color: "#025894",
                areaColor: "#025894",
              },
            },
            light: {
              main: {
                shadow: true,
                shadowQuality: "ultra",
              },
            },

            viewControl: {
              projection: "perspective",
              autoRotate: false,
              damping: 0,
              rotateSensitivity: 2, //旋转操作的灵敏度
              rotateMouseButton: "left", //旋转操作使用的鼠标按键
              zoomSensitivity: 2, //缩放操作的灵敏度
              panSensitivity: 2, //平移操作的灵敏度
              panMouseButton: "right", //平移操作使用的鼠标按键

              distance: 500, //默认视角距离主体的距离
              center: [0, 0, 0],

              animation: true,
              animationDurationUpdate: 1000,
              animationEasingUpdate: "cubicInOut",
            },
          },
          {
            type: "scatter3D",
            coordinateSystem: "geo3D",
            zlevel: 3,
            // symbol:'path:// ',
            // symbol: 'path://m232.99844,160.209511l15.863519,0l0,-14.211071l16.27296,0l0,14.211071l15.863521,0l0,14.577861l-15.863521,0l0,14.211069l-16.27296,0l0,-14.211069l-15.863519,0l0,-14.577861z',
            symbol: "circle",
            symbolSize: 16,

            label: {
              normal: {
                show: true,
                position: "right",
                formatter: "{b}",

                textStyle: {
                  color: "#fff",
                  fontSize: 14,
                  backgroundColor: "transparent", // 字体背景色
                },
              },
            },

            data: [],
            itemStyle: {
              //坐标点颜色
              color: "#67AE94",
              shadowBlur: 20,
              shadowColor: "#fff",
            },
            emphasis: {
              itemStyle: {
                //坐标点颜色
                color: "#1ca1d2",
              },
            },
          },

        ],
      };

      // 4. myChart.setOption
      this.myChart.setOption(option);
创建飞线
// 线 和 点
          {
            type: "lines3D",
            coordinateSystem: "geo3D",
            zlevel: 1, //设置这个才会有轨迹线的小尾巴
            polyline: false,
            effect: {
              show: true,
              period: 10,
              trailLength: 0.1,
              trailColor: "#17eafe",
              color: "#fff", //流动点颜色
              symbol: "amarkLinesow",
              symbolSize: 6,
            },
            lineStyle: {
              normal: {
                color: "#fff", //线条颜色
                width: 1,
                curveness: 0.5,
                shadowColor: "#fff",
              },
            },
            blendMode: "lighter",
            data: [],
          },
创建立柱
          {
            type: "bar3D",
            name: "wulingshan",
            coordinateSystem: "geo3D",
            zlevel: 6,
            data: barPoints,
            label: {
              show: false,
              formatter: function (params) {
                return params.name + "\n" + params.value[0];
              },
            },
          },
完整代码
<template>
<div class="map">
<div id="echarts_map" ref="echarts_map"></div>
</div>
</template>
<script>
import { getCountyMapInfo, adcode2name } from "@/utils/map";
import mapjson from "../../../../public/map/500000_wulingshan.json";
export default {
components: {
},
data() {
return {
myChart: null,
type: "",
markPoint: [],
linesData: [],
mapData: {},
resources: {},
mapjson: null,
fontSize: 12,
activeIndex: "1",
showBack: false,
tooltipVisible: {
scene: false,
},
option: {},
};
},
mounted() {
console.log(this);
// 1. 创建一个 ECharts 实例,返回 echartsInstance,不能在单个容器上初始化多个 ECharts 实例
this.myChart = this.$echarts.init(this.$refs.echarts_map);
this.mapData = adcode2name;
this.initChart();
window.addEventListener("resize", this.onScreenResize);
this.onScreenResize();
setTimeout(() => {
this.initMapData();
}, 1000);
},
destroyed() {
window.addEventListener("resize", this.onScreenResize);
},
methods: {
initMapData() {
const mapUrl = "http://127.0.0.1:8000/api/map/files";
const mapListUrl = "http://127.0.0.1:8000/api/map/counties";
const resourceUrl = "http://127.0.0.1:8000/api/map/resources";
this.$.getJSON(mapUrl, (geoJson) => {
console.log(geoJson);
this.updateChart(geoJson);
});
this.$.getJSON(mapListUrl, (data) => {
console.log(typeof data, data instanceof Object);
this.mapData = data instanceof Object ? data : JSON.parse(data);
console.log(data, this.mapData);
});
this.$.getJSON(resourceUrl, (data) => {
console.log(typeof data, data instanceof Object);
this.resources = data instanceof Object ? data : JSON.parse(data);
console.log(data, this.resources);
});
},
updateChart(geoJson) {
this.mapjson = geoJson;
let points = geoJson.features.map((item) => {
let obj = {
name: item.properties.name,
value: [...item.properties.center, 1],
};
return obj;
});
let effectPoints = geoJson.features.map((item) => {
let obj = {
name: item.properties.name,
value: [...item.properties.center],
};
return obj;
});
this.markPoint = points;
let barPoints = geoJson.features.map((item) => {
let obj = {
name: item.properties.name,
value: [
item.properties.center[0] - 0.1,
item.properties.center[1] - 0.1,
Math.random()*10000,
],
};
return obj;
});
let markLines = [];
for (let i = 1; i < geoJson.features.length; i++) {
let prev = geoJson.features[i - 1];
let next = geoJson.features[i];
let obj = {
fromName: prev.properties?.name,
toName: "武陵山", //next.properties?.name,
coords: [
[107.593505859375, 29.538433074951173, 1],
[...prev.properties?.center, 1],
// [...next.properties?.center, 1],
],
};
markLines.push(obj);
}
this.linesData = markLines;
console.log(barPoints, points, effectPoints, markLines);
var option = {
backgroundColor: "#000f1e",
geo: {
type: "map",
map: "wulingshan",
show: false,
},
geo3D: {
map: "wulingshan",
show: false,
zlevel: -10,
boxWidth: 200,
boxHeight: 30, //4:没有bar. 30:有bar,bar最高度30,按比例分配高度
regionHeight: 10,
shading: "lambert",
viewControl: {
projection: "perspective",
autoRotate: false,
damping: 0,
rotateSensitivity: 2, //旋转操作的灵敏度
rotateMouseButton: "left", //旋转操作使用的鼠标按键
zoomSensitivity: 2, //缩放操作的灵敏度
panSensitivity: 2, //平移操作的灵敏度
panMouseButton: "right", //平移操作使用的鼠标按键
distance: 500, //默认视角距离主体的距离
center: [0, 0, 0],
animation: true,
animationDurationUpdate: 1000,
animationEasingUpdate: "cubicInOut",
},
},
series: [
{
type: "map3D",
map: "wulingshan",
name: "wulingshan",
selectedMode: "single", //地图高亮单选
regionHeight: 5, //地图高度
show: true,
zlevel: 1,
boxWidth: 200,
//boxHeight: 4, //4:没有bar. 30:有bar,bar最高度30,按比例分配高度
regionHeight: 3,
shading: "lambert",
label: {
// 标签的相关设置
show: false,
},
itemStyle: {
color: "#2B5890",
areaColor: "#025894",
opacity: 0.8,
borderWidth: 3,
borderColor: "#5578A5",
},
emphasis: {
label: {
show: true,
textStyle: {
color: "#fff",
fontSize: 14,
backgroundColor: "transparent", // 字体背景色
},
},
shading: "lambert",
borderColor: "#333",
borderWidth: 5,
itemStyle: {
color: "#025894",
areaColor: "#025894",
},
},
light: {
main: {
shadow: true,
shadowQuality: "ultra",
},
},
viewControl: {
projection: "perspective",
autoRotate: false,
damping: 0,
rotateSensitivity: 2, //旋转操作的灵敏度
rotateMouseButton: "left", //旋转操作使用的鼠标按键
zoomSensitivity: 2, //缩放操作的灵敏度
panSensitivity: 2, //平移操作的灵敏度
panMouseButton: "right", //平移操作使用的鼠标按键
distance: 500, //默认视角距离主体的距离
center: [0, 0, 0],
animation: true,
animationDurationUpdate: 1000,
animationEasingUpdate: "cubicInOut",
},
},
{
type: "scatter3D",
coordinateSystem: "geo3D",
zlevel: 3,
symbolSize: [16, 16],
data: [],
// itemStyle: {
// //坐标点颜色
// color: "#2681cf",
// shadowBlur: 20,
// shadowColor: "#fff",
// },
emphasis: {
// itemStyle: {
// //坐标点颜色
// color: "#1ca1d2",
// },
},
animation: true,
},
{
type: "scatter",
coordinateSystem: "geo3D",
zlevel: 5,
symbolSize: 16,
rippleEffect: {
scale: 5,
brushType: "stroke",
},
label: {
normal: {
show: true,
position: "right",
formatter: "{b}",
textStyle: {
color: "#fff",
fontSize: 14,
backgroundColor: "transparent", // 字体背景色
},
},
},
itemStyle: {
color: "#FFA500",
borderColor: "#FF8C00",
},
data: effectPoints,
},
// 线 和 点
{
type: "lines3D",
coordinateSystem: "geo3D",
zlevel: 1, //设置这个才会有轨迹线的小尾巴
polyline: false,
effect: {
show: true,
period: 10,
trailLength: 0.1,
trailColor: "#FFA500",
color: "#FFA500", //流动点颜色
symbol: "amarkLinesow",
symbolSize: 6,
},
lineStyle: {
normal: {
color: "#FFA500", //线条颜色
width: 1,
curveness: 0.5,
shadowColor: "#FF8C00",
},
},
blendMode: "lighter",
data: markLines,
},
{
type: "bar3D",
name: "wulingshan",
coordinateSystem: "geo3D",
zlevel: 6,
data: barPoints,
label: {
show: false,
formatter: function (params) {
return params.name + "\n" + params.value[0];
},
},
},
],
};
option.series[1].data = points;
option.series[2].data = effectPoints;
option.series[3].data = markLines;
this.myChart.setOption(option);
console.log(this.linesData, this.markPoint, option);
},
/*
geo:地理坐标系组件( https://echarts.apache.org/zh/option.html#geo)
地理坐标系组件用于地图的绘制,支持在地理坐标系上绘制散点图
*/
initChart() {
// 2. 注册可用的地图,只在 geo 组件或者map图表类型中使用
this.$echarts.registerMap("wulingshan", mapjson); //用导入的json文件注册一个name:map 的地图组件
// 3. 设置图表 option
var option = {
backgroundColor: "#000f1e",
geo: {
type: "map",
map: "wulingshan",
show: false,
},
geo3D: {
map: "wulingshan",
show: false,
zlevel: -10,
boxWidth: 200,
boxHeight: 4, //4:没有bar. 30:有bar,bar最高度30,按比例分配高度
regionHeight: 3,
shading: "lambert",
viewControl: {
projection: "perspective",
autoRotate: false,
damping: 0,
rotateSensitivity: 2, //旋转操作的灵敏度
rotateMouseButton: "left", //旋转操作使用的鼠标按键
zoomSensitivity: 2, //缩放操作的灵敏度
panSensitivity: 2, //平移操作的灵敏度
panMouseButton: "right", //平移操作使用的鼠标按键
distance: 500, //默认视角距离主体的距离
center: [0, 0, 0],
animation: true,
animationDurationUpdate: 1000,
animationEasingUpdate: "cubicInOut",
},
},
series: [
{
type: "map3D",
map: "wulingshan",
name: "wulingshan",
selectedMode: "single", //地图高亮单选
regionHeight: 5, //地图高度
show: true,
zlevel: 1,
boxWidth: 200,
//boxHeight: 4, //4:没有bar. 30:有bar,bar最高度30,按比例分配高度
regionHeight: 3,
shading: "lambert",
label: {
// 标签的相关设置
show: false,
},
itemStyle: {
color: "#2B5890",
areaColor: "#025894",
opacity: 0.8,
borderWidth: 3,
borderColor: "#5578A5",
},
emphasis: {
label: {
show: true,
textStyle: {
color: "#fff",
fontSize: 14,
backgroundColor: "transparent", // 字体背景色
},
},
shading: "lambert",
borderColor: "#333",
borderWidth: 5,
itemStyle: {
color: "#025894",
areaColor: "#025894",
},
},
light: {
main: {
shadow: true,
shadowQuality: "ultra",
},
},
viewControl: {
projection: "perspective",
autoRotate: false,
damping: 0,
rotateSensitivity: 2, //旋转操作的灵敏度
rotateMouseButton: "left", //旋转操作使用的鼠标按键
zoomSensitivity: 2, //缩放操作的灵敏度
panSensitivity: 2, //平移操作的灵敏度
panMouseButton: "right", //平移操作使用的鼠标按键
distance: 500, //默认视角距离主体的距离
center: [0, 0, 0],
animation: true,
animationDurationUpdate: 1000,
animationEasingUpdate: "cubicInOut",
},
},
{
type: "scatter3D",
coordinateSystem: "geo3D",
zlevel: 3,
// symbol:'path:// ',
// symbol: 'path://m232.99844,160.209511l15.863519,0l0,-14.211071l16.27296,0l0,14.211071l15.863521,0l0,14.577861l-15.863521,0l0,14.211069l-16.27296,0l0,-14.211069l-15.863519,0l0,-14.577861z',
// symbol: "circle",
symbolSize: 16,
label: {
normal: {
show: true,
position: "right",
formatter: "{b}",
textStyle: {
color: "#fff",
fontSize: 14,
backgroundColor: "transparent", // 字体背景色
},
},
},
data: [],
itemStyle: {
//坐标点颜色
color: "#67AE94",
shadowBlur: 20,
shadowColor: "#fff",
},
emphasis: {
itemStyle: {
//坐标点颜色
color: "#1ca1d2",
},
},
},
// {
// type: "scatter",
// coordinateSystem: "geo3d",
// zlevel: 5,
// // symbol:'path:// ',
// // symbol: 'path://m232.99844,160.209511l15.863519,0l0,-14.211071l16.27296,0l0,14.211071l15.863521,0l0,14.577861l-15.863521,0l0,14.211069l-16.27296,0l0,-14.211069l-15.863519,0l0,-14.577861z',
// // symbol: "circle",
// symbolSize: 16,
// rippleEffect: {
// scale: 5,
// brushType: "stroke",
// },
// label: {
// normal: {
// show: true,
// position: "right",
// formatter: "{b}",
// textStyle: {
// color: "#fff",
// fontSize: 14,
// backgroundColor: "transparent", // 字体背景色
// },
// },
// },
// data: [],
// },
// 线 和 点
{
type: "lines3D",
coordinateSystem: "geo3D",
zlevel: 1, //设置这个才会有轨迹线的小尾巴
polyline: false,
effect: {
show: true,
period: 10,
trailLength: 0.1,
trailColor: "#17eafe",
color: "#fff", //流动点颜色
symbol: "amarkLinesow",
symbolSize: 6,
},
lineStyle: {
normal: {
color: "#fff", //线条颜色
width: 1,
curveness: 0.5,
shadowColor: "#fff",
},
},
blendMode: "lighter",
data: [],
},
],
};
// 4. myChart.setOption
this.myChart.setOption(option);
// listen on click or hover event
this.myChart.on("click", async (arg) => {
console.log(arg);
const countyInfo = getCountyMapInfo(arg.name);
console.log(countyInfo);
if (countyInfo.key) {
if (!this.mapData[countyInfo.key]) {
const { data: ret } = await axios.get(
`//${location.host}${countyInfo.path}`
);
this.mapData[countyInfo.key] = ret;
this.$echarts.registerMap(countyInfo.key, ret);
}
this.$.getJSON("http://127.0.0.1:8000/api/map/county", (data) => {
console.log(typeof data, data instanceof Object);
this.mapData[countyInfo.key] = data;
this.$echarts.registerMap(countyInfo.key, data);
});
this.showBack = true;
const changeOption = {
geo: {
map: countyInfo.key,
},
};
this.myChart.setOption(changeOption);
}
});
this.myChart.on("mouseover", async (data) => {
console.log(data);
});
},
onScreenResize() {
this.fontSize = (this.$refs.echarts_map.offsetWidth / 100) * 3.6;
const adapterOption = {
title: {
textStyle: {
fontSize: this.fontSize,
},
},
// legend: {
// itemWidth: this.fontSize / 2,
// itemHeight: this.fontSize / 2,
// textStyle: {
// fontSize: this.fontSize / 2,
// },
// },
};
this.myChart.setOption(adapterOption);
this.myChart.resize();
},
handleSelect(key, keyPath) {
console.log(key, keyPath);
this.showScene();
},
showScene() {
console.log(this.tooltipVisible.scene);
this.tooltipVisible.scene = !this.tooltipVisible.scene;
},
showTourist() {},
revertMap() {
this.showBack = false;
const revertOption = {
geo: {
map: "wulingshan",
},
};
this.myChart.setOption(revertOption);
// this.updateChart();
},
},
};
</script>
<style scoped lang="scss">
@import "./index.scss";
</style>
https://blog.csdn.net/hadry123/article/details/102456263 ↩︎


 682
682


 被折叠的 条评论
为什么被折叠?
被折叠的 条评论
为什么被折叠?
 到【灌水乐园】发言


