


Harris角点检测算法仅仅能检测出图像中的兴趣点,但是没有给出通过比较图像间的兴趣点来寻找匹配点。为此我们需要加入描述算子来描述这些兴趣点。兴趣点描述子就是给兴趣点定义一个向量,描述该点附近的图像的表观信息。
Harris角点的描述子通常是周围像素的灰度值,以及用于比较的归一化的互相关矩阵组成。通常两个相同大小的像素块
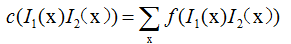
其中

其中n为像素块的总像素数,μ1和μ2分别是每个像素块的平均像素值,σ1和σ2是每个像素块的标准差,Harris角点检测可以从上一篇博客中找到,链接:传送门
我们将下面的代码加入上一篇博客的代码中,这段代码的作用是获取图像每个兴趣点的像素块:
def get_descriptors(image, filtered_coords, wid=5):
    '''
    对每个兴趣点,返回周围2*wid+1个像素的值
    :param image:
    :param filtered_coordes:
    :param wid:
    :return:
    '''
    desc = []
    for coords in filtered_coords:
        patch = image[coords[0] - wid: coords[0] + wid + 1, coords[1] - wid: coords[1] + wid + 1].flatten()
        desc.append(patch)

    return desc
下面代码是计算互相关矩阵和筛选大于阈值的点,为了更好的选择匹配点,先从第一幅图向第二幅图匹配,然后再反过来匹配,去除非对称的匹配:
def match(desc1, desc2, threshold=0.5):
    '''
    计算互相关矩阵和筛选大于阈值的点
    :param desc1:
    :param desc2:
    :param threshold:
    :return:
    '''
    n = len(desc1[0])

    # 互相关矩阵的计算和筛选
    d = -np.ones((len(desc1), len(desc2)))
    for i in range(len(desc1)):
        for j in range(len(desc2)):
            d1 = (desc1[i] - mean(desc1[i])) / std(desc1[i])
            d2 = (desc2[j] - mean(desc2[j])) / std(desc2[j])
            ncc_value = sum(d1 * d2) / (n - 1)
            if ncc_value > threshold:
                d[i, j] = ncc_value
    # 排序
    ndx = np.argsort(-d)
    matchscores = ndx[:, 0]
    return matchscores


def match_twosided(desc1, desc2, threshold=0.5):
    '''
    两边对称的匹配,删除不匹配的点
    :param desc1:
    :param desc2:
    :param threshold:
    :return:
    '''

    matches_12 = match(desc1, desc2, threshold)
    matches_21 = match(desc2, desc1, threshold)

    ndx_12 = where(matches_12 > 0)[0]

    # 去除不对称的匹配
    for n in ndx_12:
        if matches_21[matches_12[n]] != n:
            matches_12[n] = -1
    return matches_12
最后我们在图片上用连接线显示匹配点:
def appendimages(im1, im2):
    '''
    将图像拼接成一幅大图像
    :param im1:
    :param im2:
    :return:
    '''

    row1 = im1.shape[0]
    row2 = im2.shape[0]

    if row1 < row2:
        im1 = concatenate((im1, zeros((row2 - row1, im1.shape[1]))), axis=0)
    elif row1 > row2:
        im2 = concatenate((im2, zeros((row1 - row2, im2.shape[1]))), axis=0)

    return concatenate((im1, im2), axis=1)


def plot_matches(im1, im2, losc1, losc2, matchscores, show_below=True):
    '''
    显示图像匹配点之间的连接线
    :param im1:
    :param im2:
    :param losc1:
    :param losc2:
    :param matchscores:
    :param show_below:
    :return:
    '''
    im3 = appendimages(im1, im2)
    if show_below:
        im3 = vstack((im3, im3))

    imshow(im3)

    cols1 = im1.shape[1]
    for i, m in enumerate(matchscores):
        if m > 0:
            plot([losc1[i][1], losc2[m][1] + cols1], [losc1[i][0], losc2[m][0]], 'c')
    axis('off')
最后附上全部代码和效果图:
# coding=UTF-8
from PIL import Image
import numpy as np
from pylab import *
from scipy.ndimage import filters


def compute_harris_response(im, sigma=3):
    '''
    对每个像素值计算Harris角点检测器响应函数
    :param im:
    :param sigma:
    :return:
    '''

    # 计算导数
    im_x = np.zeros(im.shape)
    im_y = np.zeros(im.shape)
    filters.gaussian_filter(im, (sigma, sigma), (0, 1), im_x)
    filters.gaussian_filter(im, (sigma, sigma), (1, 0), im_y)

    # 计算Harris矩阵分量
    Ixx = filters.gaussian_filter(im_x * im_x, sigma)
    Ixy = filters.gaussian_filter(im_x * im_y, sigma)
    Iyy = filters.gaussian_filter(im_y * im_y, sigma)

    # 计算特征值和迹
    Idet = Ixx * Iyy - Ixy ** 2
    Itrace = Ixx + Iyy

    return Idet / Itrace


def get_harris_points(harrisim, min_dist=10, threshold=0.1):
    '''
    从Harrris响应图像中筛选角点
    :param harrisim:
    :param min_dist:
    :param threshold:
    :return:
    '''

    corner_threshold = harrisim.max() * threshold
    harrisim_t = (harrisim > corner_threshold) * 1

    # 获得候选点的坐标和对应的值
    coords = np.array(harrisim_t.nonzero()).T
    candidate_values = [harrisim[c[0], c[1]] for c in coords]

    # 对候选点排序
    index = np.argsort(candidate_values)

    # 将可行点存储在数组中
    allowed_locations = np.zeros(harrisim.shape)
    allowed_locations[min_dist:-min_dist, min_dist:-min_dist] = 1

    # 按照最小间距原则选择最佳Harris角点
    filtered_coords = []
    for i in index:
        if allowed_locations[coords[i,0], coords[i,1]] == 1:
            filtered_coords.append(coords[i])
            allowed_locations[(coords[i, 0]-min_dist):(coords[i, 0]+min_dist), (coords[i, 1]-min_dist):(coords[i, 1]+min_dist)] = 0

    return filtered_coords


def plot_corner_points(image, filtered_coords ):
    '''
    绘制图像中的角点
    :param image:
    :param filtered_coords:
    :return:
    '''
    imshow(image)
    plot([p[1] for p in filtered_coords], [p[0] for p in filtered_coords], '*')
    axis('off')


def get_descriptors(image, filtered_coords, wid=5):
    '''
    对每个兴趣点,返回周围2*wid+1个像素的值
    :param image:
    :param filtered_coordes:
    :param wid:
    :return:
    '''
    desc = []
    for coords in filtered_coords:
        patch = image[coords[0] - wid: coords[0] + wid + 1, coords[1] - wid: coords[1] + wid + 1].flatten()
        desc.append(patch)

    return desc


def match(desc1, desc2, threshold=0.5):
    '''
    计算互相关矩阵和筛选大于阈值的点
    :param desc1:
    :param desc2:
    :param threshold:
    :return:
    '''
    n = len(desc1[0])

    # 互相关矩阵的计算和筛选
    d = -np.ones((len(desc1), len(desc2)))
    for i in range(len(desc1)):
        for j in range(len(desc2)):
            d1 = (desc1[i] - mean(desc1[i])) / std(desc1[i])
            d2 = (desc2[j] - mean(desc2[j])) / std(desc2[j])
            ncc_value = sum(d1 * d2) / (n - 1)
            if ncc_value > threshold:
                d[i, j] = ncc_value
    # 排序
    ndx = np.argsort(-d)
    matchscores = ndx[:, 0]
    return matchscores


def match_twosided(desc1, desc2, threshold=0.5):
    '''
    两边对称的匹配,删除不匹配的点
    :param desc1:
    :param desc2:
    :param threshold:
    :return:
    '''

    matches_12 = match(desc1, desc2, threshold)
    matches_21 = match(desc2, desc1, threshold)

    ndx_12 = where(matches_12 > 0)[0]

    # 去除不对称的匹配
    for n in ndx_12:
        if matches_21[matches_12[n]] != n:
            matches_12[n] = -1
    return matches_12


def appendimages(im1, im2):
    '''
    将图像拼接成一幅大图像
    :param im1:
    :param im2:
    :return:
    '''

    row1 = im1.shape[0]
    row2 = im2.shape[0]

    if row1 < row2:
        im1 = concatenate((im1, zeros((row2 - row1, im1.shape[1]))), axis=0)
    elif row1 > row2:
        im2 = concatenate((im2, zeros((row1 - row2, im2.shape[1]))), axis=0)

    return concatenate((im1, im2), axis=1)


def plot_matches(im1, im2, losc1, losc2, matchscores, show_below=True):
    '''
    显示图像匹配点之间的连接线
    :param im1:
    :param im2:
    :param losc1:
    :param losc2:
    :param matchscores:
    :param show_below:
    :return:
    '''
    im3 = appendimages(im1, im2)
    if show_below:
        im3 = vstack((im3, im3))

    imshow(im3)

    cols1 = im1.shape[1]
    for i, m in enumerate(matchscores):
        if m > 0:
            plot([losc1[i][1], losc2[m][1] + cols1], [losc1[i][0], losc2[m][0]], 'c')
    axis('off')


def function_1():
    '''
    显示兴趣点
    :return:
    '''
    im = array(Image.open('1.jpg').convert('L'))
    harrsim = compute_harris_response(im)
    filter_coords1 = get_harris_points(harrsim, 10, 0.1)
    filter_coords2 = get_harris_points(harrsim, 10, 0.4)
    filter_coords3 = get_harris_points(harrsim, 10, 0.7)
    figure()
    gray()
    subplot(131)
    plot_corner_points(im, filter_coords1)
    title('threshold = 0.1')
    subplot(132)
    plot_corner_points(im, filter_coords2)
    title('threshold = 0.4')
    subplot(133)
    plot_corner_points(im, filter_coords3)
    title('threshold = 0.7')
    show()


def function_2():
    '''
    检测图像间的匹配点
    :return:
    '''
    wid = 5
    im1 = np.array(Image.open('crans_1_small.jpg').convert('L'))
    im2 = np.array(Image.open('crans_2_small.jpg').convert('L'))
    harrisiim = compute_harris_response(im1, 5)
    filtered_coords1 = get_harris_points(harrisiim, wid + 1)
    d1 = get_descriptors(im1, filtered_coords1, wid)

    harrisiim = compute_harris_response(im2, 5)
    filtered_coords2 = get_harris_points(harrisiim, wid + 1)
    d2 = get_descriptors(im2, filtered_coords2, wid)

    matches = match_twosided(d1, d2, 1)

    figure()
    gray()
    plot_matches(im1, im2, filtered_coords1, filtered_coords2, matches)
    show()


if __name__ == '__main__':
    function_2()
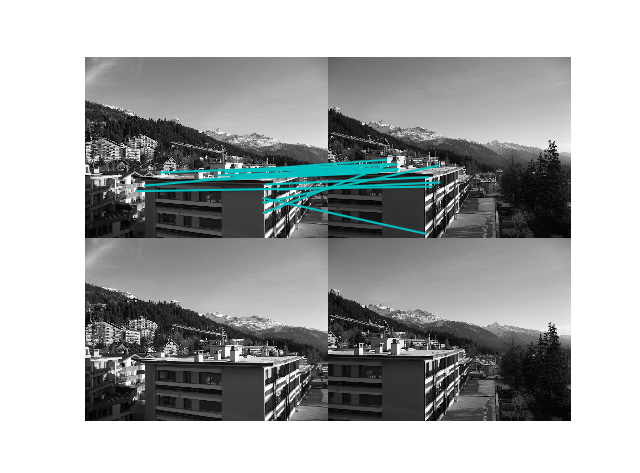
从结果看出,该算法存在一些不正确的匹配,这是由于互相关矩阵描述性不强造成的,同时它还不具有尺度不变性和旋转不变性,实际过程中通常使用更加稳健的算法来进行匹配点检测如SIFT算子等。


 1187
1187


 被折叠的 条评论
为什么被折叠?
被折叠的 条评论
为什么被折叠?
 到【灌水乐园】发言


