


前言
本文是wpf入门系列第五篇,面向有winform或者web前端基础的、并且也有C#基础的同学。
ECharts是百度团队开发的开源免费的js图表控件库,非常强大,文档齐全。WPF中使用图表,除了可以选择devexpress或者oxyplot之类的专为wpf开发的图表控件之外,还可以考虑使用 WebBrowser+ECharts 来完成复杂的图表展示,其展示效果不亚于前者。
本文介绍了 WPF中 使用 WebBrowser+ECharts 的方法,以及该种用法下的C#与JS的互相调用。
本文使用了 Visual Studio 2017 进行演示讲解。
wpf入门系列导航页面: https://blog.csdn.net/wf824284257/article/details/88757497
开始
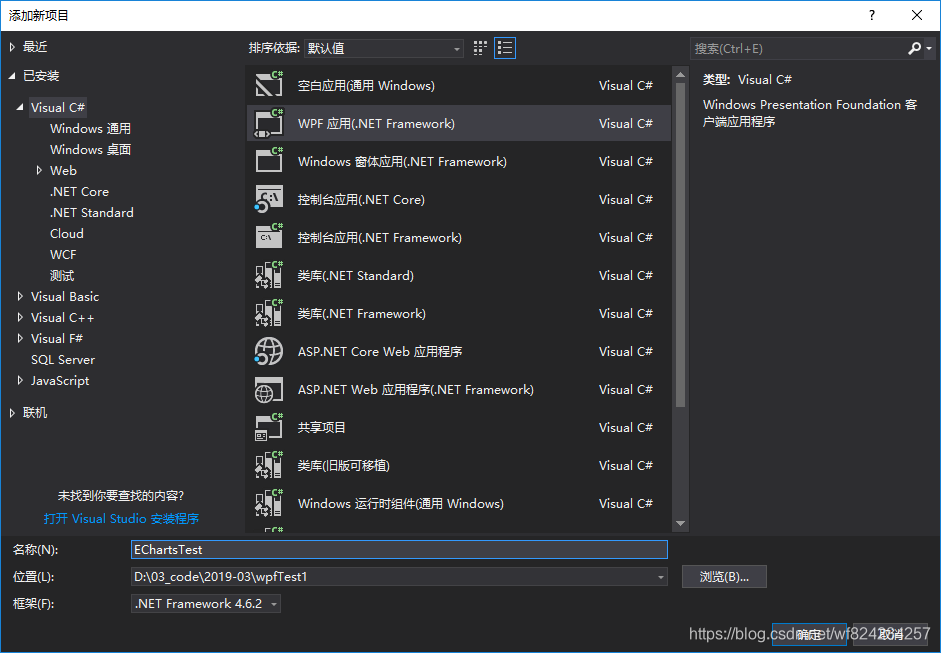
打开 VS2017,新建WPF项目,命名为 EChartsTest 。
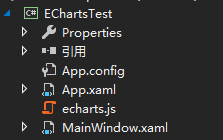
到ECharts官网 ( https://echarts.baidu.com/ )下载js文件,并添加到项目中:
编辑MainWindow.xaml为下面代码:
<Window x:Class="EChartsTest.MainWindow"
        xmlns="http://schemas.microsoft.com/winfx/2006/xaml/presentation"
        xmlns:x="http://schemas.microsoft.com/winfx/2006/xaml"
        xmlns:d="http://schemas.microsoft.com/expression/blend/2008"
        xmlns:mc="http://schemas.openxmlformats.org/markup-compatibility/2006"
        xmlns:local="clr-namespace:EChartsTest"
        mc:Ignorable="d"
        Title="MainWindow" Height="800" Width="1050">
    <Grid>
        <Grid.RowDefinitions>
            <RowDefinition Height="50"></RowDefinition>
            <RowDefinition></RowDefinition>
            <RowDefinition Height="100"></RowDefinition>
        </Grid.RowDefinitions>
        <TextBlock Grid.Row="0" Text="WPF with ECharts" HorizontalAlignment="Center" VerticalAlignment="Center" FontSize="25"></TextBlock>
        <WebBrowser Grid.Row="1" Name="Web"></WebBrowser>
        <StackPanel Grid.Row="2" Orientation="Horizontal" VerticalAlignment="Center">
            <TextBlock Text="wpf按钮: " FontSize="20"></TextBlock>
            <Button Grid.Row="2" Name="btnShowHide" Content="Show/Hide"  Click="btnShowHide_Click"></Button>
            <Button Grid.Row="2" Name="btnAddSeries" Content="PushData" Margin="10,0,0,0" Click="btnPushData_Click"></Button>
        </StackPanel>
    </Grid>
</Window>
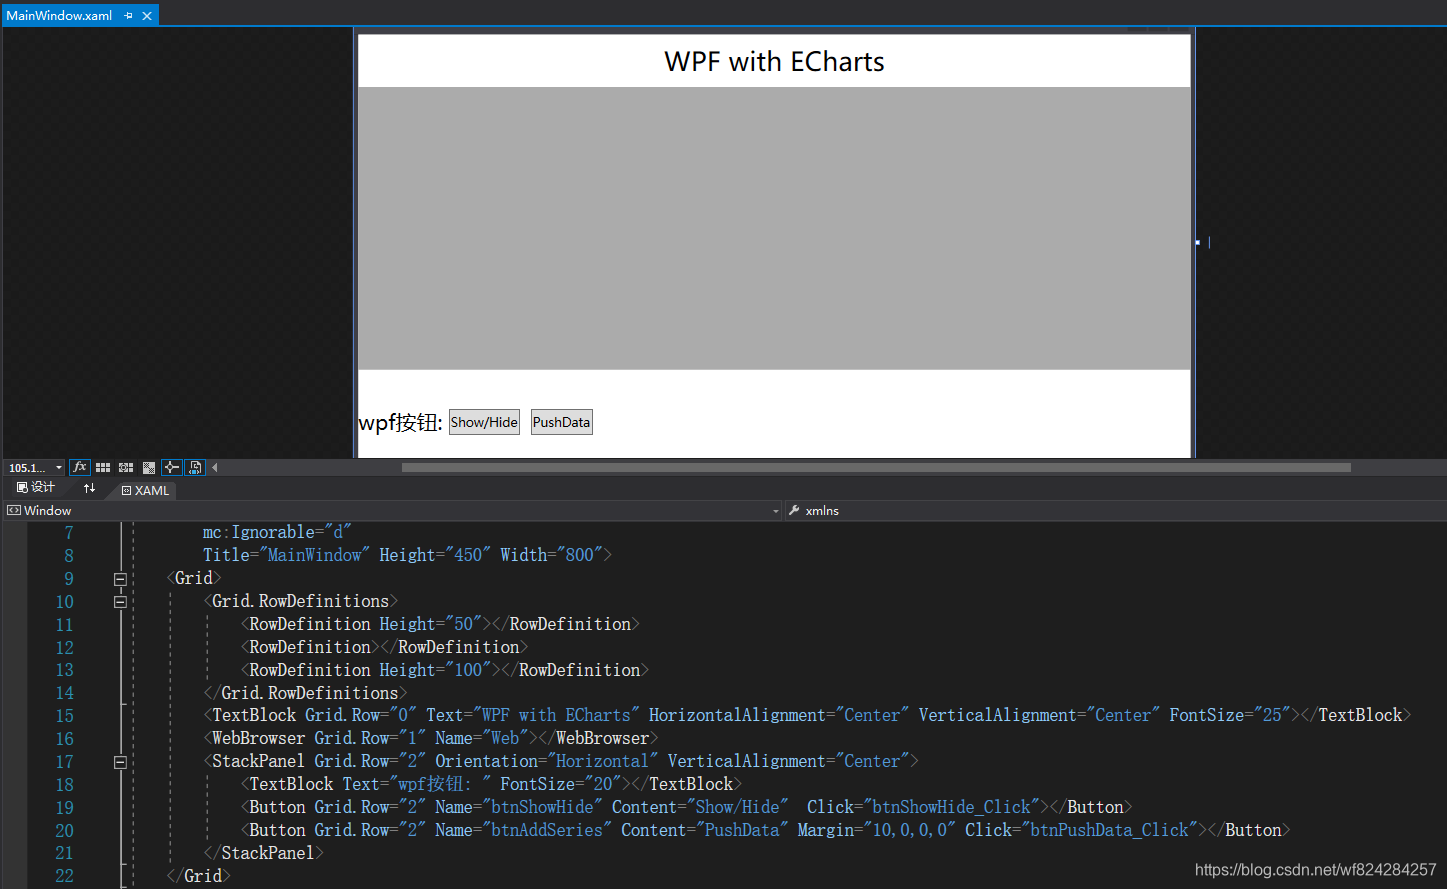
此时设计界面如下图所示:
将chart1.html中的代码替换为如下代码:
<!DOCTYPE html>

<html lang="zh-cn" xmlns="http://www.w3.org/1999/xhtml">
<!-- saved from url=(0013)about:internet -->
<head>
    <meta charset="utf-8" http-equiv="X-UA-Compatible" content="IE=5,6,7,8,9,10,11, chrome=1" />
    <title>ECharts</title>
</head>

<body>
    <h1>html页面</h1>
    <div id="main" style="width:1000px;height:500px;margin-left:-8px" />
    <script src="echarts.js"></script>
    <script>
        myChart = echarts.init(document.getElementById('main'));
        option = {
            xAxis: {
                type: 'category',
                data: ['Mon', 'Tue', 'Wed', 'Thu', 'Fri', 'Sat', 'Sun']
            },
            yAxis: {
                type: 'value'
            },
            series: [{
                data: [820, 932, 901, 934, 1290, 1330, 1320],
                type: 'line'
            }]
        };
        myChart.setOption(option);
    </script>
</body>
</html>
将MainWindow.xaml.cs 的代码替换为如下代码:
using System;
using System.Collections.Generic;
using System.IO;
using System.Linq;
using System.Text;
using System.Threading.Tasks;
using System.Windows;
using System.Windows.Controls;
using System.Windows.Data;
using System.Windows.Documents;
using System.Windows.Input;
using System.Windows.Media;
using System.Windows.Media.Imaging;
using System.Windows.Navigation;
using System.Windows.Shapes;

namespace EChartsTest
{
    /// <summary>
    /// MainWindow.xaml 的交互逻辑
    /// </summary>
    public partial class MainWindow : Window
    {
        public MainWindow()
        {
            InitializeComponent();
            Web.Navigate(new Uri(Directory.GetCurrentDirectory() + "/chart1.html"));
        }
        private void btnShowHide_Click(object sender, RoutedEventArgs e)
        {
        }
        private void btnPushData_Click(object sender, RoutedEventArgs e)
        {
        }
    }
}
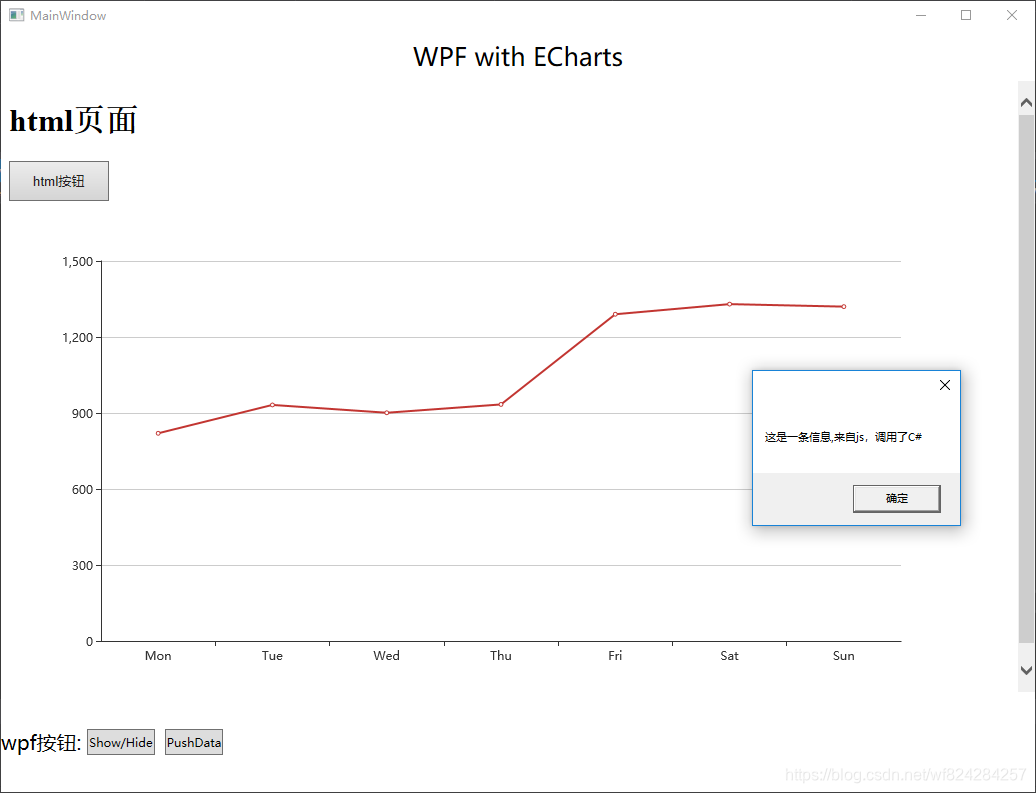
此时,按F5运行,界面显示如下:
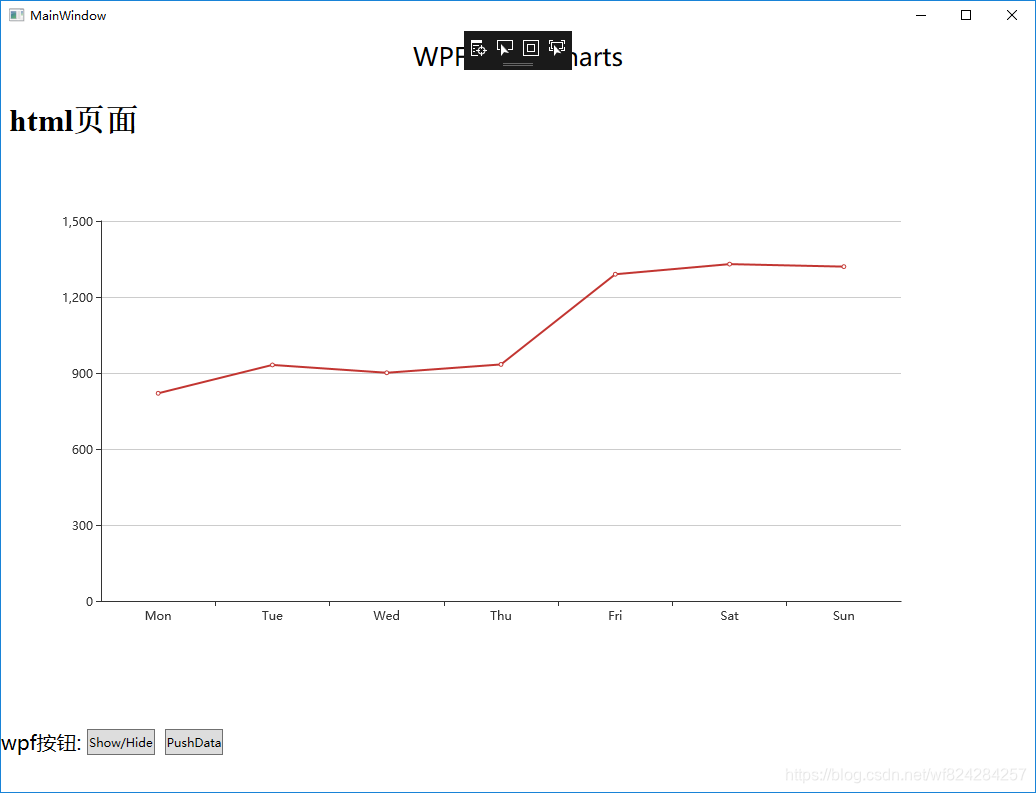
可以看到,显示效果非常好。
下面我们完善btnShowHide_Click和btnPushData_Click,使得C#代码可以控制html中单的ECharts。
C#中可以调用js方法。首先在chart1.html中script段添加下面代码:
function jsShowHide(info) {
    if (info == 0) {
        myChart.clear();
    }
    else {
        myChart.setOption(option);
    }
}
function jsPushData(x,y) {
    option.xAxis.data.push(x);
    option.series[0].data.push(y);
    myChart.setOption(option);
}
然后修改btnShowHide_Click和btnPushData_Click:
int show = 0;
private void btnShowHide_Click(object sender, RoutedEventArgs e)
{
    Web.InvokeScript("jsShowHide", show);
    if (show == 0) show = 1;
    else show = 0;
}
private void btnPushData_Click(object sender, RoutedEventArgs e)
{
    Web.InvokeScript("jsPushData","x",1000);
}
ps: 隐藏滚动条可以设置 html body style overflow 。
结束
本文通过一个小的测试项目来简单说明了 WPF 中 Echarts 的用法。若有其他需要可留言,24小时内回复。
本文所用代码示例可以在博主的资源页下载:https://download.csdn.net/download/wf824284257/11086021
---------------------
作者:Fanstorm
来源:CSDN
原文:https://blog.csdn.net/wf824284257/article/details/89002133
版权声明:本文为博主原创文章,转载请附上博文链接!


 1375
1375


 被折叠的 条评论
为什么被折叠?
被折叠的 条评论
为什么被折叠?
 到【灌水乐园】发言


