


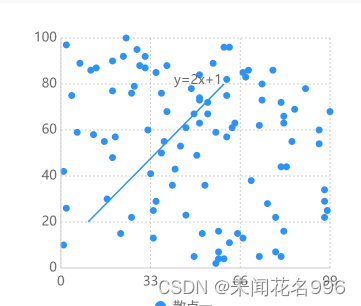
uCharts 散点图增加线条显示函数
如图所示,在散点图中增加一条线,和文本,显示一个线性函数,Q群管理员说只能改源码,那只好自己翻源码了,没实现曲线,自己可以根据代码改。
该方式需要修改源码,在u-charts.js中搜索drawScatterDataPoints方法,如图所示的位置
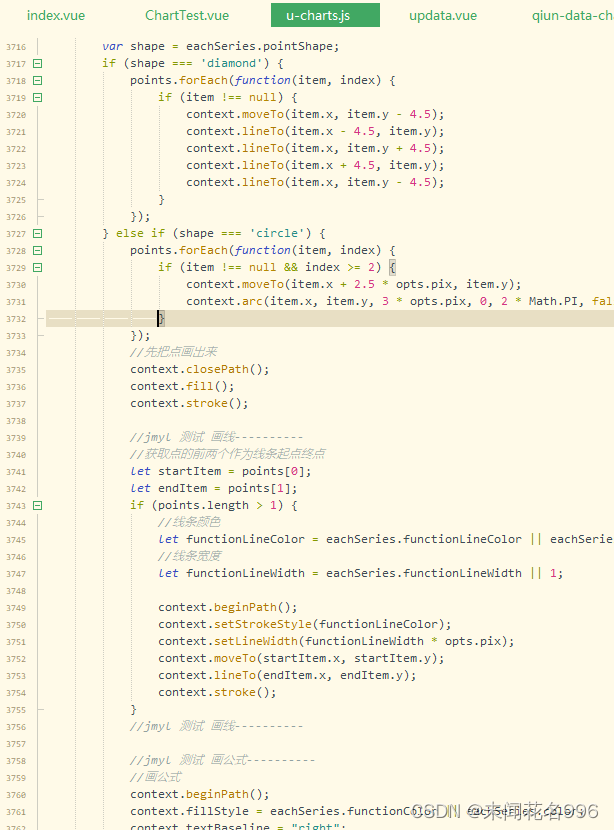
			points.forEach(function(item, index) {
				if (item !== null && index >= 2) {
					context.moveTo(item.x + 2.5 * opts.pix, item.y);
					context.arc(item.x, item.y, 3 * opts.pix, 0, 2 * Math.PI, false);
				}
			});
			//先把点画出来
			context.closePath();
			context.fill();
			context.stroke();

			//jmyl 测试 画线----------
			//获取点的前两个作为线条起点终点
			let startItem = points[0];
			let endItem = points[1];
			if (points.length > 1) {
				//线条颜色
				let functionLineColor = eachSeries.functionLineColor || eachSeries.color;
				//线条宽度
				let functionLineWidth = eachSeries.functionLineWidth || 1;

				context.beginPath();
				context.setStrokeStyle(functionLineColor);
				context.setLineWidth(functionLineWidth * opts.pix);
				context.moveTo(startItem.x, startItem.y);
				context.lineTo(endItem.x, endItem.y);
				context.stroke();
			}
			//jmyl 测试 画线----------

			//jmyl 测试 画公式----------
			//画公式
			context.beginPath();
			context.fillStyle = eachSeries.functionColor || eachSeries.color;
			context.textBaseline = "right";
			let fontSize = opts.legend.fontSize * opts.pix;
			context.setFontSize(fontSize);
			let functionOffsetLeft = eachSeries.functionOffsetLeft || 30;
			context.fillText(eachSeries.functionText, endItem.x - functionOffsetLeft, endItem.y);
			context.closePath();
			//jmyl 测试 画公式----------
调用方法:例子根据官网例子修改的,详细源码找官网
//模拟服务器返回数据,如果数据格式和标准格式不同,需自行按下面的格式拼接
				let res = {
					series: [{
						name: "散点一",
						functionText:"y=2x+1",
						functionColor:"#676767",
						//functionLineColor:"red",	//线条颜色
						functionLineWidth: 1.5,	//线条宽度
						functionOffsetLeft:50,	//函数左偏移量
						data: data
					}]
				};

				this.chartsDataLine = JSON.parse(JSON.stringify(res));


 1381
1381


 被折叠的 条评论
为什么被折叠?
被折叠的 条评论
为什么被折叠?
 到【灌水乐园】发言


