


1. Envoy集群管理
- 集群管理器与服务发现机制
- 主动健康状态检测与异常点探测
- 负载均衡策略
- 分布式负载均衡
- 负载均衡算法: 加权轮询,最少连接数,一致性hash,磁悬浮和随机等
- 区域感知路由
- 全局负载均衡
- 位置优先级
- 位置权重
- 均衡器子集
- 分布式负载均衡
- 熔断和连接池
2. 集群管理器
- Envoy支持同时配置任意数量的上游集群,并基于Cluster Manager管理他们
- Cluster Manager负责为集群管理上游主机的健康状态,负载均衡机制,连接池及适用协议等
- 生成集群配置的方式由静态和动态(CDS)两种
- 集群预热
- 集群在服务器启动或通过CDS进行初始化时需要一个预热过程,这意味着集群存在下列情况
- 初始服务发现加载完成之前不可用
- 配置了主动健康状态检查机制时,Envoy会主动发送健康状态检测请求报文到每个已发现上游主机
- 新增集群初始化完成之前对Envoy的其他组件来说不可见
- 对于需要更新的集群,在其预热完成后通过与旧集群的原子交换来确保不会发生流量中断类的错误.
- 集群在服务器启动或通过CDS进行初始化时需要一个预热过程,这意味着集群存在下列情况
3. 故障处理机制
Envoy提供了一系列开箱即用的故障处理机制
- 超时
- 有限次数的重试,并支持可变的重试延迟
- 主动健康检查与异常探测
- 连接池
- 断路器
3.1 健康状态检测
健康状态检测用于确保代理服务器不会将下游客户端的请求代理至工作异常的上游主机
Envoy支持两种类型的健康检测,二者基于集群进行定义:
- 主动检测(Active Health Checking): Envoy周期性地发送检测报文至上游主机,根据其响应判断其健康状态,Envoy目前支持三类的主动检测:
- HTTP: 向上游主机发送HTTP请求报文
- L3/L4: 向上游主机发送L3/L4请求报文,基于响应的结果判断健康状态,或通过连接状态进行判定
- Redis: 向上游的Redis服务器发送Redis PING
- 被动检测(Passive Health Checking): Envoy通常异常检测(Outlier Detection)机制进行被动模式的健康状态检测
- http router,tcp proxy,redis proxy支持异常值检测
- Envoy支持一下类型的异常检测
- 连续5XX: 意指所有类型的错误,非HTTP router过滤器生成的错误也会在内部被映射成5xx错误码
- 连续网关故障: 连续5XX的子集,单纯用于http的502,503或504错误,即网关故障
- 连续本地原因故障: Envoy无法连接到上游主机或上游主机的通信被反复终端
- 成功率: 主机的聚合成功率数据阈值
3.1.1 主动健康检测
clusters:
- name: ...
...
load_assignment:
  endpoints:
  - lb_endpoints:
    - endpoint:
      health_check_config:
        port_value:  # 自定义健康检查使用的端口
  health_checks:
  - timeout:  #超时时长
    interval:	# 时间间隔
    inital_jitter:		# 初始检测时间点散开量,以毫秒为单位,避免同一时间因检测造成的资源紧张
    interval_jitter:		# 间隔检测时间点散开量,以毫秒为单位
    unhealthy_threshold:		# 将主机标记为不健康状态的检测阈值,至少多少次不健康的检测后才将其标记为不可用
    healthy_threshold:			# 将主机标记为健康状态的检测阈值,但初始检测成功一次即视为主机健康
    http_health_check: {...}	# HTTP类型的检测,包括此种类型在内的4种检测类型必须选择一种
    tcp_health_check: {...}		# TCP类型的检测
    grpc_health_check: {...}		# GRPC类型的检测
    custom_health_check: {...}		# 自定义的检测
    reuse_connection:				#  布尔型值,是否在多次检测之间重用连接,默认true
    no_traffic_interval:  		# 定义未曾调度任何流量至集群时其端点健康检测时间间隔,一旦其接收流量即转为正常的时间间隔
    unhealthy_interval:		# 标记为"unhealthy"状态的端点健康检查时间间隔,一旦重新标记为healthy即转外正常时间间隔
    unhealth_edge_interval:  # 端点标记为"unhealthy"状态的端点健康检查时间间隔,随后即转为unhealth_interval的定义
    healthy_edge_interval:   # 端点标记为"healthy"状态的端点健康检查时间间隔,随后即转为interval的定义
    tls_options: {...}		# tls相关的配置
    transport_socket_match_criteria: {....}
4. 健康检测
4.1 基于HTTP的健康检测
4.1.1 docker-compose
五个Service:
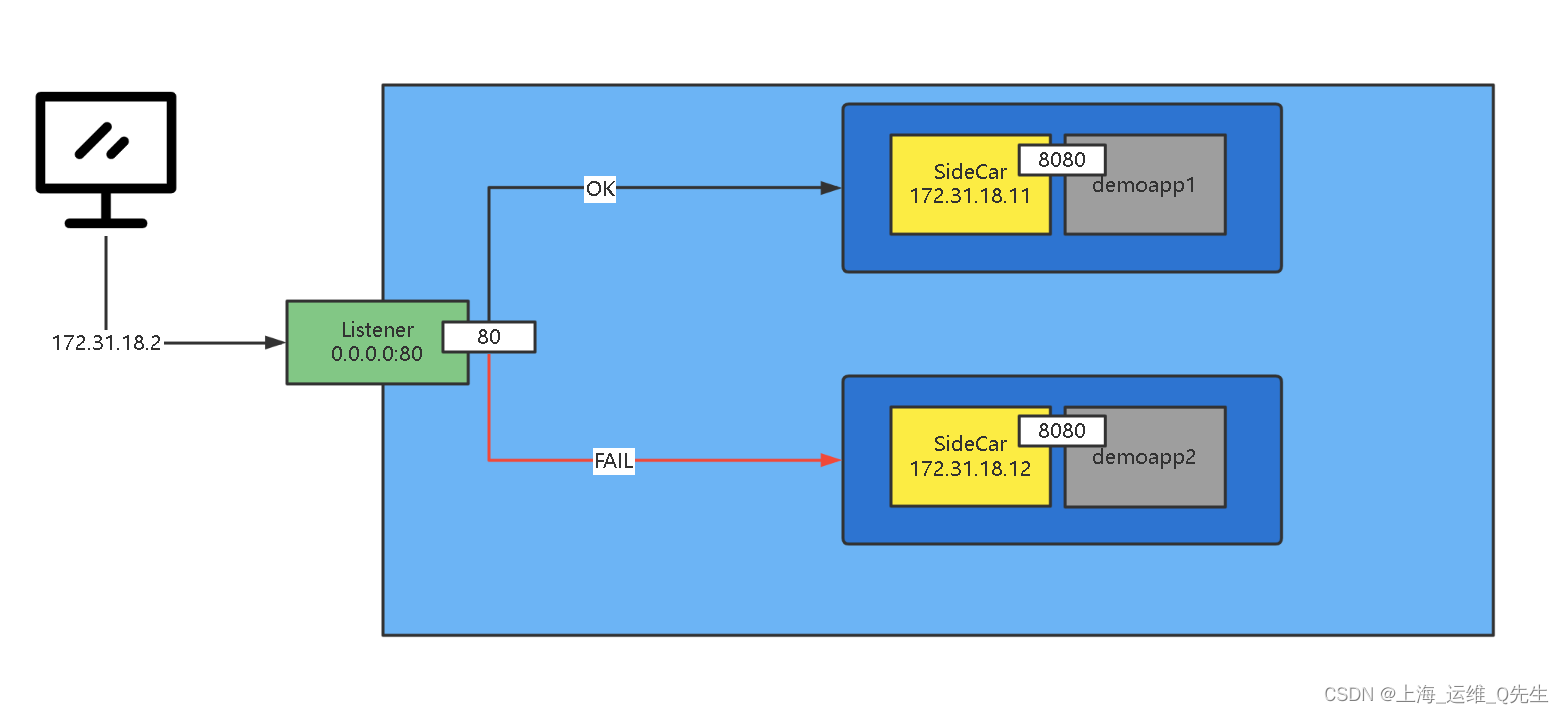
- envoy: Front Proxy,地址为172.31.18.2
- webserver01: 第一个后端服务
- webserver01-sidecat: 第一个后端服务的sidecar Proxy,地址为172.31.18.11
- webserver02: 第二个后端服务
- webserver02-sidecar: 第二个后端服务的sidecar Proxy,地址为172.31.18.12
version: '3.3'

services:
  envoy:
    image: envoyproxy/envoy-alpine:v1.21.5
    volumes:
    - ./front-envoy.yaml:/etc/envoy/envoy.yaml
    networks:
      envoymesh:
        ipv4_address: 172.31.18.2
        aliases:
        - front-proxy
    depends_on:
    - webserver01-sidecar
    - webserver02-sidecar

  webserver01-sidecar:
    image: envoyproxy/envoy-alpine:v1.21.5
    volumes:
    - ./envoy-sidecar-proxy.yaml:/etc/envoy/envoy.yaml
    hostname: red
    networks:
      envoymesh:
        ipv4_address: 172.31.18.11
        aliases:
        - myservice

  webserver01:
    image: ikubernetes/demoapp:v1.0
    environment:
      - PORT=8080
      - HOST=127.0.0.1
    network_mode: "service:webserver01-sidecar"
    depends_on:
    - webserver01-sidecar

  webserver02-sidecar:
    image: envoyproxy/envoy-alpine:v1.21.5
    volumes:
    - ./envoy-sidecar-proxy.yaml:/etc/envoy/envoy.yaml
    hostname: blue
    networks:
      envoymesh:
        ipv4_address: 172.31.18.12
        aliases:
        - myservice

  webserver02:
    image: ikubernetes/demoapp:v1.0
    environment:
      - PORT=8080
      - HOST=127.0.0.1
    network_mode: "service:webserver02-sidecar"
    depends_on:
    - webserver02-sidecar

networks:
  envoymesh:
    driver: bridge
    ipam:
      config:
        - subnet: 172.31.18.0/24
4.1.2 envoy.yaml
- front envoy 监听0.0.0.0:80 即172.31.18.2:80
- cluster对myservice的80做健康检查
- 超时5秒,间隔10秒对/livez监控,2次失败认为失败,2次成功认为恢复.如果返回值是200-399则认为前端服务器正常,否则健康检查失败
- myservice是webserver01-sidecar和webserver02-sidecar,请求转给sidecar80后再由sidecar转给webserver:8080
admin:
  profile_path: /tmp/envoy.prof
  access_log_path: /tmp/admin_access.log
  address:
    socket_address: { address: 0.0.0.0, port_value: 9901 }

static_resources:
  listeners:
  - name: listener_0
    address:
      socket_address: { address: 0.0.0.0, port_value: 80 }
    filter_chains:
    - filters:
      - name: envoy.filters.network.http_connection_manager
        typed_config:
          "@type": type.googleapis.com/envoy.extensions.filters.network.http_connection_manager.v3.HttpConnectionManager
          stat_prefix: ingress_http
          codec_type: AUTO
          route_config:
            name: local_route
            virtual_hosts:
            - name: webservice
              domains: ["*"]
              routes:
              - match: { prefix: "/" }
                route: { cluster: web_cluster_01 }
          http_filters:
          - name: envoy.filters.http.router
  clusters:
  - name: web_cluster_01
    connect_timeout: 0.25s
    type: STRICT_DNS
    lb_policy: ROUND_ROBIN
    load_assignment:
      cluster_name: web_cluster_01
      endpoints:
      - lb_endpoints:
        - endpoint:
            address:
              socket_address: { address: myservice, port_value: 80 }
    health_checks:
    - timeout: 5s
      interval: 10s
      unhealthy_threshold: 2
      healthy_threshold: 2
      http_health_check:
        path: /livez
        expected_statuses:
          start: 200
          end: 399
4.1.3 运行测试
# docker-compose up
root@k8s-node-1:~# curl 172.31.18.2:9901/listeners
listener_0::0.0.0.0:80
root@k8s-node-1:~# curl 172.31.18.2:9901/clusters
web_cluster_01::observability_name::web_cluster_01
web_cluster_01::default_priority::max_connections::1024
web_cluster_01::default_priority::max_pending_requests::1024
web_cluster_01::default_priority::max_requests::1024
web_cluster_01::default_priority::max_retries::3
web_cluster_01::high_priority::max_connections::1024
web_cluster_01::high_priority::max_pending_requests::1024
web_cluster_01::high_priority::max_requests::1024
web_cluster_01::high_priority::max_retries::3
web_cluster_01::added_via_api::false
web_cluster_01::172.31.18.12:80::cx_active::0
web_cluster_01::172.31.18.12:80::cx_connect_fail::0
web_cluster_01::172.31.18.12:80::cx_total::0
web_cluster_01::172.31.18.12:80::rq_active::0
web_cluster_01::172.31.18.12:80::rq_error::0
web_cluster_01::172.31.18.12:80::rq_success::0
web_cluster_01::172.31.18.12:80::rq_timeout::0
web_cluster_01::172.31.18.12:80::rq_total::0
web_cluster_01::172.31.18.12:80::hostname::myservice
web_cluster_01::172.31.18.12:80::health_flags::/failed_active_hc/active_hc_timeout
web_cluster_01::172.31.18.12:80::weight::1
web_cluster_01::172.31.18.12:80::region::
web_cluster_01::172.31.18.12:80::zone::
web_cluster_01::172.31.18.12:80::sub_zone::
web_cluster_01::172.31.18.12:80::canary::false
web_cluster_01::172.31.18.12:80::priority::0
web_cluster_01::172.31.18.12:80::success_rate::-1.0
web_cluster_01::172.31.18.12:80::local_origin_success_rate::-1.0
web_cluster_01::172.31.18.11:80::cx_active::0
web_cluster_01::172.31.18.11:80::cx_connect_fail::0
web_cluster_01::172.31.18.11:80::cx_total::0
web_cluster_01::172.31.18.11:80::rq_active::0
web_cluster_01::172.31.18.11:80::rq_error::0
web_cluster_01::172.31.18.11:80::rq_success::0
web_cluster_01::172.31.18.11:80::rq_timeout::0
web_cluster_01::172.31.18.11:80::rq_total::0
web_cluster_01::172.31.18.11:80::hostname::myservice
web_cluster_01::172.31.18.11:80::health_flags::/failed_active_hc/active_hc_timeout
web_cluster_01::172.31.18.11:80::weight::1
web_cluster_01::172.31.18.11:80::region::
web_cluster_01::172.31.18.11:80::zone::
web_cluster_01::172.31.18.11:80::sub_zone::
web_cluster_01::172.31.18.11:80::canary::false
web_cluster_01::172.31.18.11:80::priority::0
web_cluster_01::172.31.18.11:80::success_rate::-1.0
web_cluster_01::172.31.18.11:80::local_origin_success_rate::-1.0
root@k8s-node-1:~# curl -I 172.31.18.11
HTTP/1.1 200 OK
content-type: text/html; charset=utf-8
content-length: 90
server: envoy
date: Wed, 28 Sep 2022 04:50:27 GMT
x-envoy-upstream-service-time: 1

root@k8s-node-1:~# curl -I 172.31.18.12
HTTP/1.1 200 OK
content-type: text/html; charset=utf-8
content-length: 91
server: envoy
date: Wed, 28 Sep 2022 04:50:29 GMT
x-envoy-upstream-service-time: 1

root@k8s-node-1:~# curl 172.31.18.2
iKubernetes demoapp v1.0 !! ClientIP: 127.0.0.1, ServerName: blue, ServerIP: 172.31.18.12!
root@k8s-node-1:~# curl 172.31.18.2
iKubernetes demoapp v1.0 !! ClientIP: 127.0.0.1, ServerName: blue, ServerIP: 172.31.18.12!
root@k8s-node-1:~# curl 172.31.18.2
iKubernetes demoapp v1.0 !! ClientIP: 127.0.0.1, ServerName: red, ServerIP: 172.31.18.11!
root@k8s-node-1:~# curl 172.31.18.2
iKubernetes demoapp v1.0 !! ClientIP: 127.0.0.1, ServerName: blue, ServerIP: 172.31.18.12!
root@k8s-node-1:~# curl 172.31.18.2
iKubernetes demoapp v1.0 !! ClientIP: 127.0.0.1, ServerName: blue, ServerIP: 172.31.18.12!
root@k8s-node-1:~# curl 172.31.18.2
iKubernetes demoapp v1.0 !! ClientIP: 127.0.0.1, ServerName: red, ServerIP: 172.31.18.11!
4.1.4 制造意外让某个ep服务异常
- 将172.31.18.11/livez的livez设置成OK以外的状态,这样健康检查就会506报错
- 此时健康检查就会变成506
# curl 172.31.18.11/livez
OK# curl -XPOST -d "livez=FAIL" 172.31.18.11/livez
# curl 172.31.18.11/livez
FAIL#

webserver01_1          | 127.0.0.1 - - [28/Sep/2022 04:54:27] "GET /livez HTTP/1.1" 506 -
webserver02_1          | 127.0.0.1 - - [28/Sep/2022 04:54:32] "GET /livez HTTP/1.1" 200 -
webserver01_1          | 127.0.0.1 - - [28/Sep/2022 04:54:37] "GET /livez HTTP/1.1" 506 -
webserver02_1          | 127.0.0.1 - - [28/Sep/2022 04:54:42] "GET /livez HTTP/1.1" 200 -
webserver01_1          | 127.0.0.1 - - [28/Sep/2022 04:54:47] "GET /livez HTTP/1.1" 506 -
webserver02_1          | 127.0.0.1 - - [28/Sep/2022 04:54:52] "GET /livez HTTP/1.1" 200 -
webserver01_1          | 127.0.0.1 - - [28/Sep/2022 04:54:57] "GET /livez HTTP/1.1" 506 -
webserver02_1          | 127.0.0.1 - - [28/Sep/2022 04:55:02] "GET /livez HTTP/1.1" 200 -
webserver01_1          | 127.0.0.1 - - [28/Sep/2022 04:55:07] "GET /livez HTTP/1.1" 506 -

### 检测
root@k8s-node-1:~# while true;do curl 172.31.18.2;sleep 1;done
....
iKubernetes demoapp v1.0 !! ClientIP: 127.0.0.1, ServerName: red, ServerIP: 172.31.18.11!
iKubernetes demoapp v1.0 !! ClientIP: 127.0.0.1, ServerName: blue, ServerIP: 172.31.18.12!
iKubernetes demoapp v1.0 !! ClientIP: 127.0.0.1, ServerName: red, ServerIP: 172.31.18.11!
iKubernetes demoapp v1.0 !! ClientIP: 127.0.0.1, ServerName: red, ServerIP: 172.31.18.11!
iKubernetes demoapp v1.0 !! ClientIP: 127.0.0.1, ServerName: blue, ServerIP: 172.31.18.12!
iKubernetes demoapp v1.0 !! ClientIP: 127.0.0.1, ServerName: blue, ServerIP: 172.31.18.12!
iKubernetes demoapp v1.0 !! ClientIP: 127.0.0.1, ServerName: blue, ServerIP: 172.31.18.12!
iKubernetes demoapp v1.0 !! ClientIP: 127.0.0.1, ServerName: blue, ServerIP: 172.31.18.12!
恢复
# curl -XPOST -d "livez=OK" 172.31.18.11/livez
webserver01_1          | 127.0.0.1 - - [28/Sep/2022 05:06:57] "GET /livez HTTP/1.1" 200 -
webserver02_1          | 127.0.0.1 - - [28/Sep/2022 05:07:02] "GET /livez HTTP/1.1" 200 -
webserver01_1          | 127.0.0.1 - - [28/Sep/2022 05:07:07] "GET /livez HTTP/1.1" 200 -
webserver02_1          | 127.0.0.1 - - [28/Sep/2022 05:07:12] "GET /livez HTTP/1.1" 200 -
root@k8s-node-1:~# while true;do curl 172.31.18.2;sleep 1;done
iKubernetes demoapp v1.0 !! ClientIP: 127.0.0.1, ServerName: red, ServerIP: 172.31.18.11!
iKubernetes demoapp v1.0 !! ClientIP: 127.0.0.1, ServerName: blue, ServerIP: 172.31.18.12!
iKubernetes demoapp v1.0 !! ClientIP: 127.0.0.1, ServerName: blue, ServerIP: 172.31.18.12!
iKubernetes demoapp v1.0 !! ClientIP: 127.0.0.1, ServerName: blue, ServerIP: 172.31.18.12!
iKubernetes demoapp v1.0 !! ClientIP: 127.0.0.1, ServerName: red, ServerIP: 172.31.18.11!
iKubernetes demoapp v1.0 !! ClientIP: 127.0.0.1, ServerName: blue, ServerIP: 172.31.18.12!
4.2 基于TCP的健康检测
4.2.1 docker-compose
这部分其实和http的配置是一样的,唯一区别就是映射的envoy.yaml内容有变化
version: '3.3'

services:
  envoy:
    image: envoyproxy/envoy-alpine:v1.21.5
    volumes:
    - ./front-envoy-with-tcp-check.yaml:/etc/envoy/envoy.yaml
    networks:
      envoymesh:
        ipv4_address: 172.31.18.2
        aliases:
        - front-proxy
    depends_on:
    - webserver01-sidecar
    - webserver02-sidecar

  webserver01-sidecar:
    image: envoyproxy/envoy-alpine:v1.21.5
    volumes:
    - ./envoy-sidecar-proxy.yaml:/etc/envoy/envoy.yaml
    hostname: red
    networks:
      envoymesh:
        ipv4_address: 172.31.18.11
        aliases:
        - myservice

  webserver01:
    image: ikubernetes/demoapp:v1.0
    environment:
      - PORT=8080
      - HOST=127.0.0.1
    network_mode: "service:webserver01-sidecar"
    depends_on:
    - webserver01-sidecar

  webserver02-sidecar:
    image: envoyproxy/envoy-alpine:v1.21.5
    volumes:
    - ./envoy-sidecar-proxy.yaml:/etc/envoy/envoy.yaml
    hostname: blue
    networks:
      envoymesh:
        ipv4_address: 172.31.18.12
        aliases:
        - myservice

  webserver02:
    image: ikubernetes/demoapp:v1.0
    environment:
      - PORT=8080
      - HOST=127.0.0.1
    network_mode: "service:webserver02-sidecar"
    depends_on:
    - webserver02-sidecar

networks:
  envoymesh:
    driver: bridge
    ipam:
      config:
        - subnet: 172.31.18.0/24
4.2.2 envoy.yam
相对于http健康检查来说,这里只需要指定端口,而不用再指定路径.检查方式换成tcp_health_check即可
admin:
  profile_path: /tmp/envoy.prof
  access_log_path: /tmp/admin_access.log
  address:
    socket_address: { address: 0.0.0.0, port_value: 9901 }

static_resources:
  listeners:
  - name: listener_0
    address:
      socket_address: { address: 0.0.0.0, port_value: 80 }
    filter_chains:
    - filters:
      - name: envoy.filters.network.http_connection_manager
        typed_config:
          "@type": type.googleapis.com/envoy.extensions.filters.network.http_connection_manager.v3.HttpConnectionManager
          stat_prefix: ingress_http
          codec_type: AUTO
          route_config:
            name: local_route
            virtual_hosts:
            - name: webservice
              domains: ["*"]
              routes:
              - match: { prefix: "/" }
                route: { cluster: web_cluster_01 }
          http_filters:
          - name: envoy.filters.http.router
  clusters:
  - name: web_cluster_01
    connect_timeout: 0.25s
    type: STRICT_DNS
    lb_policy: ROUND_ROBIN
    load_assignment:
      cluster_name: web_cluster_01
      endpoints:
      - lb_endpoints:
        - endpoint:
            address:
              socket_address: { address: myservice, port_value: 80 }
    health_checks:
    - timeout: 5s
      interval: 10s
      unhealthy_threshold: 2
      healthy_threshold: 2
      tcp_health_check: {}
4.2.3 运行测试
部署后和http一样可以往2个ep上进行调度
root@k8s-node-1:~# curl 172.31.18.2:9901/clusters
web_cluster_01::observability_name::web_cluster_01
web_cluster_01::default_priority::max_connections::1024
web_cluster_01::default_priority::max_pending_requests::1024
web_cluster_01::default_priority::max_requests::1024
web_cluster_01::default_priority::max_retries::3
web_cluster_01::high_priority::max_connections::1024
web_cluster_01::high_priority::max_pending_requests::1024
web_cluster_01::high_priority::max_requests::1024
web_cluster_01::high_priority::max_retries::3
web_cluster_01::added_via_api::false
web_cluster_01::172.31.18.11:80::cx_active::0
web_cluster_01::172.31.18.11:80::cx_connect_fail::0
web_cluster_01::172.31.18.11:80::cx_total::0
web_cluster_01::172.31.18.11:80::rq_active::0
web_cluster_01::172.31.18.11:80::rq_error::0
web_cluster_01::172.31.18.11:80::rq_success::0
web_cluster_01::172.31.18.11:80::rq_timeout::0
web_cluster_01::172.31.18.11:80::rq_total::0
web_cluster_01::172.31.18.11:80::hostname::myservice
web_cluster_01::172.31.18.11:80::health_flags::healthy
web_cluster_01::172.31.18.11:80::weight::1
web_cluster_01::172.31.18.11:80::region::
web_cluster_01::172.31.18.11:80::zone::
web_cluster_01::172.31.18.11:80::sub_zone::
web_cluster_01::172.31.18.11:80::canary::false
web_cluster_01::172.31.18.11:80::priority::0
web_cluster_01::172.31.18.11:80::success_rate::-1.0
web_cluster_01::172.31.18.11:80::local_origin_success_rate::-1.0
web_cluster_01::172.31.18.12:80::cx_active::0
web_cluster_01::172.31.18.12:80::cx_connect_fail::0
web_cluster_01::172.31.18.12:80::cx_total::0
web_cluster_01::172.31.18.12:80::rq_active::0
web_cluster_01::172.31.18.12:80::rq_error::0
web_cluster_01::172.31.18.12:80::rq_success::0
web_cluster_01::172.31.18.12:80::rq_timeout::0
web_cluster_01::172.31.18.12:80::rq_total::0
web_cluster_01::172.31.18.12:80::hostname::myservice
web_cluster_01::172.31.18.12:80::health_flags::healthy
web_cluster_01::172.31.18.12:80::weight::1
web_cluster_01::172.31.18.12:80::region::
web_cluster_01::172.31.18.12:80::zone::
web_cluster_01::172.31.18.12:80::sub_zone::
web_cluster_01::172.31.18.12:80::canary::false
web_cluster_01::172.31.18.12:80::priority::0
web_cluster_01::172.31.18.12:80::success_rate::-1.0
web_cluster_01::172.31.18.12:80::local_origin_success_rate::-1.0
root@k8s-node-1:~# curl 172.31.18.2
iKubernetes demoapp v1.0 !! ClientIP: 127.0.0.1, ServerName: red, ServerIP: 172.31.18.11!
root@k8s-node-1:~# curl 172.31.18.2
iKubernetes demoapp v1.0 !! ClientIP: 127.0.0.1, ServerName: blue, ServerIP: 172.31.18.12!
root@k8s-node-1:~# curl 172.31.18.2
iKubernetes demoapp v1.0 !! ClientIP: 127.0.0.1, ServerName: red, ServerIP: 172.31.18.11!
root@k8s-node-1:~# curl 172.31.18.2
iKubernetes demoapp v1.0 !! ClientIP: 127.0.0.1, ServerName: red, ServerIP: 172.31.18.11!
root@k8s-node-1:~# curl 172.31.18.2
iKubernetes demoapp v1.0 !! ClientIP: 127.0.0.1, ServerName: blue, ServerIP: 172.31.18.12!
webserver01_1          | 127.0.0.1 - - [28/Sep/2022 05:24:57] "GET / HTTP/1.1" 200 -
webserver02_1          | 127.0.0.1 - - [28/Sep/2022 05:24:58] "GET / HTTP/1.1" 200 -
webserver01_1          | 127.0.0.1 - - [28/Sep/2022 05:24:59] "GET / HTTP/1.1" 200 -
webserver01_1          | 127.0.0.1 - - [28/Sep/2022 05:24:59] "GET / HTTP/1.1" 200 -
webserver02_1          | 127.0.0.1 - - [28/Sep/2022 05:25:00] "GET / HTTP/1.1" 200 -
4.2.4 制造意外
由于是TCP方式监控80端口,所以要么停掉80端口的服务,要么就直接把某个sidecar容器停掉
停止172.31.11.12的sidecar
# docker stop healthcheck_webserver02-sidecar_1
healthcheck_webserver02-sidecar_1
# curl 172.31.18.12
curl: (7) Failed to connect to 172.31.18.12 port 80: Connection timed out
root@k8s-node-1:~# curl 172.31.18.2
iKubernetes demoapp v1.0 !! ClientIP: 127.0.0.1, ServerName: red, ServerIP: 172.31.18.11!
root@k8s-node-1:~# curl 172.31.18.2
iKubernetes demoapp v1.0 !! ClientIP: 127.0.0.1, ServerName: red, ServerIP: 172.31.18.11!
root@k8s-node-1:~# curl 172.31.18.2
iKubernetes demoapp v1.0 !! ClientIP: 127.0.0.1, ServerName: red, ServerIP: 172.31.18.11!
root@k8s-node-1:~# curl 172.31.18.2
iKubernetes demoapp v1.0 !! ClientIP: 127.0.0.1, ServerName: red, ServerIP: 172.31.18.11!
root@k8s-node-1:~# curl 172.31.18.2
iKubernetes demoapp v1.0 !! ClientIP: 127.0.0.1, ServerName: red, ServerIP: 172.31.18.11!
root@k8s-node-1:~# curl 172.31.18.2:9901/clusters
web_cluster_01::observability_name::web_cluster_01
web_cluster_01::default_priority::max_connections::1024
web_cluster_01::default_priority::max_pending_requests::1024
web_cluster_01::default_priority::max_requests::1024
web_cluster_01::default_priority::max_retries::3
web_cluster_01::high_priority::max_connections::1024
web_cluster_01::high_priority::max_pending_requests::1024
web_cluster_01::high_priority::max_requests::1024
web_cluster_01::high_priority::max_retries::3
web_cluster_01::added_via_api::false
web_cluster_01::172.31.18.11:80::cx_active::4
web_cluster_01::172.31.18.11:80::cx_connect_fail::0
web_cluster_01::172.31.18.11:80::cx_total::4
web_cluster_01::172.31.18.11:80::rq_active::0
web_cluster_01::172.31.18.11:80::rq_error::0
web_cluster_01::172.31.18.11:80::rq_success::10
web_cluster_01::172.31.18.11:80::rq_timeout::0
web_cluster_01::172.31.18.11:80::rq_total::10
web_cluster_01::172.31.18.11:80::hostname::myservice
web_cluster_01::172.31.18.11:80::health_flags::healthy
web_cluster_01::172.31.18.11:80::weight::1
web_cluster_01::172.31.18.11:80::region::
web_cluster_01::172.31.18.11:80::zone::
web_cluster_01::172.31.18.11:80::sub_zone::
web_cluster_01::172.31.18.11:80::canary::false
web_cluster_01::172.31.18.11:80::priority::0
web_cluster_01::172.31.18.11:80::success_rate::-1.0
web_cluster_01::172.31.18.11:80::local_origin_success_rate::-1.0
恢复webserver02的sidecar
由于webserver02和webserver02-sidecar是共用一个network命名空间,所以这有需要重启webserver02
恢复2个container后没多久恢复172.31.18.12:80的健康检查,随即又可以同时往webserver01和webserver02分发流量
# docker start healthcheck_webserver02-sidecar_1
healthcheck_webserver02-sidecar_1
# docker restart healthcheck_webserver02_1
healthcheck_webserver02_1
root@k8s-node-1:~# curl 172.31.18.2:9901/clusters
web_cluster_01::observability_name::web_cluster_01
web_cluster_01::default_priority::max_connections::1024
web_cluster_01::default_priority::max_pending_requests::1024
web_cluster_01::default_priority::max_requests::1024
web_cluster_01::default_priority::max_retries::3
web_cluster_01::high_priority::max_connections::1024
web_cluster_01::high_priority::max_pending_requests::1024
web_cluster_01::high_priority::max_requests::1024
web_cluster_01::high_priority::max_retries::3
web_cluster_01::added_via_api::false
web_cluster_01::172.31.18.12:80::cx_active::0
web_cluster_01::172.31.18.12:80::cx_connect_fail::0
web_cluster_01::172.31.18.12:80::cx_total::0
web_cluster_01::172.31.18.12:80::rq_active::0
web_cluster_01::172.31.18.12:80::rq_error::0
web_cluster_01::172.31.18.12:80::rq_success::0
web_cluster_01::172.31.18.12:80::rq_timeout::0
web_cluster_01::172.31.18.12:80::rq_total::0
web_cluster_01::172.31.18.12:80::hostname::myservice
web_cluster_01::172.31.18.12:80::health_flags::healthy
web_cluster_01::172.31.18.12:80::weight::1
web_cluster_01::172.31.18.12:80::region::
web_cluster_01::172.31.18.12:80::zone::
web_cluster_01::172.31.18.12:80::sub_zone::
web_cluster_01::172.31.18.12:80::canary::false
web_cluster_01::172.31.18.12:80::priority::0
web_cluster_01::172.31.18.12:80::success_rate::-1.0
web_cluster_01::172.31.18.12:80::local_origin_success_rate::-1.0
web_cluster_01::172.31.18.11:80::cx_active::4
web_cluster_01::172.31.18.11:80::cx_connect_fail::0
web_cluster_01::172.31.18.11:80::cx_total::4
web_cluster_01::172.31.18.11:80::rq_active::0
web_cluster_01::172.31.18.11:80::rq_error::0
web_cluster_01::172.31.18.11:80::rq_success::10
web_cluster_01::172.31.18.11:80::rq_timeout::0
web_cluster_01::172.31.18.11:80::rq_total::10
web_cluster_01::172.31.18.11:80::hostname::myservice
web_cluster_01::172.31.18.11:80::health_flags::healthy
web_cluster_01::172.31.18.11:80::weight::1
web_cluster_01::172.31.18.11:80::region::
web_cluster_01::172.31.18.11:80::zone::
web_cluster_01::172.31.18.11:80::sub_zone::
web_cluster_01::172.31.18.11:80::canary::false
web_cluster_01::172.31.18.11:80::priority::0
web_cluster_01::172.31.18.11:80::success_rate::-1.0
web_cluster_01::172.31.18.11:80::local_origin_success_rate::-1.0


root@k8s-node-1:~# curl 172.31.18.2
iKubernetes demoapp v1.0 !! ClientIP: 127.0.0.1, ServerName: red, ServerIP: 172.31.18.11!
root@k8s-node-1:~# curl 172.31.18.2
iKubernetes demoapp v1.0 !! ClientIP: 127.0.0.1, ServerName: blue, ServerIP: 172.31.18.12!
root@k8s-node-1:~# curl 172.31.18.2
iKubernetes demoapp v1.0 !! ClientIP: 127.0.0.1, ServerName: red, ServerIP: 172.31.18.11!
root@k8s-node-1:~# curl 172.31.18.2
iKubernetes demoapp v1.0 !! ClientIP: 127.0.0.1, ServerName: blue, ServerIP: 172.31.18.12!
这个实验和上面http的差别不大,如果ep是http的服务的话,用http做health会更合适.
5. 异常检测(被动健康状态检测)
它并不主动发送检测报文,根据正常通讯流量的结果状态来判定是否存在异常.
异常主机驱逐机制
确定主机异常–> 如果未被驱逐,且已驱逐的数量低于允许的阈值,则驱逐主机,主机被驱逐一定时长,超时后会被重新加入,再对它进行检测判断是否再次驱逐.
主被动结合,主动频次降低,结合被动检测,不漏过主动没有检测到的异常,
主动只能对指定的特定对象进行检测.
被动可以对所有通信中的所有url结果状态.
常用的配置参数
cluster:
- name: ...
...
outlicer_detection:
  consecutive_5xx: #连续5xx错误弹出主机之前允许5xx错误数量,默认5
  interval: # 弹射分析扫描之间的时间间隔,默认10s
  base_ejection_time: # 主机被弹出的基准时长,实际时长=基准时长*次数,默认30s,第一异常被弹出是30,
  max_ejection_percent:	# 因异常探测而允许弹出的上游集群中的主机数量百分比,默认10%,不管%最少允许1个主机被弹出
  enforcing_consecutive_5xx:	#  基于连续5xx检测到主机异常时将主机弹出的几率,可用于禁止弹出或缓慢弹出,默认100
  enforcing_success_rate:		# 基于成功率检测主机异常时主机将被弹出的几率,可用于禁止弹出或缓慢弹出,默认100
  success_rate_minimum_hosts:	# 对集群启动成功率异常检测最少主机数,默认值5
  success_rate_request_volume:	# 在检测的一次时间间隔中必须收集的总请求的最小值,默认100
  success_rate_stdev_factor:	# 用确定成功率异常值弹出的弹射阈值的因子,弹射阈值=均值-(因子*平均成功率标准差)1.3时设置为1300
  consecutive_gateway_failure: # 因连续网关故障而弹出的最少连续故障数,默认5
  enforcing_consecutive_gateway_failure:	# 基于连续网关故障检测到异常状态时而弹出主机的几率百分比,默认0
  split_external_local_origin_errors:	# 是否区分本地原因导致的故障和外部故障,默认false,此项true时,下方3项才生效
  consecutive_local_origin_failure: # 因本地原因故障而弹出主机最少故障数,默认5
  enforcing_consecutive_loacl_origin_failure: # 基于连续的本地故障弹出百分比,默认100
  enforcing_local_origin_success_rate:	# 基于连续的本地故障,成功率统计异常弹出的几率,默认100
  failure_percentage_threshold: {...} # 故障百分比率,大于被弹出默认85
  enforcing_failure_percentage: {...}	# 基于故障百分比异常状态时,实际主机概率的百分比,默认0
  enforcing_failure_percentage_local_origin: {...} # 基于本地故障百分比统计信息检查到异常是,实际主机概率百分比,默认0
  failure_percentage_minimum_hosts: {...} # 集群中指向基于故障百分比主机的最小数量,默认5
  failure_percentage_request_volume: {...} # 时间间隔内收集总请求的最小数量,低于此值时主机不会被弹出,默认50
  max_ejection_time: {...}  # 主机弹出的最长时间,默认300s
5.1 异常检测实验
5.1.1 docker-compose
七个容器:
- envoy ip: 172.31.20.2
- 3个webserver 各带1个sidecar,分别是172.31.20.11,172.31.20.12,172.31.20.13
version: '3.3'

services:
  envoy:
    image: envoyproxy/envoy-alpine:v1.21.5
    volumes:
    - ./front-envoy.yaml:/etc/envoy/envoy.yaml
    networks:
      envoymesh:
        ipv4_address: 172.31.20.2
        aliases:
        - front-proxy
    depends_on:
    - webserver01-sidecar
    - webserver02-sidecar
    - webserver03-sidecar

  webserver01-sidecar:
    image: envoyproxy/envoy-alpine:v1.21.5
    volumes:
    - ./envoy-sidecar-proxy.yaml:/etc/envoy/envoy.yaml
    hostname: red
    networks:
      envoymesh:
        ipv4_address: 172.31.20.11
        aliases:
        - myservice

  webserver01:
    image: ikubernetes/demoapp:v1.0
    environment:
      - PORT=8080
      - HOST=127.0.0.1
    network_mode: "service:webserver01-sidecar"
    depends_on:
    - webserver01-sidecar

  webserver02-sidecar:
    image: envoyproxy/envoy-alpine:v1.21.5
    volumes:
    - ./envoy-sidecar-proxy.yaml:/etc/envoy/envoy.yaml
    hostname: blue
    networks:
      envoymesh:
        ipv4_address: 172.31.20.12
        aliases:
        - myservice

  webserver02:
    image: ikubernetes/demoapp:v1.0
    environment:
      - PORT=8080
      - HOST=127.0.0.1
    network_mode: "service:webserver02-sidecar"
    depends_on:
    - webserver02-sidecar

  webserver03-sidecar:
    image: envoyproxy/envoy-alpine:v1.21.5
    volumes:
    - ./envoy-sidecar-proxy.yaml:/etc/envoy/envoy.yaml
    hostname: green
    networks:
      envoymesh:
        ipv4_address: 172.31.20.13
        aliases:
        - myservice

  webserver03:
    image: ikubernetes/demoapp:v1.0
    environment:
      - PORT=8080
      - HOST=127.0.0.1
    network_mode: "service:webserver03-sidecar"
    depends_on:
    - webserver03-sidecar

networks:
  envoymesh:
    driver: bridge
    ipam:
      config:
        - subnet: 172.31.20.0/24
5.1.2 envoy.yaml
连续3次5xx弹出,基准弹出时长10秒,最大弹出10%的服务器,由于只有3个节点,那么最多被弹出1个.
admin:
  profile_path: /tmp/envoy.prof
  access_log_path: /tmp/admin_access.log
  address:
    socket_address: { address: 0.0.0.0, port_value: 9901 }

static_resources:
  listeners:
  - name: listener_0
    address:
      socket_address: { address: 0.0.0.0, port_value: 80 }
    filter_chains:
    - filters:
      - name: envoy.filters.network.http_connection_manager
        typed_config:
          "@type": type.googleapis.com/envoy.extensions.filters.network.http_connection_manager.v3.HttpConnectionManager
          stat_prefix: ingress_http
          codec_type: AUTO
          route_config:
            name: local_route
            virtual_hosts:
            - name: webservice
              domains: ["*"]
              routes:
              - match: { prefix: "/" }
                route: { cluster: web_cluster_01 }
          http_filters:
          - name: envoy.filters.http.router
  clusters:
  - name: web_cluster_01
    connect_timeout: 0.25s
    type: STRICT_DNS
    lb_policy: ROUND_ROBIN
    load_assignment:
      cluster_name: web_cluster_01
      endpoints:
      - lb_endpoints:
        - endpoint:
            address:
              socket_address: { address: myservice, port_value: 80 }
    outlier_detection:
      consecutive_5xx: 3
      base_ejection_time: 10s
      max_ejection_percent: 10
5.1.3 运行测试
- 监听在172.31.20.2:80
- web_cluster_01中3个ep,172.31.20.11:80,172.31.20.12:80,172.31.20.13:80
- 调度正常转发到3个ep上
# docker-compose up
root@k8s-node-1:~# curl 172.31.20.2:9901/listeners
listener_0::0.0.0.0:80
root@k8s-node-1:~# curl 172.31.20.2:9901/clusters
web_cluster_01::observability_name::web_cluster_01
web_cluster_01::outlier::success_rate_average::-1
web_cluster_01::outlier::success_rate_ejection_threshold::-1
web_cluster_01::outlier::local_origin_success_rate_average::-1
web_cluster_01::outlier::local_origin_success_rate_ejection_threshold::-1
web_cluster_01::default_priority::max_connections::1024
web_cluster_01::default_priority::max_pending_requests::1024
web_cluster_01::default_priority::max_requests::1024
web_cluster_01::default_priority::max_retries::3
web_cluster_01::high_priority::max_connections::1024
web_cluster_01::high_priority::max_pending_requests::1024
web_cluster_01::high_priority::max_requests::1024
web_cluster_01::high_priority::max_retries::3
web_cluster_01::added_via_api::false
web_cluster_01::172.31.20.11:80::cx_active::4
web_cluster_01::172.31.20.11:80::cx_connect_fail::0
web_cluster_01::172.31.20.11:80::cx_total::4
web_cluster_01::172.31.20.11:80::rq_active::0
web_cluster_01::172.31.20.11:80::rq_error::0
web_cluster_01::172.31.20.11:80::rq_success::6
web_cluster_01::172.31.20.11:80::rq_timeout::0
web_cluster_01::172.31.20.11:80::rq_total::6
web_cluster_01::172.31.20.11:80::hostname::myservice
web_cluster_01::172.31.20.11:80::health_flags::healthy
web_cluster_01::172.31.20.11:80::weight::1
web_cluster_01::172.31.20.11:80::region::
web_cluster_01::172.31.20.11:80::zone::
web_cluster_01::172.31.20.11:80::sub_zone::
web_cluster_01::172.31.20.11:80::canary::false
web_cluster_01::172.31.20.11:80::priority::0
web_cluster_01::172.31.20.11:80::success_rate::-1.0
web_cluster_01::172.31.20.11:80::local_origin_success_rate::-1.0
web_cluster_01::172.31.20.12:80::cx_active::4
web_cluster_01::172.31.20.12:80::cx_connect_fail::0
web_cluster_01::172.31.20.12:80::cx_total::4
web_cluster_01::172.31.20.12:80::rq_active::0
web_cluster_01::172.31.20.12:80::rq_error::0
web_cluster_01::172.31.20.12:80::rq_success::5
web_cluster_01::172.31.20.12:80::rq_timeout::0
web_cluster_01::172.31.20.12:80::rq_total::5
web_cluster_01::172.31.20.12:80::hostname::myservice
web_cluster_01::172.31.20.12:80::health_flags::healthy
web_cluster_01::172.31.20.12:80::weight::1
web_cluster_01::172.31.20.12:80::region::
web_cluster_01::172.31.20.12:80::zone::
web_cluster_01::172.31.20.12:80::sub_zone::
web_cluster_01::172.31.20.12:80::canary::false
web_cluster_01::172.31.20.12:80::priority::0
web_cluster_01::172.31.20.12:80::success_rate::-1.0
web_cluster_01::172.31.20.12:80::local_origin_success_rate::-1.0
web_cluster_01::172.31.20.13:80::cx_active::3
web_cluster_01::172.31.20.13:80::cx_connect_fail::0
web_cluster_01::172.31.20.13:80::cx_total::3
web_cluster_01::172.31.20.13:80::rq_active::0
web_cluster_01::172.31.20.13:80::rq_error::0
web_cluster_01::172.31.20.13:80::rq_success::4
web_cluster_01::172.31.20.13:80::rq_timeout::0
web_cluster_01::172.31.20.13:80::rq_total::4
web_cluster_01::172.31.20.13:80::hostname::myservice
web_cluster_01::172.31.20.13:80::health_flags::healthy
web_cluster_01::172.31.20.13:80::weight::1
web_cluster_01::172.31.20.13:80::region::
web_cluster_01::172.31.20.13:80::zone::
web_cluster_01::172.31.20.13:80::sub_zone::
web_cluster_01::172.31.20.13:80::canary::false
web_cluster_01::172.31.20.13:80::priority::0
web_cluster_01::172.31.20.13:80::success_rate::-1.0
web_cluster_01::172.31.20.13:80::local_origin_success_rate::-1.0

root@k8s-node-1:~# while true;do curl 172.31.20.2;sleep 1;done
iKubernetes demoapp v1.0 !! ClientIP: 127.0.0.1, ServerName: red, ServerIP: 172.31.20.11!
iKubernetes demoapp v1.0 !! ClientIP: 127.0.0.1, ServerName: red, ServerIP: 172.31.20.11!
iKubernetes demoapp v1.0 !! ClientIP: 127.0.0.1, ServerName: red, ServerIP: 172.31.20.11!
iKubernetes demoapp v1.0 !! ClientIP: 127.0.0.1, ServerName: green, ServerIP: 172.31.20.13!
iKubernetes demoapp v1.0 !! ClientIP: 127.0.0.1, ServerName: green, ServerIP: 172.31.20.13!
iKubernetes demoapp v1.0 !! ClientIP: 127.0.0.1, ServerName: red, ServerIP: 172.31.20.11!
iKubernetes demoapp v1.0 !! ClientIP: 127.0.0.1, ServerName: green, ServerIP: 172.31.20.13!
iKubernetes demoapp v1.0 !! ClientIP: 127.0.0.1, ServerName: green, ServerIP: 172.31.20.13!
iKubernetes demoapp v1.0 !! ClientIP: 127.0.0.1, ServerName: blue, ServerIP: 172.31.20.12!
iKubernetes demoapp v1.0 !! ClientIP: 127.0.0.1, ServerName: blue, ServerIP: 172.31.20.12!
iKubernetes demoapp v1.0 !! ClientIP: 127.0.0.1, ServerName: red, ServerIP: 172.31.20.11!

webserver03_1          | 127.0.0.1 - - [28/Sep/2022 07:25:30] "GET / HTTP/1.1" 200 -
webserver01_1          | 127.0.0.1 - - [28/Sep/2022 07:25:31] "GET / HTTP/1.1" 200 -
webserver02_1          | 127.0.0.1 - - [28/Sep/2022 07:25:31] "GET / HTTP/1.1" 200 -
webserver02_1          | 127.0.0.1 - - [28/Sep/2022 07:25:32] "GET / HTTP/1.1" 200 -
webserver02_1          | 127.0.0.1 - - [28/Sep/2022 07:25:32] "GET / HTTP/1.1" 200 -
webserver03_1          | 127.0.0.1 - - [28/Sep/2022 07:25:33] "GET / HTTP/1.1" 200 -
webserver03_1          | 127.0.0.1 - - [28/Sep/2022 07:25:33] "GET / HTTP/1.1" 200 -

root@k8s-node-1:~# while true;do curl 172.31.20.2/livez;sleep 0.5;done
OKOKOKOKOKOKOKOKOKOKOKOKOKOK
5.1.3.1 设置故障
当出现3次FAIL后就不再出现FAIL了.
当超时时间到达时,又会把该节点加回来,再次触发3次异常后,会比前1次的弹出时间更长.
# curl -XPOST -d "livez=FAIL" 172.31.20.11/live
root@k8s-node-1:~# while true;do curl 172.31.20.2/livez;sleep 0.5;done
OKOKOKOKOKOKOKOKOKOKOKOKOKOKOKOKOKOKOKOKOKOKOKOKOKOKOKOKOKOKOKOKOKOKOKOKOKOKOKOKOKOKOKOKOKOKOKOKOKOKOKOKOKOKOKOKOKOKOKOKOKOKOKOKOKOKOKOKOKOKOKOKOKOKOKOKOKOKOKOKOKOKOKOKOKOKOKOKOKOKOKOKOKOKOKFAILOKFAILOKOKFAILOKOKOKOKOKO
## 10秒之后FAIL的节点又会被加回来,再次出现3个FAIL,之后每次弹出加回来的时间会被增加
root@k8s-node-1:~# while true;do curl 172.31.20.2/livez;sleep 0.5;done
OKOKOKOKOKOKOKOKOKOKOKOKOKOKOKOKOKOKOKOKOKOKOKOKOKOKOKOKOKOKOKOKOKOKOKOKOKOKOKOKOKOKOKOKOKOKOKOKOKOKOKOKOKOKOKOKOKOKOKOKOKOKOKOKOKOKOKOKOKOKOKOKOKOKOKOKOKOKOKOKOKOKOKOKOKOKOKOKOKOKOKOKOKOKOKFAILOKFAILOKOKFAILOKOKOKOKOKOKOKOKOKOKOKOKOKOKOKOKOKOKOKOKOKOKOKOKOKOKOKOKOKOKFAILOKFAILOKOKOKFAILOKOKOKOKOKOKOKOKOKOKOKOKOKOKOKOKOKOKOKOKOKOKOKOKOKOKOKOKOKOKOKOKOKOKOKOKOKOKOKOKOKOKOKOKOKOKOKOKOKFAILOKOKOKFAILOKOKFAILOKOKOKOKOKOKOKOKOKOKOKOKOKOKOKOKOKOKOKOKOKOKOKOKOKOKOKOKOKOKOKOKOKOKOKOKOKOKOKOKOKOKOKOKOKOKOKOKOKOKOKOKOKOKOKOKOKOKOKOKOKOKOKOKOKOKOKOKOKFAILOKOKFAILOKOKOKFAILOKOKOKOKOKOKOKOKOKOKOKOKOKOKOKOKOKOKOKOKOKOKOKOKOKOKOKOKOKOKOKOKOKOKOKOKOKOKOKOKOKOKOKOKOKOKOKOKOKOKOKOKOKOKOKOKOKOKOKOKOKOKOKOKOKOKOKOKOKOKOKOKOKOKOKOKOKOKOKOKOKOKOKOKOKOKOKOKOKOKFAILOKFAILOKFAILOKOKOKOKOKOKOKOKOKOKOKOKOKOKOKOKOKOKOKOKOKOKOKOKOKOKOKOKOKOKOKOKOKOKOKOKOKOKOKOKOKOKOKOKOKOKOKOKOKOKOKOKOKOKOKOKOKOKOKOKOKOKOKOKOKOKOKOKOKOKOK

## 此时只有02和03正在提供服务.
webserver02_1          | 127.0.0.1 - - [28/Sep/2022 07:31:46] "GET /livez HTTP/1.1" 200 -
webserver03_1          | 127.0.0.1 - - [28/Sep/2022 07:31:46] "GET /livez HTTP/1.1" 200 -
webserver02_1          | 127.0.0.1 - - [28/Sep/2022 07:31:47] "GET /livez HTTP/1.1" 200 -
webserver03_1          | 127.0.0.1 - - [28/Sep/2022 07:31:47] "GET /livez HTTP/1.1" 200 -
webserver02_1          | 127.0.0.1 - - [28/Sep/2022 07:31:48] "GET /livez HTTP/1.1" 200 -
webserver03_1          | 127.0.0.1 - - [28/Sep/2022 07:31:48] "GET /livez HTTP/1.1" 200 -
webserver02_1          | 127.0.0.1 - - [28/Sep/2022 07:31:49] "GET /livez HTTP/1.1" 200 -
webserver02_1          | 127.0.0.1 - - [28/Sep/2022 07:31:49] "GET /livez HTTP/1.1" 200 -
webserver03_1          | 127.0.0.1 - - [28/Sep/2022 07:31:50] "GET /livez HTTP/1.1" 200 -
webserver02_1          | 127.0.0.1 - - [28/Sep/2022 07:31:50] "GET /livez HTTP/1.1" 200
当触发2个故障节点时,只会有1个被弹出,这样我们任然能看到FAIL的提示
OKOKFAILOKOKFAILOKFAILFAILOKFAILFAILOKFAILOKFAILOKOKFAILFAILOKOKFAILFAILOKOKOKOKFAILFAILFAILOKFAILOKOKOKFAILFAILFAILOKFAILOKFAIL
5.1.3.2 故障消除
故障消除后,连续3次检查正常,就恢复了调度
# curl -XPOST -d "livez=OK" 172.31.20.11/livez
webserver01_1          | 127.0.0.1 - - [28/Sep/2022 07:34:14] "GET /livez HTTP/1.1" 200 -
webserver03_1          | 127.0.0.1 - - [28/Sep/2022 07:34:15] "GET /livez HTTP/1.1" 200 -
webserver02_1          | 127.0.0.1 - - [28/Sep/2022 07:34:15] "GET /livez HTTP/1.1" 200 -
webserver01_1          | 127.0.0.1 - - [28/Sep/2022 07:34:16] "GET /livez HTTP/1.1" 200 -
webserver03_1          | 127.0.0.1 - - [28/Sep/2022 07:34:16] "GET /livez HTTP/1.1" 200 -
webserver02_1          | 127.0.0.1 - - [28/Sep/2022 07:34:17] "GET /livez HTTP/1.1" 200 -
webserver02_1          | 127.0.0.1 - - [28/Sep/2022 07:34:17] "GET /livez HTTP/1.1" 200 -
webserver03_1          | 127.0.0.1 - - [28/Sep/2022 07:34:18] "GET /livez HTTP/1.1" 200 -


 1039
1039

 被折叠的 条评论
为什么被折叠?
被折叠的 条评论
为什么被折叠?
 到【灌水乐园】发言


